A full-stack solution for monitoring and analyzing NeoLoad performance test results in real-time. This project consists of a Spring Boot backend API and two specialized React dashboards.
neoloaddash/
├── neoloadstat-backend/     # Spring Boot API
└── neoloadstat-frontend/    # React dashboards
Connects to your NeoLoad API, aggregates test results across workspaces, and presents them in two dashboard views:
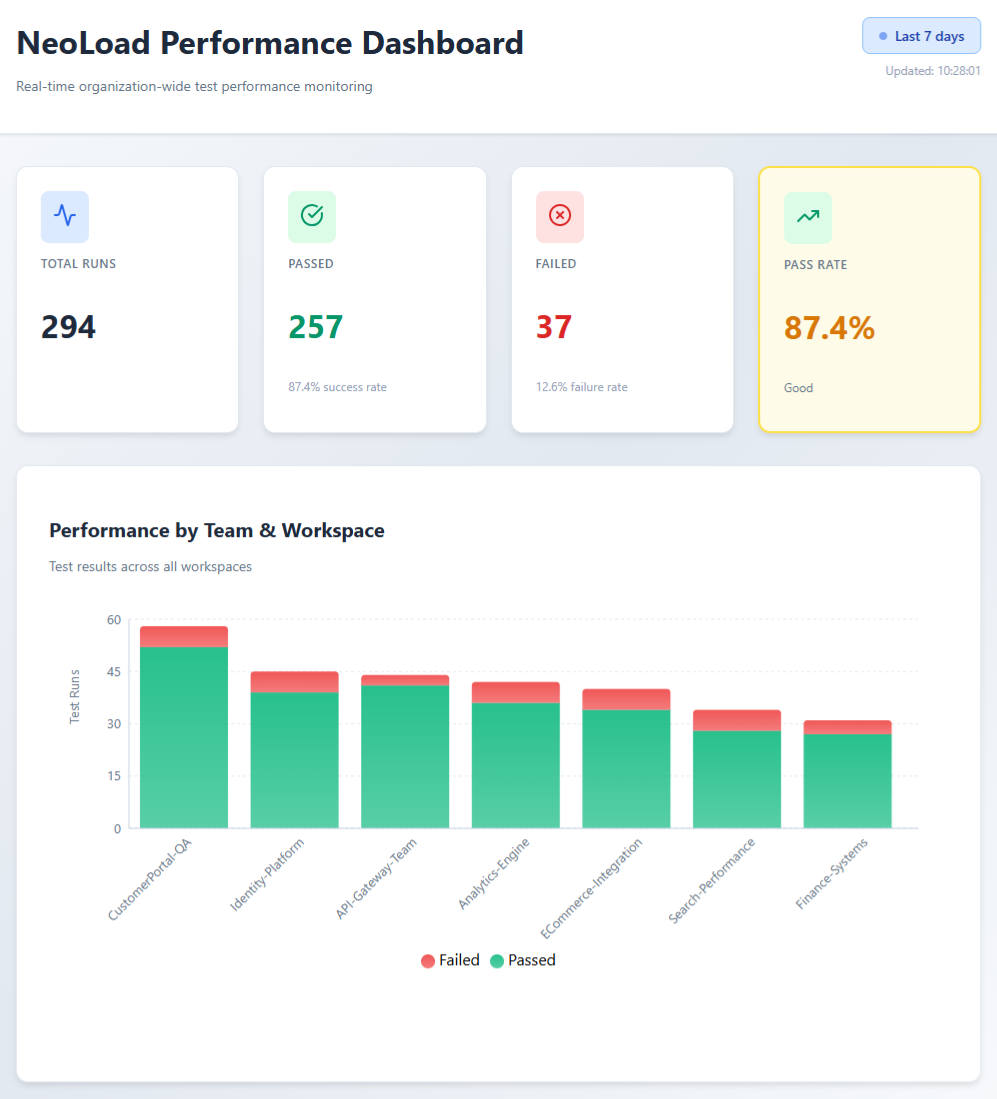
- Big Screen Dashboard - Real-time monitoring display for team areas
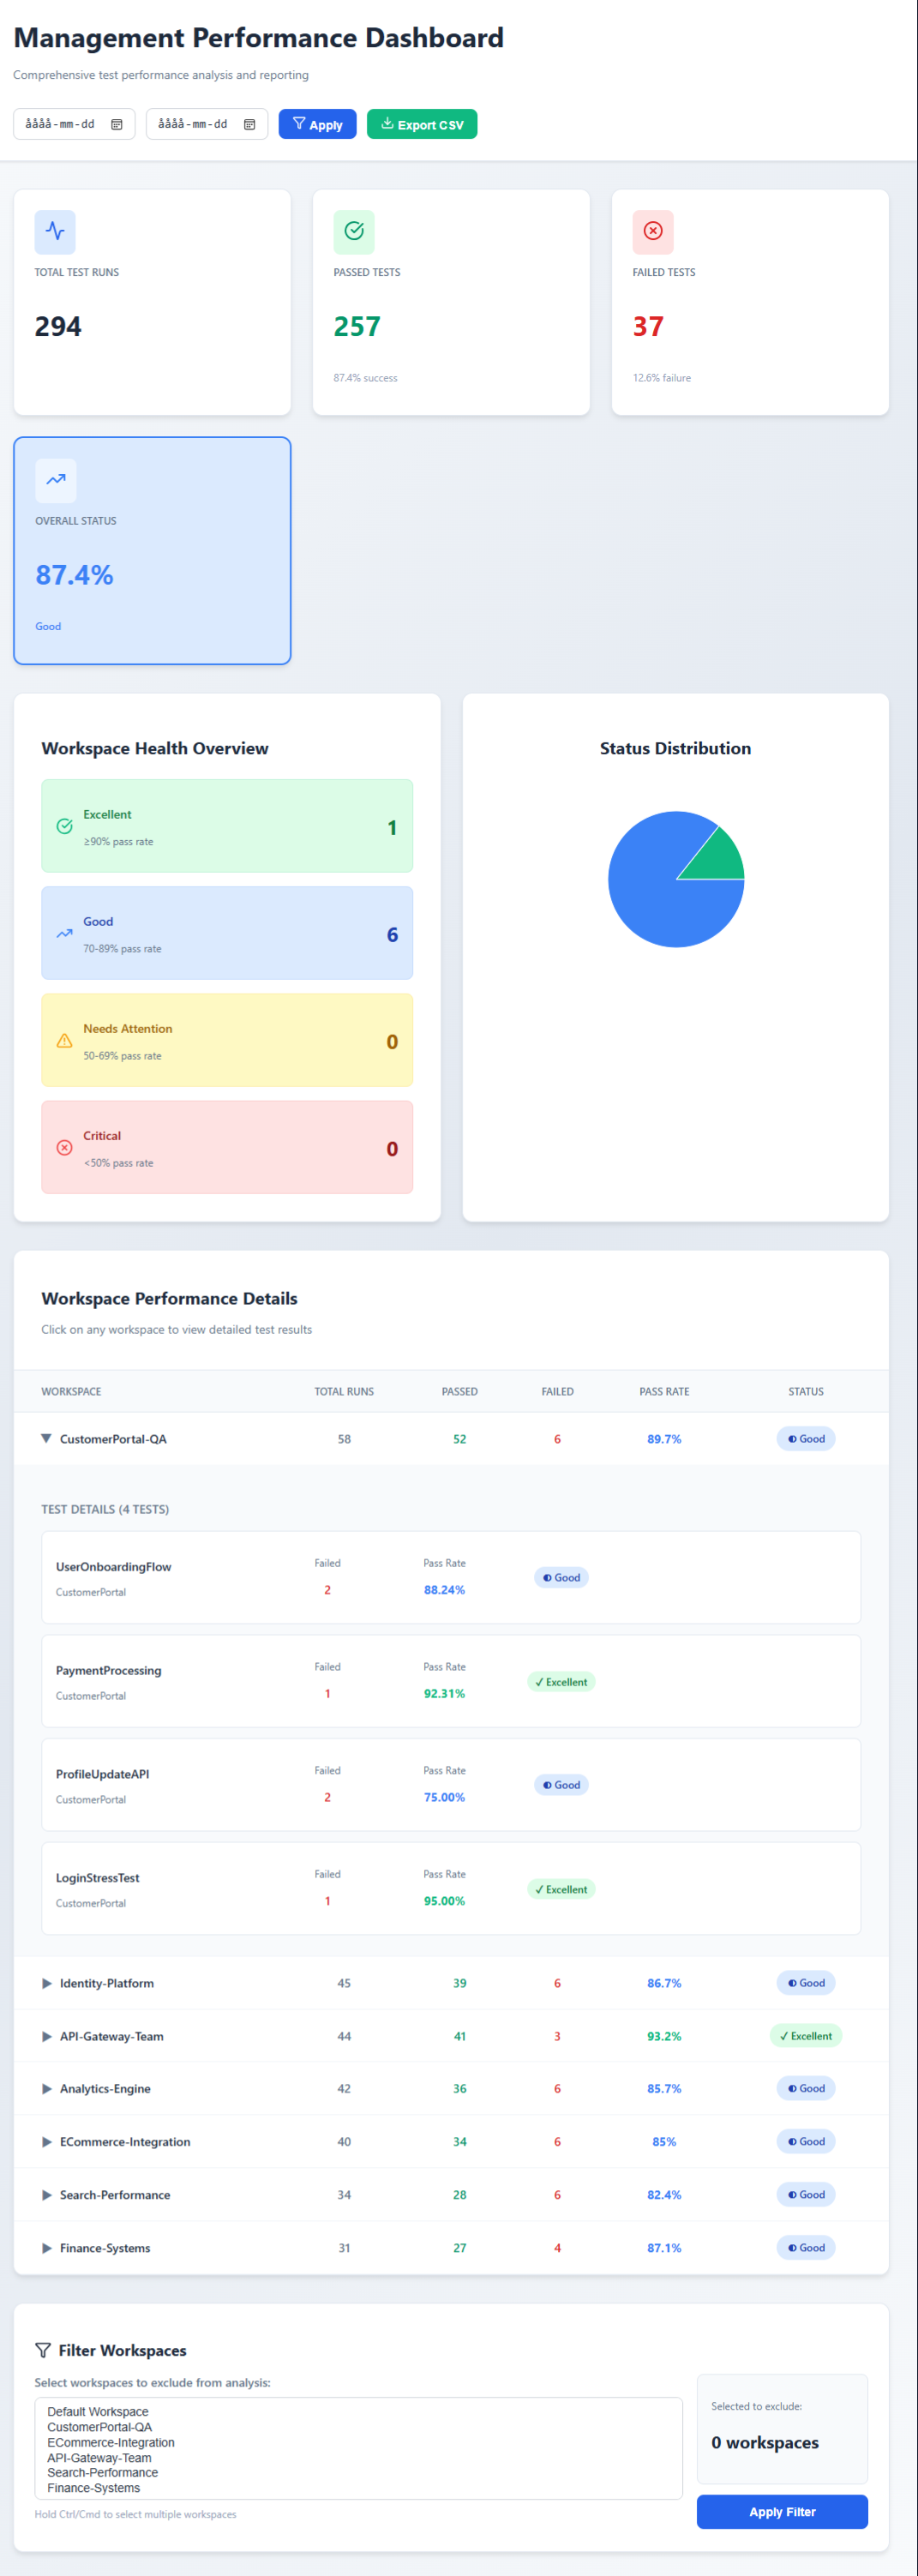
- Management Dashboard - Detailed analysis and reporting tools
- Java 17+
- Node.js 14+
- Access to NeoLoad Web API
- NeoLoad API token
Purpose: Real-time monitoring for team displays
Features:
- Large KPI cards (Total Runs, Passed, Failed, Pass Rate)
- Bar chart showing performance by workspace
- Auto-refresh every 5 minutes
- URL parameter for time range:
?days=7(default: 30) - No scrolling required - optimized for 1920×1080 displays
URL Parameters:
?days=7– Show data from last ex 7 days (default: 30)?dark=true– Enable dark mode (default: light)
Best for:
- Team area monitors
- War room displays
- Quick status checks
Purpose: Detailed analysis and reporting
Features:
- Status categorization (Excellent ≥90%, Good 70-89%, Needs Attention 50-69%, Critical <50%)
- Workspace health overview with visual indicators
- Status distribution pie chart
- Detailed performance table
- CSV export functionality
- Date range filtering
- Workspace exclusion filters
Best for:
- Sprint reviews
- Management reports
- Performance analysis
- Stakeholder presentations