Repository navigation
Dashboard Guide
Once the MAK Grill integration is installed and your grill is posting to HA, you'll want a dashboard to monitor and control it. This guide walks through creating a dedicated MAK Grill dashboard.
The integration includes a Create Dashboard button that builds the entire dashboard for you:
- Go to Settings → Devices → MAK Grill
- Find the Create Dashboard button (under Configuration)
- Press it — a fully configured "MAK Grill" dashboard appears in your sidebar
That's it. The button creates the dashboard with all the cards described below, using the correct entity IDs for your grill.
If you prefer to build it yourself, or want to customize the layout:
- Go to Settings → Dashboards
- Click Add Dashboard
- Name it MAK Grill
- Open the new dashboard and click the pencil icon (top right) to edit
- Click Add Card to start building
Here's a layout that gives you everything at a glance, organized into logical sections.
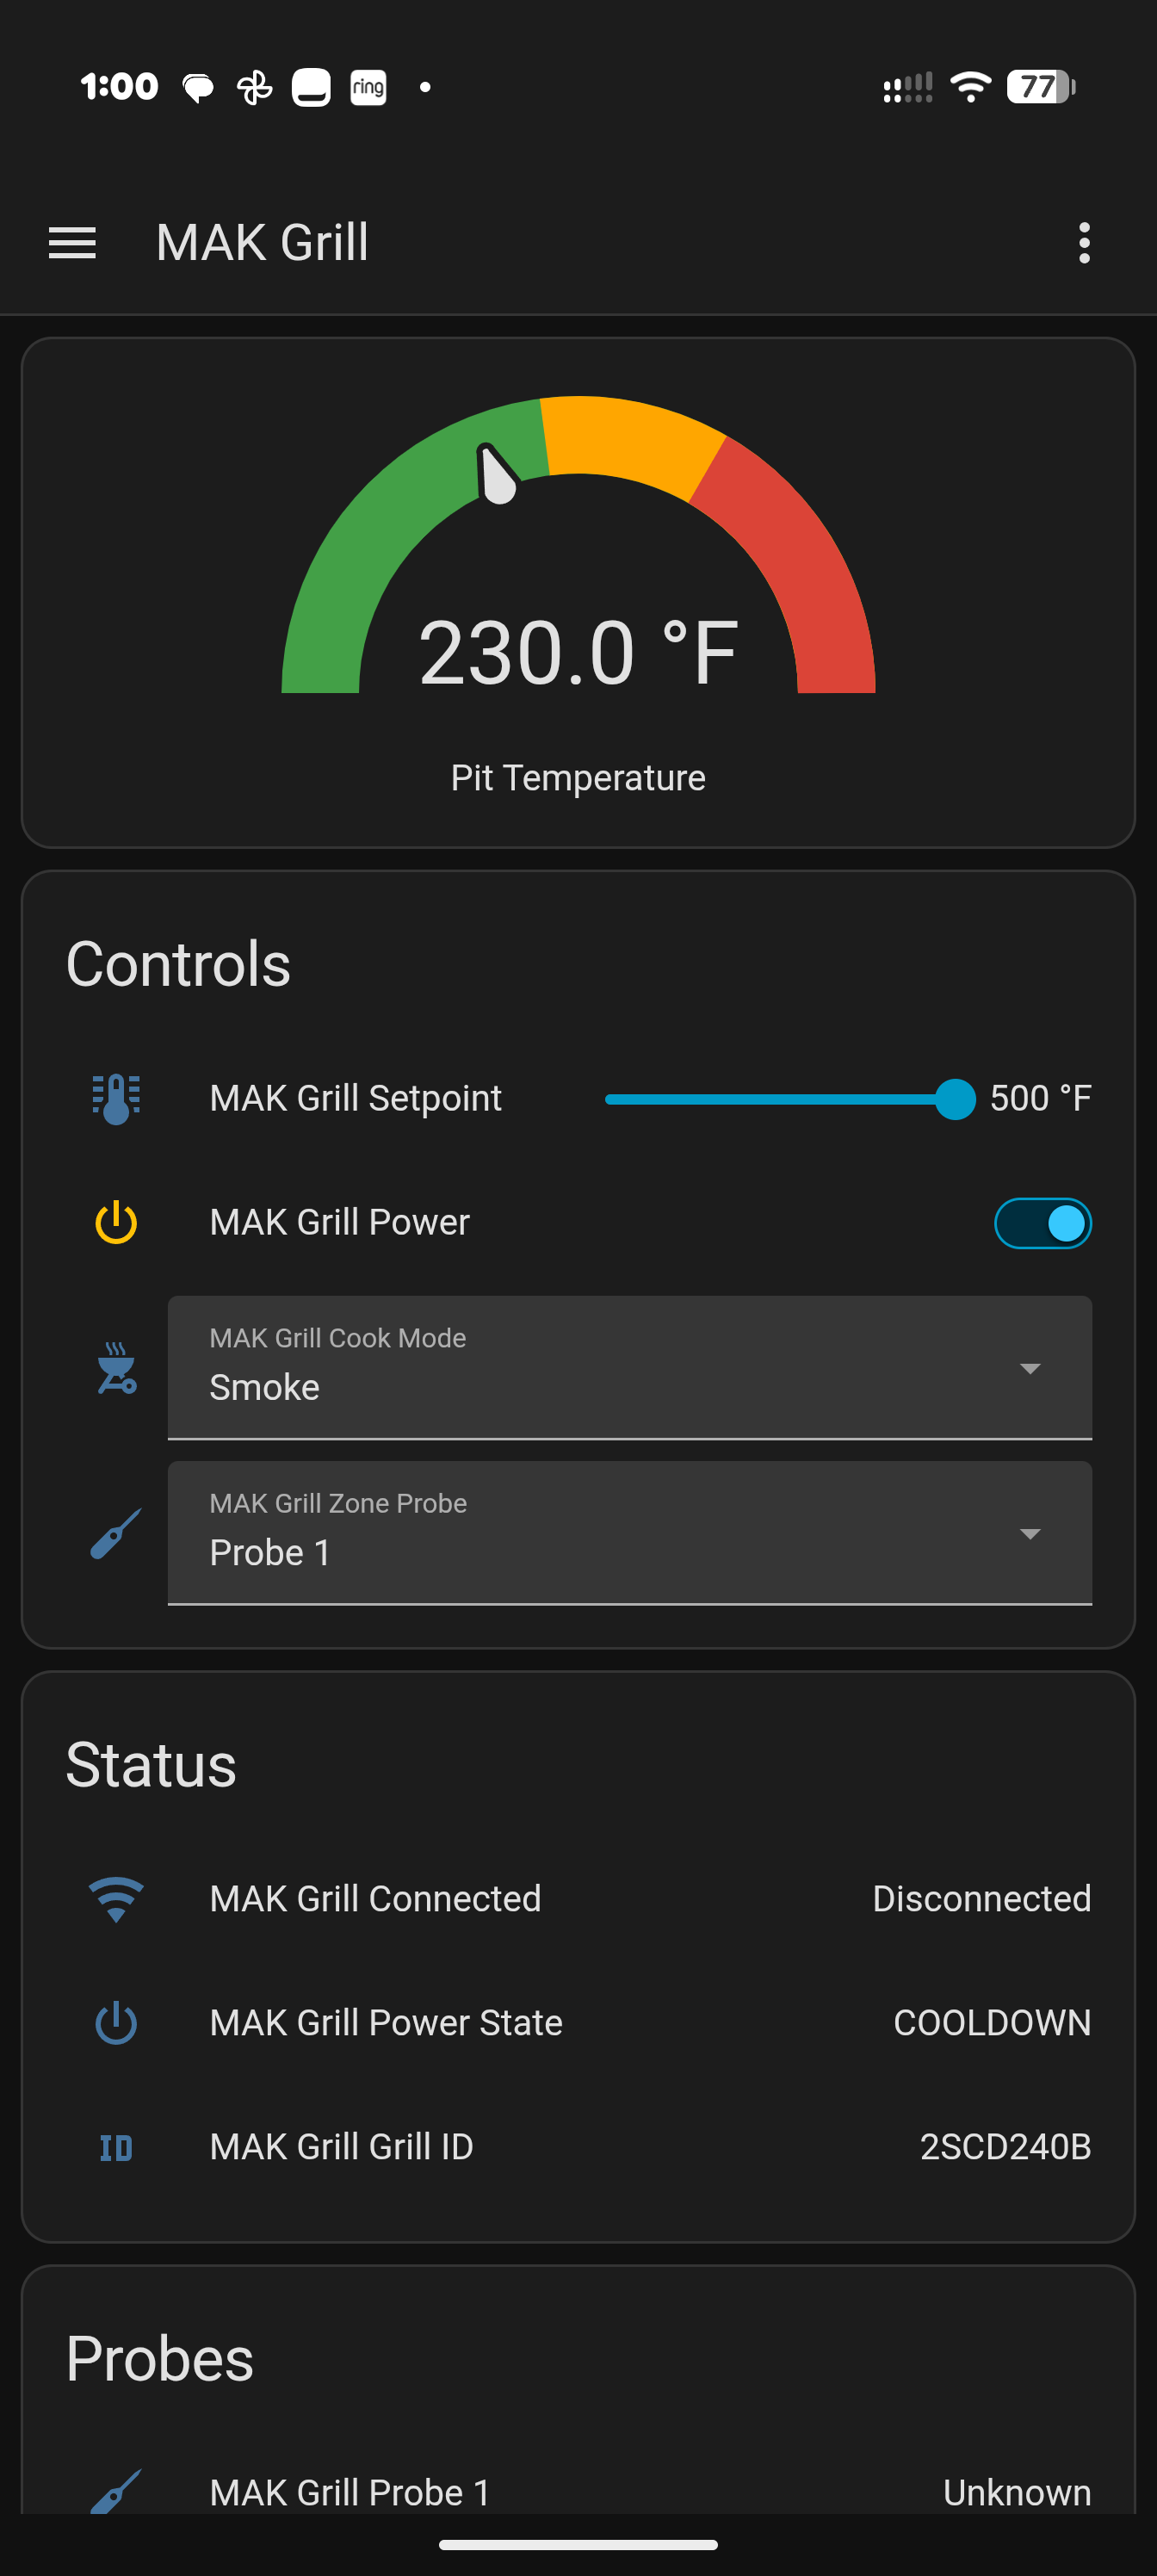
The centerpiece — a gauge card showing pit temperature with color zones.
Since v1.3.1 the temperature sensors read unknown while the grill is off, and a plain gauge shows a "non-numeric" warning when that happens. Wrap it in a conditional card so it only appears while there's a reading, and add a small status card that takes its place when the grill is off:
type: conditional
conditions:
  - condition: state
    entity: sensor.mak_grill_temperature
    state_not: [unknown, unavailable]
card:
  type: gauge
  entity: sensor.mak_grill_temperature
  name: Pit Temperature
  unit: °F
  needle: true
  min: 0
  max: 600
  segments:
    - from: 0
      color: "#43a047"
    - from: 200
      color: "#ffa600"
    - from: 350
      color: "#db4437"
    - from: 450
color: "#9c27b0"type: conditional
conditions:
- condition: state
entity: sensor.mak_grill_temperature
state: [unknown, unavailable]
card:
type: entities
title: Pit Temperature
entities:
- entity: binary_sensor.mak_grill_connected
name: Connected
- entity: sensor.mak_grill_power_state
name: Power StateAn entities card with all the writable controls in one place.
type: entities
title: Controls
entities:
  - entity: number.mak_grill_setpoint
    name: Setpoint
  - entity: switch.mak_grill_power
    name: Power
  - entity: select.mak_grill_cook_mode
    name: Cook Mode
  - entity: select.mak_grill_zone_probe
name: Zone ProbeShows all meat probe temperatures.
type: entities
title: Probes
entities:
  - entity: sensor.mak_grill_probe_1
    name: Probe 1
  - entity: sensor.mak_grill_probe_2
    name: Probe 2
  - entity: sensor.mak_grill_probe_3
    name: Probe 3
  - entity: number.mak_grill_setpoint
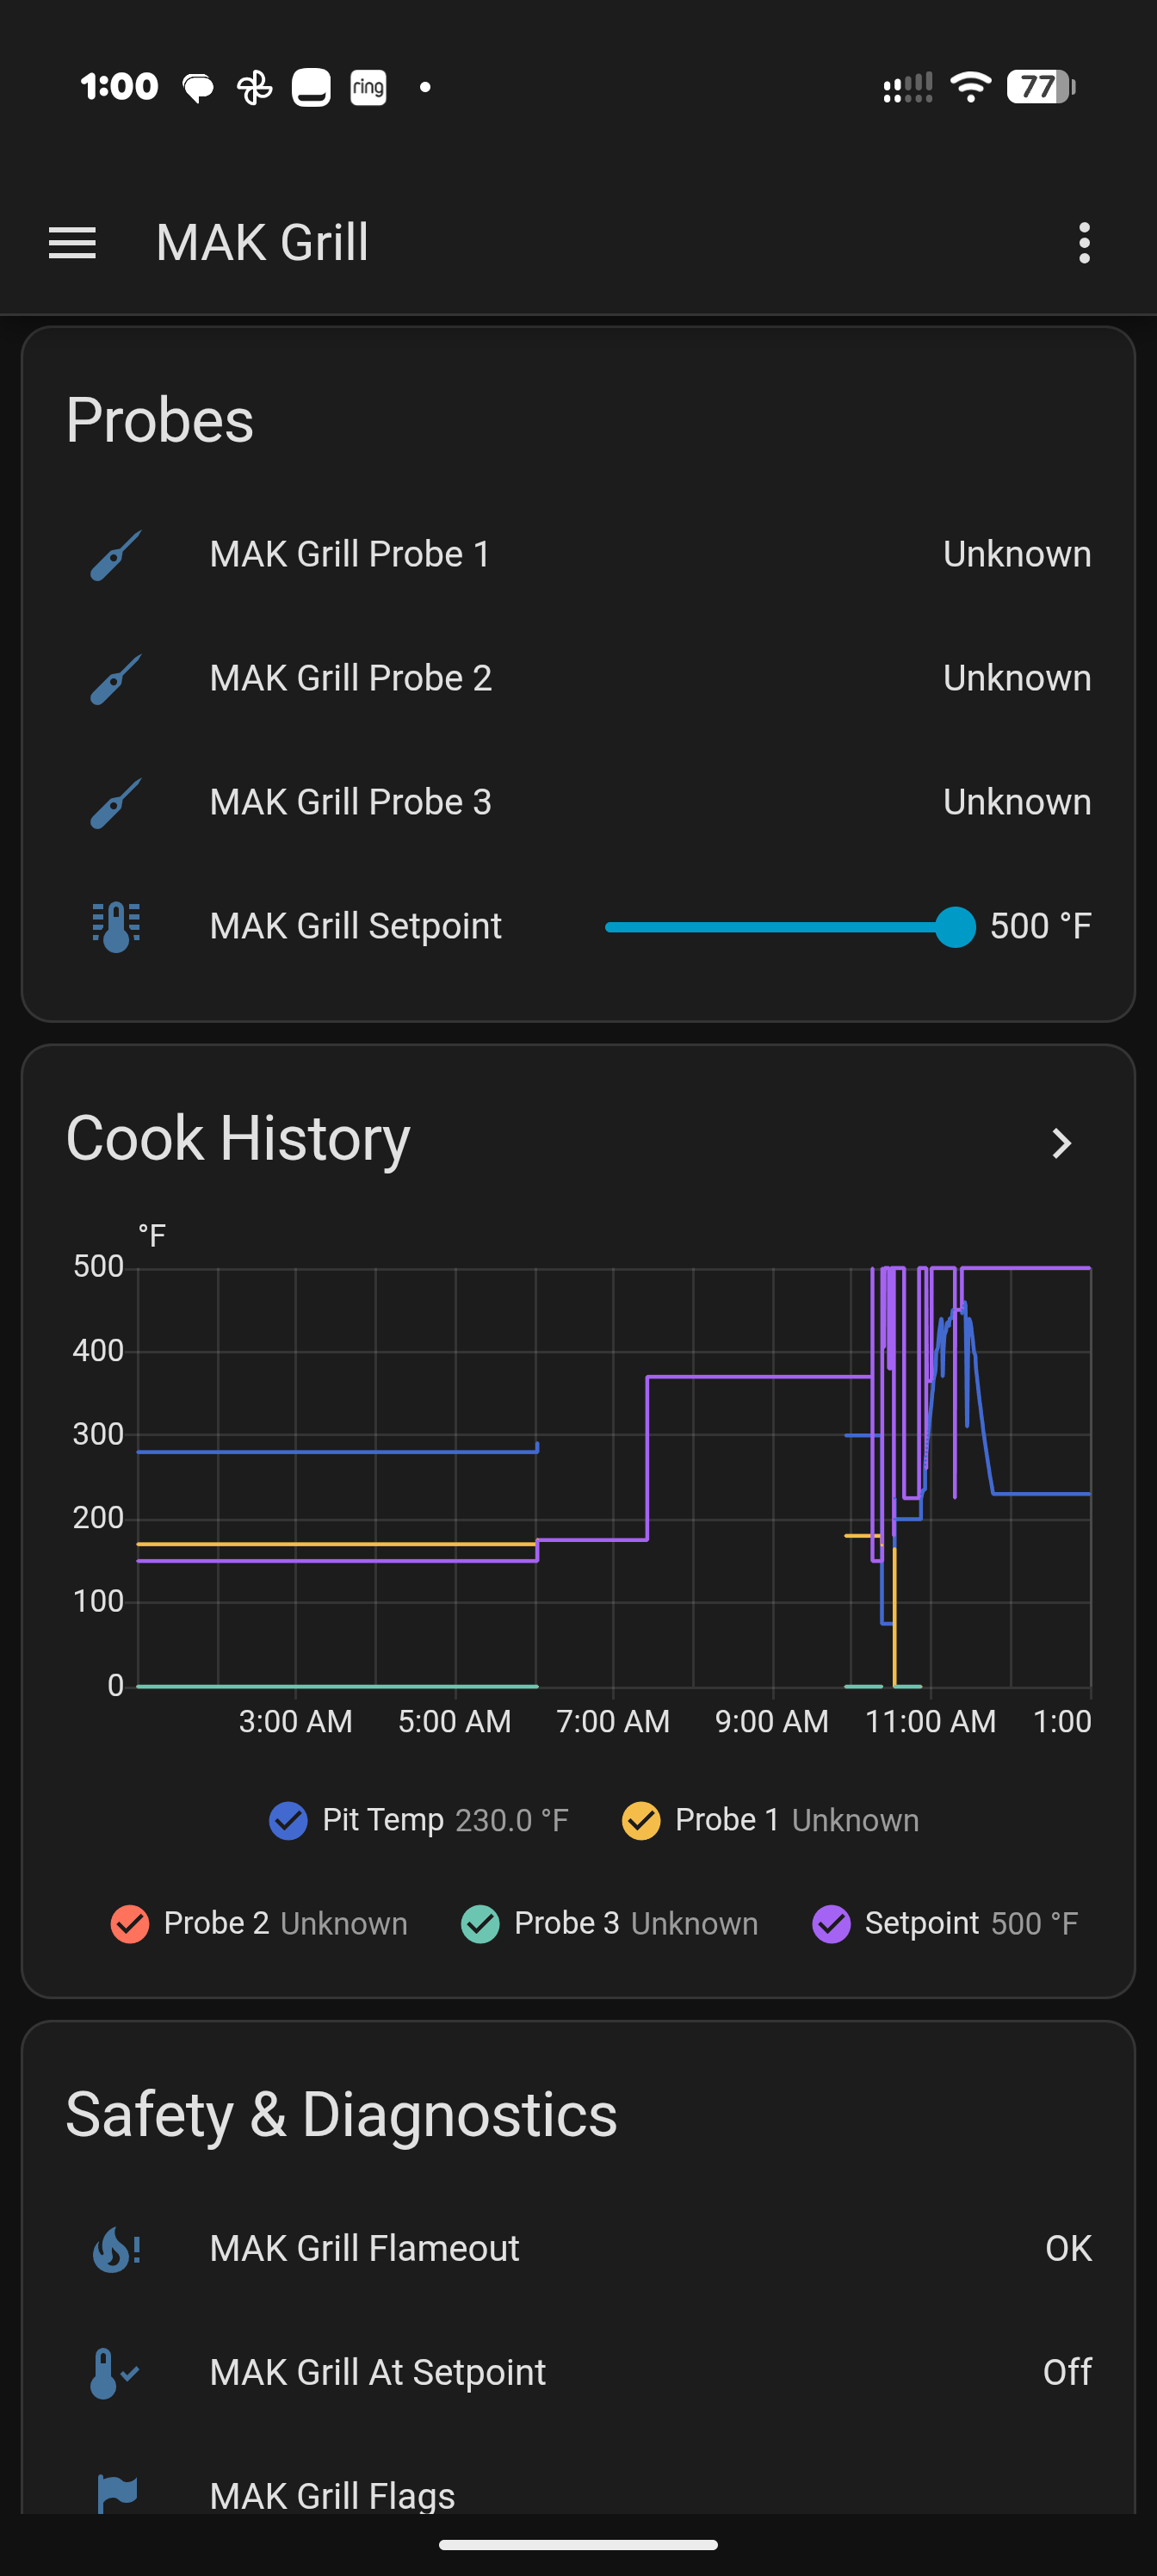
name: SetpointA history graph showing temperature trends over time. Great for monitoring long cooks.
type: history-graph
title: Cook History
hours_to_show: 12
entities:
  - entity: sensor.mak_grill_temperature
    name: Pit Temp
  - entity: sensor.mak_grill_probe_1
    name: Probe 1
  - entity: sensor.mak_grill_probe_2
    name: Probe 2
  - entity: sensor.mak_grill_probe_3
    name: Probe 3
  - entity: number.mak_grill_setpoint
name: SetpointConnection status and grill info.
type: entities
title: Status
entities:
  - entity: binary_sensor.mak_grill_connected
    name: Connected
  - entity: sensor.mak_grill_power_state
    name: Power State
  - entity: sensor.mak_grill_grill_id
name: Grill IDFlameout alert, at-setpoint indicator, and diagnostic sensors.
type: entities
title: Safety & Diagnostics
entities:
  - entity: binary_sensor.mak_grill_flameout
    name: Flameout
  - entity: binary_sensor.mak_grill_at_setpoint
    name: At Setpoint
  - entity: sensor.mak_grill_flags
    name: Flags
  - entity: sensor.mak_grill_last_seen
    name: Last Seen
  - entity: sensor.mak_grill_post_count
name: Post CountIf you prefer to paste a complete dashboard config, switch to the raw YAML editor (three dots menu → Raw configuration editor) and paste this:
title: MAK Grill
views:
  - title: MAK Grill
    cards:
      - type: conditional
        conditions:
          - condition: state
            entity: sensor.mak_grill_temperature
            state_not: [unknown, unavailable]
        card:
          type: gauge
          entity: sensor.mak_grill_temperature
          name: Pit Temperature
          unit: °F
          needle: true
          min: 0
          max: 600
          segments:
            - from: 0
              color: "#43a047"
            - from: 200
              color: "#ffa600"
            - from: 350
              color: "#db4437"
            - from: 450
              color: "#9c27b0"
      - type: conditional
        conditions:
          - condition: state
            entity: sensor.mak_grill_temperature
            state: [unknown, unavailable]
        card:
          type: entities
          title: Pit Temperature
          entities:
            - entity: binary_sensor.mak_grill_connected
              name: Connected
            - entity: sensor.mak_grill_power_state
              name: Power State
      - type: entities
        title: Controls
        entities:
          - entity: number.mak_grill_setpoint
            name: Setpoint
          - entity: switch.mak_grill_power
            name: Power
          - entity: select.mak_grill_cook_mode
            name: Cook Mode
          - entity: select.mak_grill_zone_probe
            name: Zone Probe
      - type: entities
        title: Probes
        entities:
          - entity: sensor.mak_grill_probe_1
            name: Probe 1
          - entity: sensor.mak_grill_probe_2
            name: Probe 2
          - entity: sensor.mak_grill_probe_3
            name: Probe 3
          - entity: number.mak_grill_setpoint
            name: Setpoint
      - type: history-graph
        title: Cook History
        hours_to_show: 12
        entities:
          - entity: sensor.mak_grill_temperature
            name: Pit Temp
          - entity: sensor.mak_grill_probe_1
            name: Probe 1
          - entity: sensor.mak_grill_probe_2
            name: Probe 2
          - entity: sensor.mak_grill_probe_3
            name: Probe 3
          - entity: number.mak_grill_setpoint
            name: Setpoint
      - type: entities
        title: Status
        entities:
          - entity: binary_sensor.mak_grill_connected
            name: Connected
          - entity: sensor.mak_grill_power_state
            name: Power State
          - entity: sensor.mak_grill_grill_id
            name: Grill ID
      - type: entities
        title: Safety & Diagnostics
        entities:
          - entity: binary_sensor.mak_grill_flameout
            name: Flameout
          - entity: binary_sensor.mak_grill_at_setpoint
            name: At Setpoint
          - entity: sensor.mak_grill_flags
            name: Flags
          - entity: sensor.mak_grill_last_seen
            name: Last Seen
          - entity: sensor.mak_grill_post_count
name: Post Count- Mobile friendly — The default masonry layout works well on phones. Each card stacks vertically.
-
Adjust hours_to_show — For a long brisket cook, try
hours_to_show: 18or24. For quick grilling,4or6is plenty. - Entity names — The entity IDs above assume your integration is named "MAK Grill" during setup. If you used a different name, your entity IDs will differ (check Developer Tools → States to find yours).
- Grill Buddy — For "alert me when probe 1 hits 203°F" functionality, check out Grill Buddy which works on top of any HA temperature sensor, including the ones this integration provides.
- meater-in-local-haos — A local-first cooking assistant for HA with guided cooks, AI recipe building, and cook history. Works with any HA temperature sensor — just point it at your MAK Grill probe entities. See R00S/meater-in-local-haos.
Here's what the finished dashboard looks like: