
Visualize the timeline of your dbt runs.
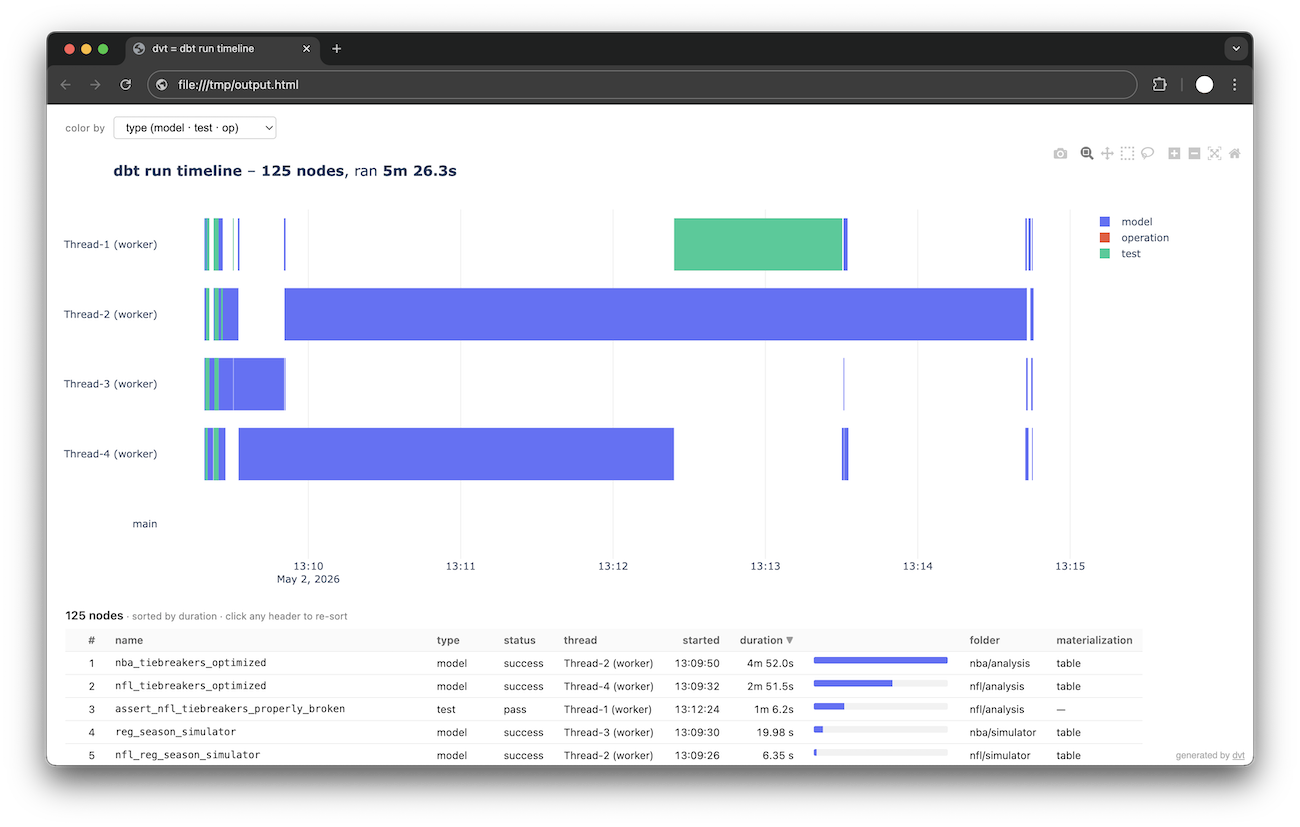
- just run
dvtafterdbt run/test/build - generates an HTML page in
target/directory with the timeline of your run and opens it immediately - helps spot run bottlenecks, long-running models, and where to spend most of your time optimising things
- colorize executions by type (models/tests/ops), path (staging/abc, marts/), prefix (stg_, int_, mart_)
pip install dbt-dvtFrom inside a dbt project:
dbt run     # produces target/run_results.json
dvt # writes & opens target/run_results_timeline.html-i, --input PATH path to run_results.json (default: target/run_results.json)
-o, --output PATH where to write the HTML (default: target/run_results_timeline.html)
-m, --manifest path to dbt's manifest.json (optional; unlocks folder/materialization color modes)
--no-open don't open the chart in a browser
--static produce a single self-contained HTML with plotly.js embedded
--version