-
Notifications
You must be signed in to change notification settings - Fork 709
add dashboard diagnostics docs #2690
New issue
Have a question about this project? Sign up for a free GitHub account to open an issue and contact its maintainers and the community.
By clicking “Sign up for GitHub”, you agree to our terms of service and privacy statement. We’ll occasionally send you account related emails.
Already on GitHub? Sign in to your account
Merged
Merged
Changes from all commits
Commits
Show all changes
7 commits
Select commit
Hold shift + click to select a range
8ed103d
add dashboard diagnostics docs
TomShawn efefd52
Update dashboard/dashboard-diagnostics-access.md
TomShawn 7bef9b7
add TiDB Dashboard Diagnostic Report
TomShawn b0dc344
Merge branch 'master' into dashboard-diagnostics
TomShawn dafa7e8
Apply suggestions from code review
TomShawn 9e1a36a
Apply suggestions from code review
TomShawn e0f7a79
Merge branch 'master' into dashboard-diagnostics
sre-bot File filter
Filter by extension
Conversations
Failed to load comments.
Loading
Jump to
Jump to file
Failed to load files.
Loading
Diff view
Diff view
There are no files selected for viewing
This file contains hidden or bidirectional Unicode text that may be interpreted or compiled differently than what appears below. To review, open the file in an editor that reveals hidden Unicode characters.
Learn more about bidirectional Unicode characters
| Original file line number | Diff line number | Diff line change |
|---|---|---|
| @@ -0,0 +1,62 @@ | ||
| --- | ||
| title: TiDB Dashboard Cluster Diagnostic Page | ||
| summary: Learn how to use the cluster diagnostic page. | ||
| category: how-to | ||
| --- | ||
|
|
||
| # TiDB Dashboard Cluster Diagnostics Page | ||
|
|
||
| The cluster diagnostics feature in TiDB Dashboard diagnoses the problems that might exist in a cluster within a specified time range, and summarizes the diagnostic results and the cluster-related load monitoring information into a diagnostic report. This diagnostic report is in the form of a web page. You can browse the page offline and circulate this page link after saving the page from a browser. | ||
|
|
||
| > **Note:** | ||
| > | ||
| > The cluster diagnostics feature depends on Prometheus deployed in the cluster. For details about how to deploy this monitoring component, see [TiUP](/tiup/tiup-overview.md) or [TiDB Ansible](/online-deployment-using-ansible.md) deployment document. If no monitoring component is deployed in the cluster, the generated diagnostic report will indicate a failure. | ||
|
|
||
| ## Access the page | ||
|
|
||
| You can use one of the following methods to access the cluster diagnostics page: | ||
|
|
||
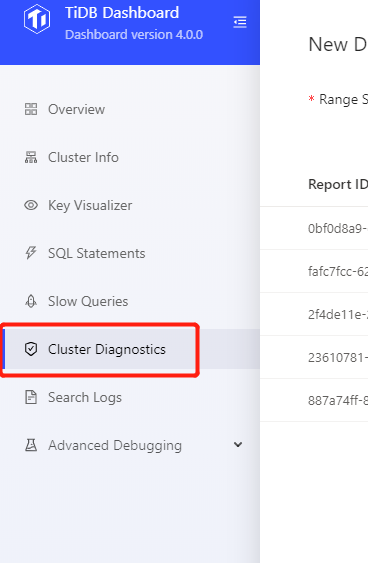
| * After logging into TiDB Dashboard, click **Cluster Diagnostics** on the left navigation menu: | ||
|
|
||
|  | ||
|
|
||
| * Visit `http://127.0.0.1:2379/dashboard/#/diagnose` in your browser. Replace `127.0.0.1:2379` with the actual PD address and port number. | ||
|
|
||
| ## Generate diagnostic report | ||
|
|
||
| To diagnose a cluster within a specified time range and check the cluster load, you can take the following steps to generate a diagnostic report: | ||
|
|
||
| 1. Set the **Range Start Time**, such as `2020-05-21 14:40:00`. | ||
| 2. Set the **Range Duration**, such as `10 min`. | ||
| 3. Click **Start**. | ||
|
|
||
|  | ||
|
|
||
| > **Note:** | ||
| > | ||
| > It is recommended that the **Range Duration** of the report is between 1 minute and 60 minutes. This **Range Duration** cannot exceed 60 minutes. | ||
|
|
||
| The steps above generate a diagnostic report for the time range from `2020-05-21 14:40:00` to `2020-05-21 14:50:00`. After clicking **Start**, you can see the interface below. **Progress** is the progress bar of the diagnostic report. After the report is generated, click **View Full Report**. | ||
|
|
||
|  | ||
|
|
||
| ## Generate comparison report | ||
|
|
||
| If a system exception occurs at a certain point, for example, QPS jitter or higher latency, a diagnostic report can be generated. Particularly, this report compares the system in the abnormal time range with the system in the normal time range. For example: | ||
|
|
||
| * Abnormal time range: `2020-05-21 14:40:00`-`2020-05-21 14:45:00`. Within this time range, the system is abnormal. | ||
| * Normal time range: `2020-05-21 14:30:00` - `2020-05-21 14:35:00`. Within this time range, the system is normal. | ||
|
|
||
| You can take the following steps to generate a comparison report for the two time ranges above: | ||
|
|
||
| 1. Set the **Range Start Time**, which is the start time of the range in which the system becomes abnormal, such as `2020-05-21 14:40:00`. | ||
| 2. Set the **Range Duration**. Generally, this duration is the duration of system anomalies, such as 5 minutes. | ||
| 3. Enable **Compare by baseline**. | ||
| 4. Set the **Baseline Range Start Time**, which is the start time of the range (to be compared with) in which the system is normal, such as `2020-05-21 14:30:00`. | ||
| 5. Click **Start**. | ||
|
|
||
|  | ||
|
|
||
| Then wait for the report to be generated and click **View Full Report**. | ||
|
|
||
| In addition, the historical diagnostic report is displayed in the list on the main page of the diagnostic report. You can click to view these historical reports directly. | ||
Oops, something went wrong.
Add this suggestion to a batch that can be applied as a single commit.
This suggestion is invalid because no changes were made to the code.
Suggestions cannot be applied while the pull request is closed.
Suggestions cannot be applied while viewing a subset of changes.
Only one suggestion per line can be applied in a batch.
Add this suggestion to a batch that can be applied as a single commit.
Applying suggestions on deleted lines is not supported.
You must change the existing code in this line in order to create a valid suggestion.
Outdated suggestions cannot be applied.
This suggestion has been applied or marked resolved.
Suggestions cannot be applied from pending reviews.
Suggestions cannot be applied on multi-line comments.
Suggestions cannot be applied while the pull request is queued to merge.
Suggestion cannot be applied right now. Please check back later.
There was a problem hiding this comment.
Choose a reason for hiding this comment
The reason will be displayed to describe this comment to others. Learn more.
There was a problem hiding this comment.
Choose a reason for hiding this comment
The reason will be displayed to describe this comment to others. Learn more.
But in the actual UI, we can see Cluster Diagnostics.
There was a problem hiding this comment.
Choose a reason for hiding this comment
The reason will be displayed to describe this comment to others. Learn more.
Diagnostics is correct @toutdesuite