from urllib.request import urlopen
import json
import requests
import os
import pandas as pd
import plotly.express as px

with urlopen('https://raw.githubusercontent.com/plotly/datasets/master/geojson-counties-fips.json') as response:
    counties = json.load(response)

tsfile = 'time_series_covid19_confirmed_US.csv'
tsurl = 'https://raw.githubusercontent.com/CSSEGISandData/COVID-19/master/csse_covid_19_data/csse_covid_19_time_series/' + tsfile

if not os.path.exists(tsfile):
    req = requests.get(tsurl)
    with open(tsfile, 'wb') as f:
        f.write(req.content)
ts = pd.read_csv(tsfile)

ts.dropna(inplace=True)
ts = ts[ts['FIPS'] < 80000].copy(deep=True)

ts_short = ts[['FIPS', '5/9/20', '5/10/20']].copy(deep=True)
ts_short['delta'] = ts_short['5/10/20'] - ts_short['5/9/20']
ts_short = ts_short[ts_short['delta'] >= 0].copy(deep=True)
dmin = ts_short['5/10/20'].min()
dmax = ts_short['5/10/20'].max()

fig = px.choropleth(ts_short, geojson=counties, locations='FIPS', color='5/10/20',
                           color_continuous_scale="Viridis",
                           range_color=(dmin, dmax),
                           scope="usa"
                          )

fig.update_layout(margin={"r":0,"t":0,"l":0,"b":0})

fig.show()
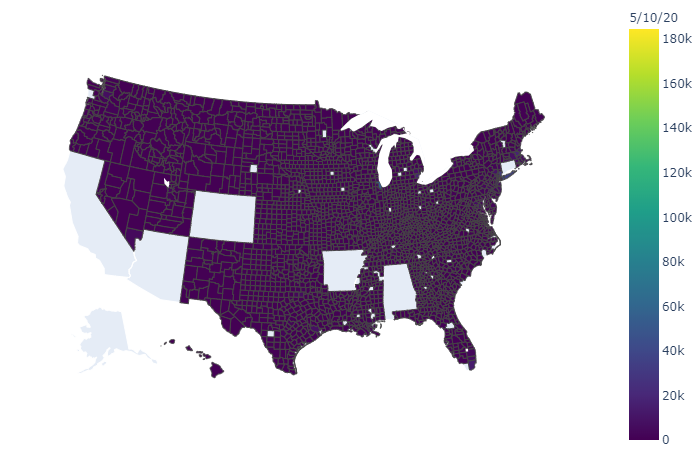
This is rendered with holes:
But the same data with create_choropleth() works fine:
import plotly.figure_factory as pff
fig2 = pff.create_choropleth(fips=ts_short['FIPS'], values=ts_short['5/10/20'])
fig2.show()
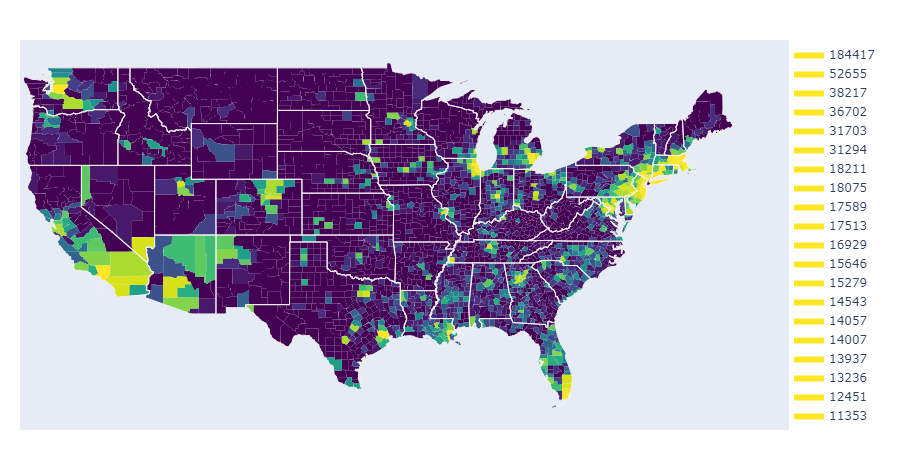
I would prefer to use px.choropleth() because it seems easier to customize, but this bug completely breaks it.
Plotly 4.6.0
Python 3.7.7
Jupyter notebook
Anaconda
Windows
This is rendered with holes:
But the same data with create_choropleth() works fine:
I would prefer to use px.choropleth() because it seems easier to customize, but this bug completely breaks it.
Plotly 4.6.0
Python 3.7.7
Jupyter notebook
Anaconda
Windows