Features
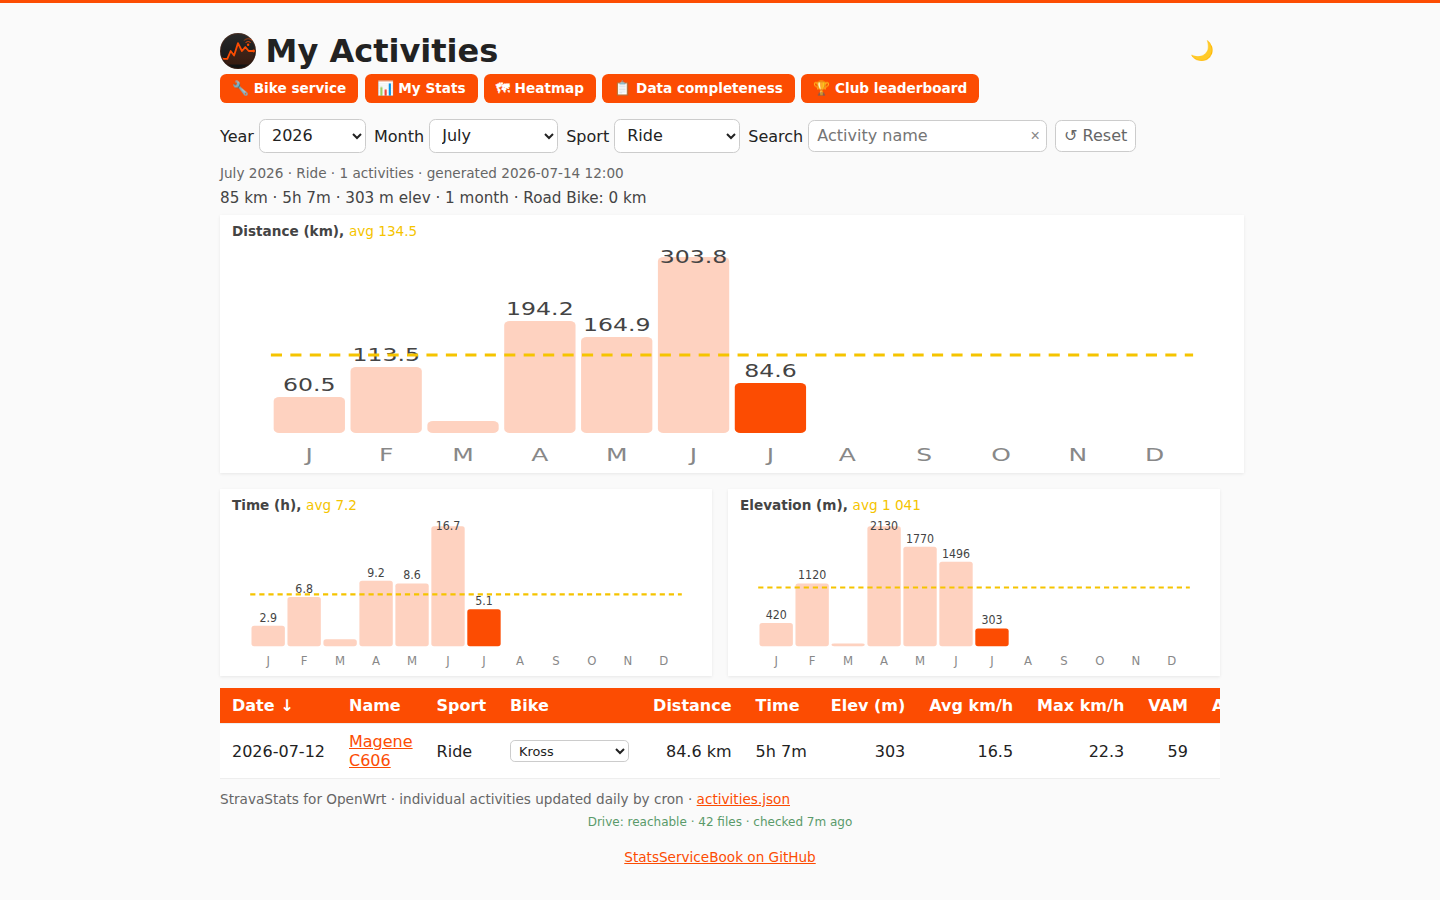
The /athlete/activities endpoint returns full activity objects with real Strava IDs and real start_date_local dates — no approximation. Activities are deduped by Strava ID.
- Sortable table — distance, time, stopped time, elevation, avg/max speed, VAM (vertical ascent rate in m/h), avg HR, avg power, work in kJ. Power / HR / VAM columns show "—" when the activity doesn't carry that data.
-
Year / month / sport-type filters — all client-side; the page fetches a single
activities.jsonand filters in the browser. - Period "bests" strip — longest ride, most climbing, fastest avg speed, best VAM, most work — recomputed for the current filter selection. The "Longest climb" tile shows the best single continuous climb computed from GPX files; it displays "—" when no GPX data is available for the filtered set.
- Monthly bar charts — distance, time, and elevation per month for the selected year.
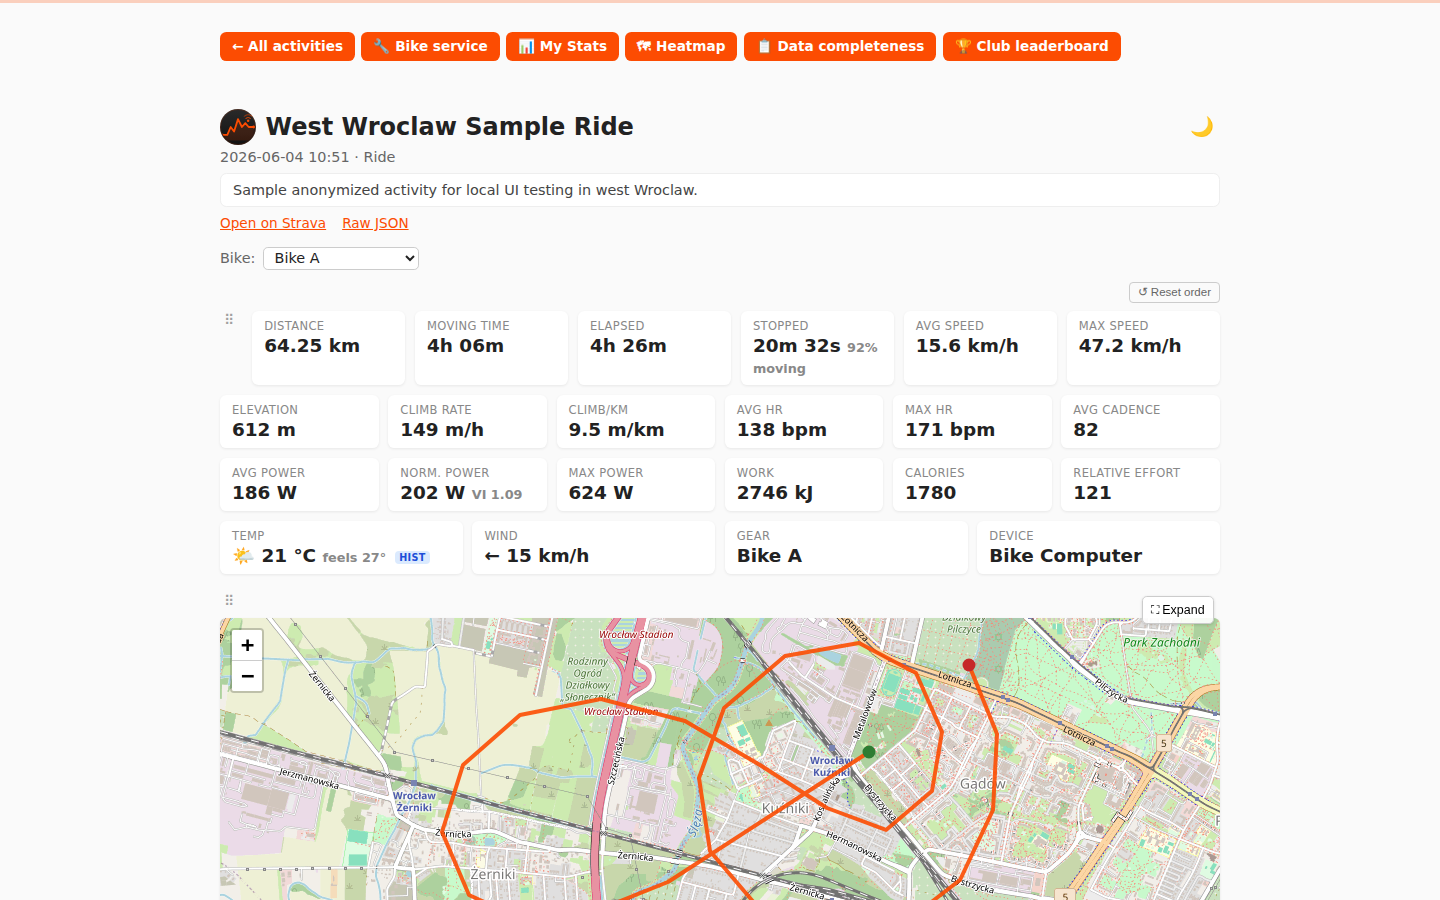
Once an activity has its cached detail file (GET /activities/{id}), its name in the dashboard links to activity.html?id=<id>.
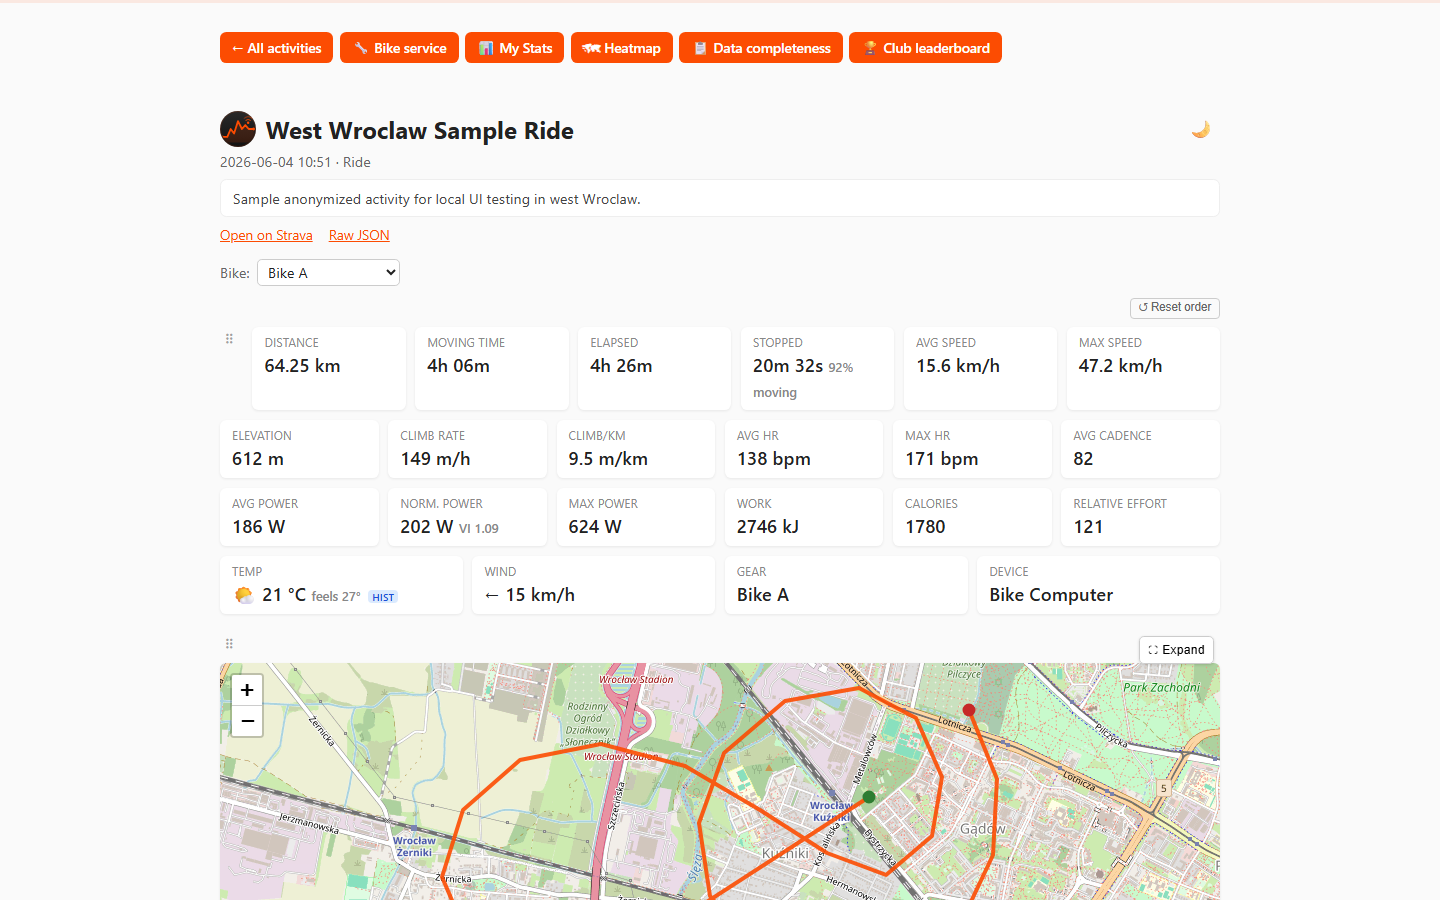
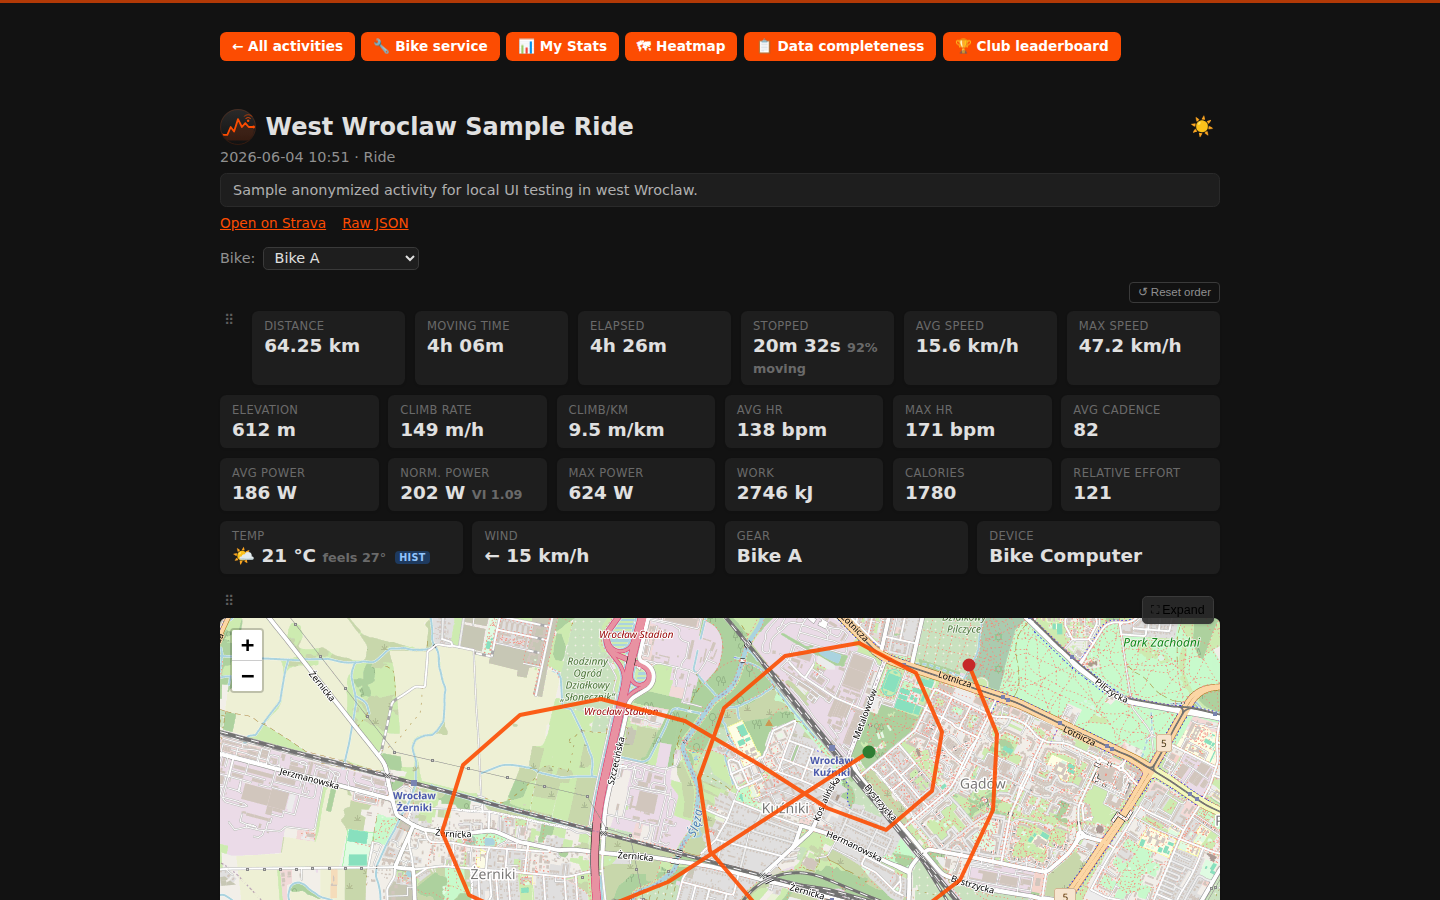
Stat cards: distance, time, stopped time, pace/speed, elevation gain, VAM, climb per km, avg/max HR, avg/max cadence, avg power, normalized power, variability index, work (kJ), calories, relative effort, temperature + weather icon + feels-like + source badge (hist / fcst / device), wind speed + direction arrow, precipitation, gear name.
Cycling-specific metrics (VAM, power, work) appear only when present. The temperature badge distinguishes device-sensor readings from Open-Meteo historical/forecast values.
Walk and Hike activities show an extra Steps card — estimated total steps computed as avg_cadence × 2 × moving_time, with a tooltip explaining the formula.
Charts (each shown only when the activity carries that data):
- Interactive route map — Leaflet + OpenStreetMap tiles; needs internet in the viewing browser
- Per-km splits bar chart
- Elevation profile chart
- Heart rate chart
- Cadence chart
Longest-climb detection — when a GPX file is available the route map highlights the single longest continuous climb (blue segment, green start marker, red end marker) and a stat card shows the gain and distance. The algorithm is sport-aware: a climb must exceed a minimum elevation gain, minimum horizontal distance (100 m), and a minimum average grade before it qualifies. A drop of more than 30 m from the highest point reached resets the climb window.
Default thresholds (all configurable in /etc/strava-my-activities.conf):
| Sport | Min gain | Min grade |
|---|---|---|
| Ride | 25 m | 3 % |
| Run | 5 m | 2 % |
| Hike | 10 m | 2 % |
| Walk | 3 m | 1 % |
| Other | 10 m | 2 % |
Config keys: STRAVA_MY_CLIMB_MIN_GAIN_RIDE, _RUN, _HIKE, _WALK, _OTHER (metres); STRAVA_MY_CLIMB_MIN_DISTANCE (metres, default 100); STRAVA_MY_CLIMB_MIN_GRADE_RIDE, _RUN, _HIKE, _WALK, _OTHER (percent); STRAVA_MY_CLIMB_DESCENT_RESET (metres, default 30).
Links: "Raw JSON" and "Open on Strava" are always shown.
For each activity, temperature (actual + feels-like), wind speed + direction, WMO weather code (rendered as an emoji), and precipitation are fetched from Open-Meteo using the activity's date and GPS start location.
- The ERA5 archive API is tried first (covers dates up to ~5 days ago); the forecast API is the fallback for very recent activities.
- Device-sensor temperature from Strava is preserved as-is with a "device" badge.
- Both Strava and HealthSync / Magene activities receive weather fields.
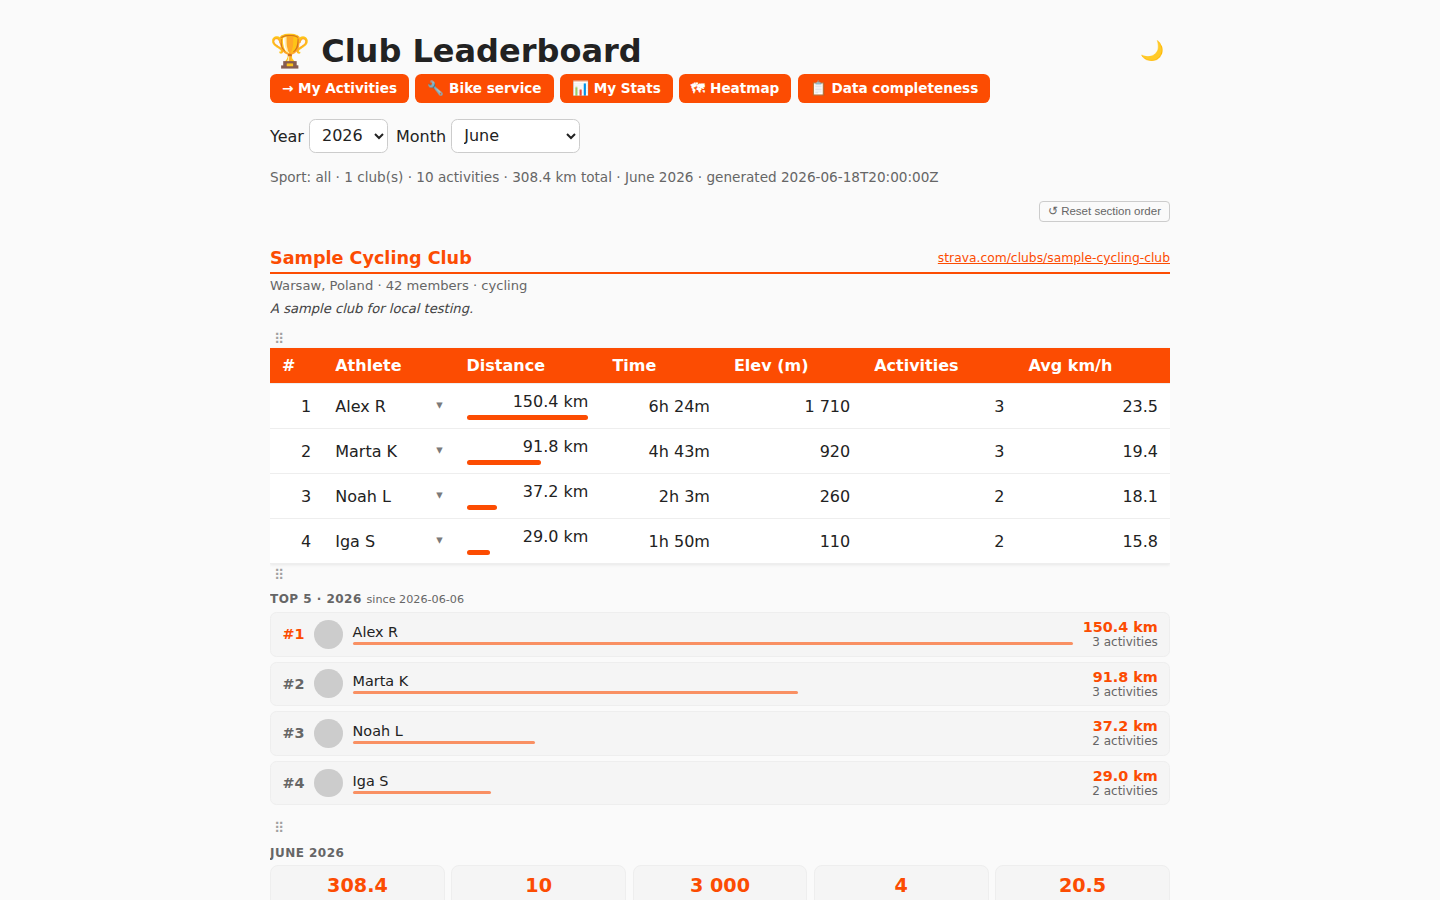
Strava's /clubs/{id}/activities feed returns no dates and no activity IDs — it's just recent activity. The script works around this by accumulating a persistent NDJSON store and stamping each newly seen activity with today's date as "first seen". In scrape mode, real activity dates are available directly.
- Month / year filter — defaults to the current month; filter back through full accumulated history.
-
Multiple clubs — set
STRAVA_CLUB_IDS="123456,789012"(comma-separated); each club gets its own store and per-club leaderboard JSON; the dashboard lets you switch between them. - Ranking — grouped by athlete, summed distance / time / elevation, ranked by total distance, avg speed in km/h.
- Scrape mode — uses the same internal feed endpoint Strava's web app uses; gives real activity dates and IDs. Required after the Club Activities API was deprecated in September 2026.
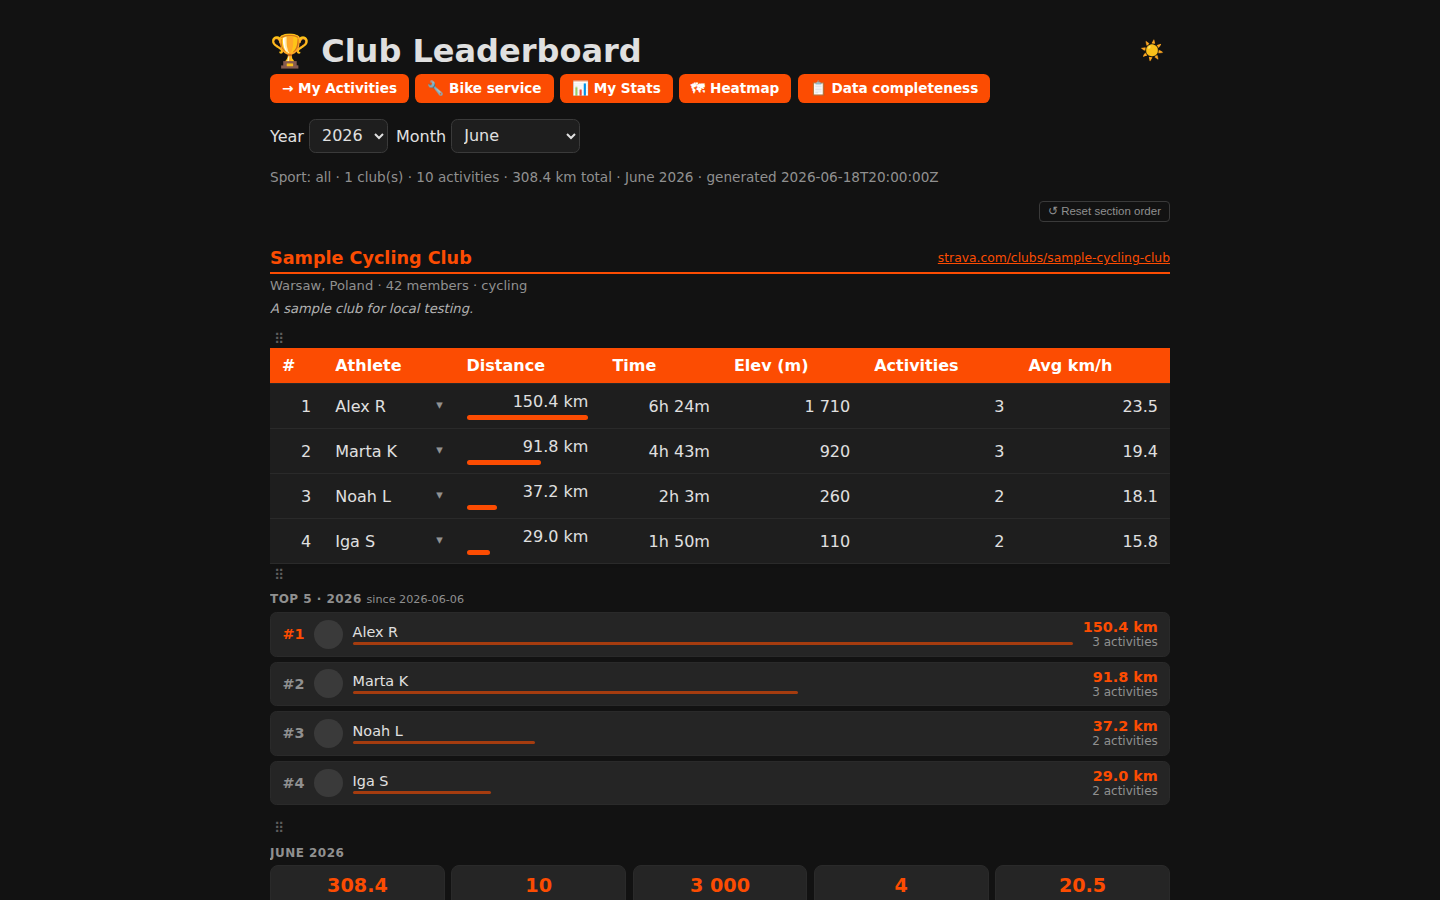
Each club block contains up to six sections (all reorderable — see Section reordering):
| Section | When shown | Content |
|---|---|---|
| Leaderboard table | always | Ranked athlete list for the selected period |
| Top 5 year | year has data | Top 5 athletes by distance for the full selected year, with a proportional bar |
| Period tiles | selected period has data | km / activities / elevation / athletes / avg km/h for the month+year filter |
| Highlights | period has data | Single-activity bests: fastest (km/h), longest (km), most elevation (m) |
| This year | current-year data exists | Running totals for the current calendar year |
| All-time | any data exists | Club all-time totals (km, activities, elevation, athletes) |
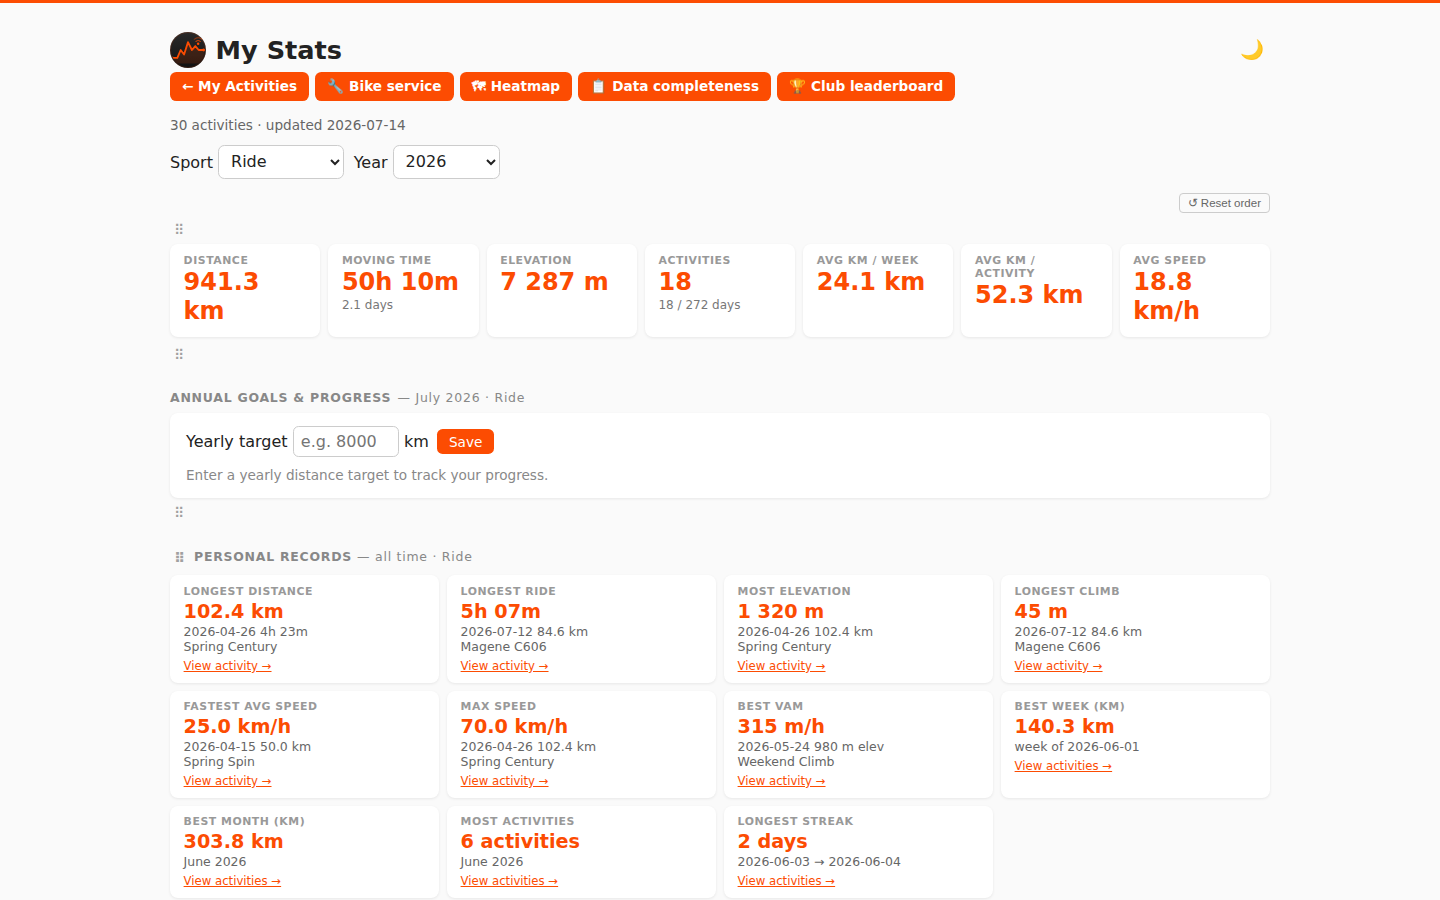
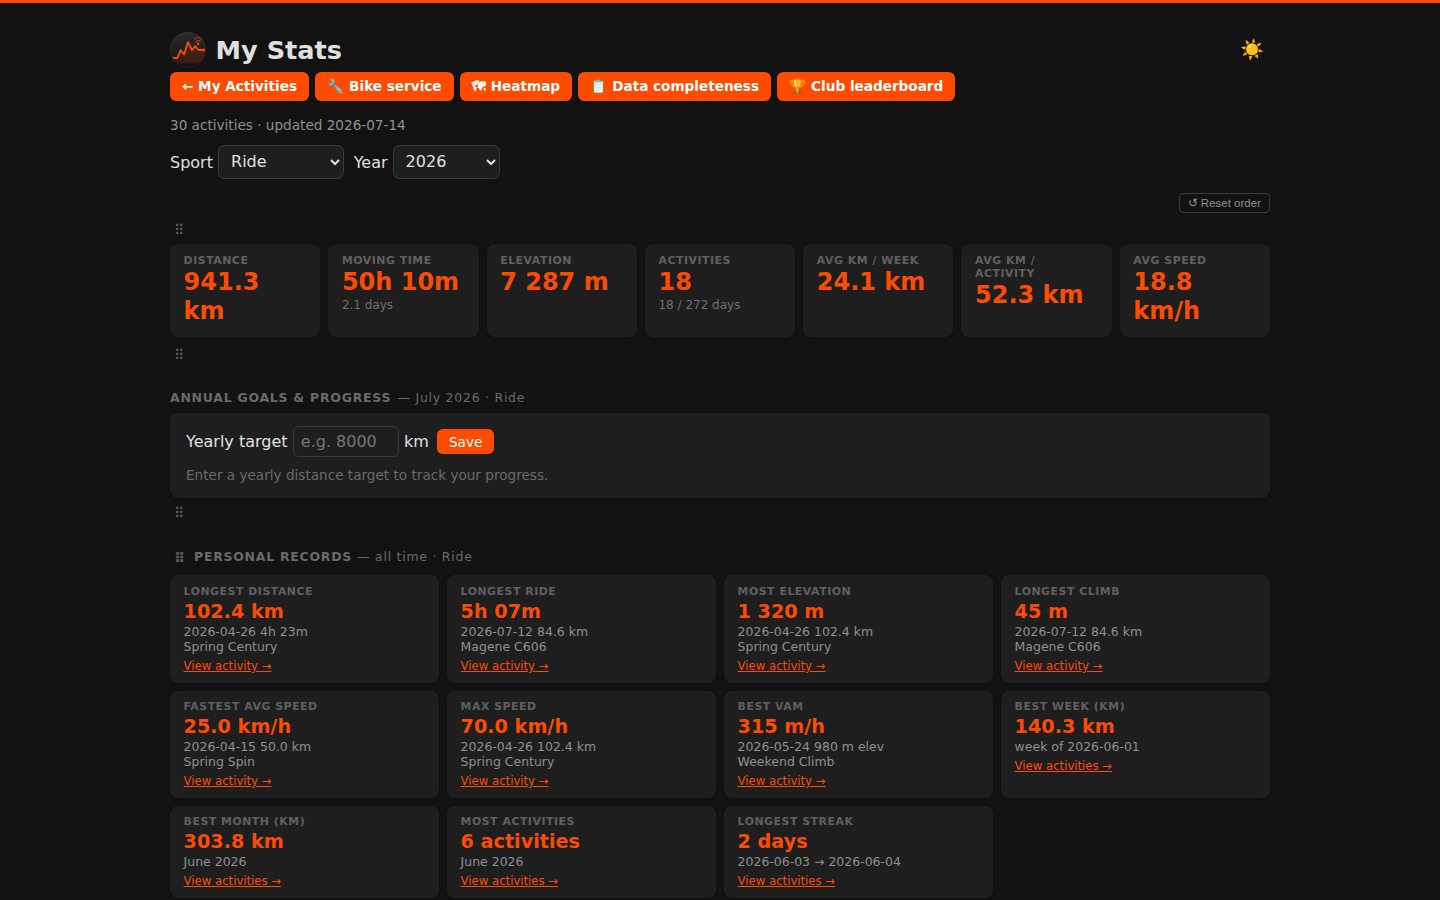
A separate page at /strava/me/stats.html (linked from the My Activities header).
- KPI cards — total distance, time, elevation, activity count, avg speed for the selected sport + year filter.
-
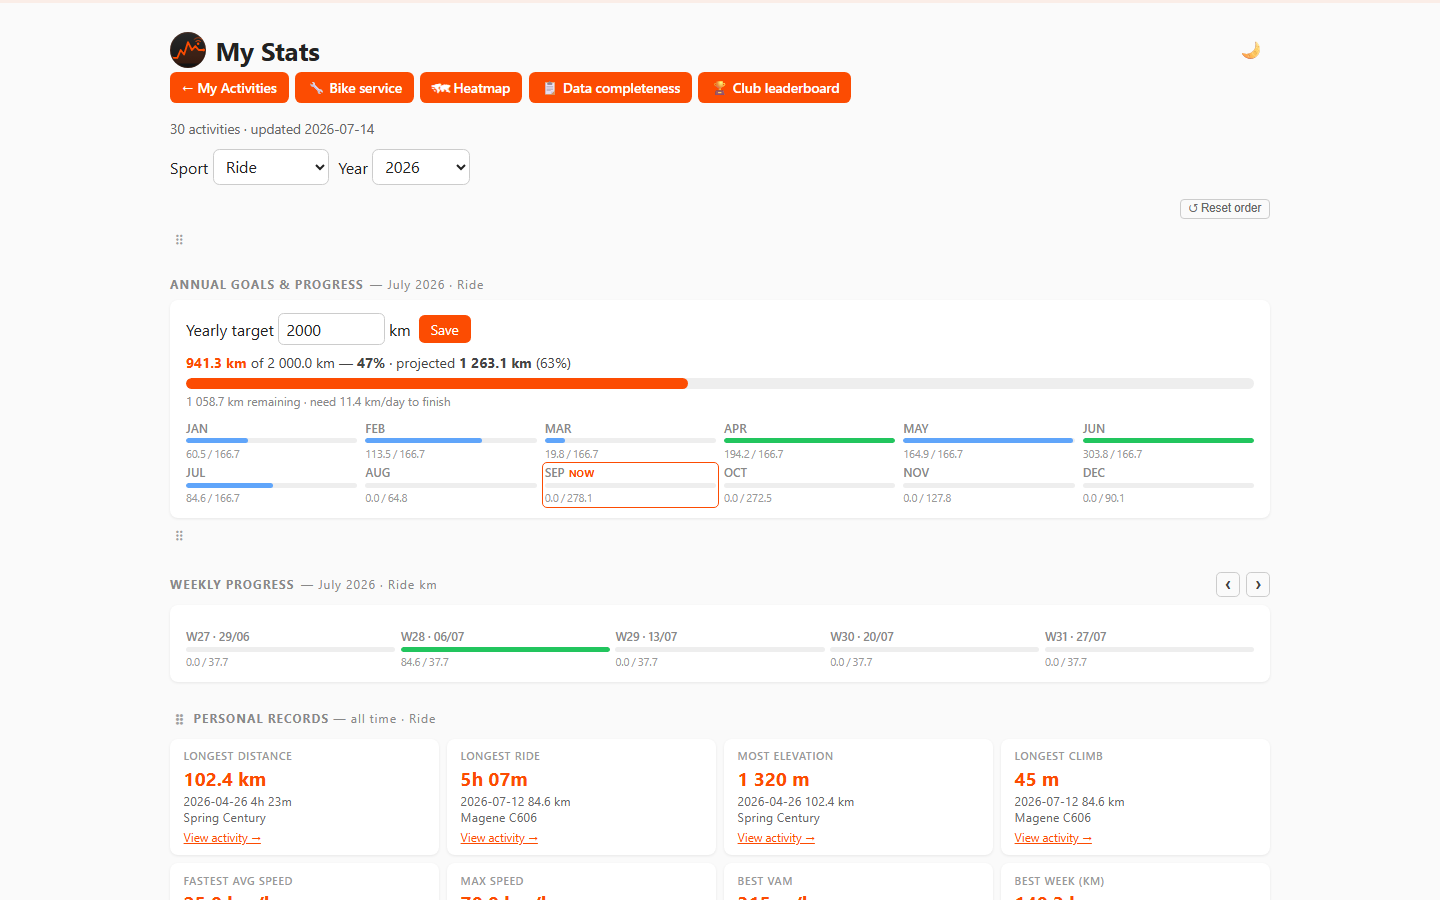
Annual Goals & Progress — visible when a specific year and the Ride sport are selected. Set a yearly ride distance target per year; the section shows a progress bar (% done), projected year-end km based on pace so far, and a 12-month mini-bar breakdown. Past months are colour-coded green (target hit) or blue (partial); the current month is orange; future months are grey. Monthly targets are distributed proportionally based on the previous year's per-month distances. Goals are saved through a CGI (
/cgi-bin/ride-goals) toride-goals.json. -
Personal records — shown above the year overview; all-time across the selected sport + year. Records: longest ride (km), longest time, most climbing, fastest avg speed (≥ 20 km rides), max speed (top
max_speedvalue across all activities), best VAM (≥ 100 m elevation), most power (W), most energy (kJ), most steps (Walk/Hike — from cadence), best week (km), best month (km and by activity count), longest consecutive-day streak. Each record links to the activity detail page. - Top 10 leaderboard — ranked table (1–10) of your best activities for a chosen metric. A dropdown in the section heading switches between: Distance, Moving time, Elevation, Avg speed (≥ 20 km rides), Max speed, Power (W), Work (kJ), VAM, Longest climb, and Steps (Walk/Hike). Default metric is Longest climb. Respects the active sport and year filters. Each row shows date, activity name, metric value, distance, time, and a "View →" link to the activity detail page.
- Year overview table — one row per year.
- Monthly breakdown — bar chart + table. When a specific past year is selected, ‹ / › navigation buttons appear to step through months without reopening the year dropdown.
- Year-over-year km/month heatmap — all years × all months in a single grid.
- Sport breakdown — distance and time per sport type.
- Day-of-week chart — average distance per day of week.
All computed client-side from activities.json.
A diagnostic page at /strava/me/data-quality.html (linked from the My Activities navigation bar).
- Activity audit — lists activities that are missing GPS data, heart-rate data, or a cached detail JSON. The issue list can be filtered by type (GPS / heart rate / details); heart-rate-only issues are hidden by default and can be shown with the toggle.
- Sync health — shows the timestamp and outcome of the last Strava, HealthSync, and club leaderboard run. Imports that failed, are disabled, have not run in more than 48 hours, or have not reported at all are flagged in amber/red. HealthSync keepalive checks (runs without importing any new activities) do not count as successful activity imports.
-
Re-auth banner — a Drive re-authorization banner appears when
drive-status.jsonreports a token failure; clicking it opens the OAuth device-flow CGI at/cgi-bin/drive-auth. - Status is read from
strava-sync-status.json,healthsync-sync-status.json, and/strava/leaderboard-sync-status.jsonin the web root. - The page matches the style of all other pages (dark mode, theme toggle, icon header, leaderboard link via HEAD probe).
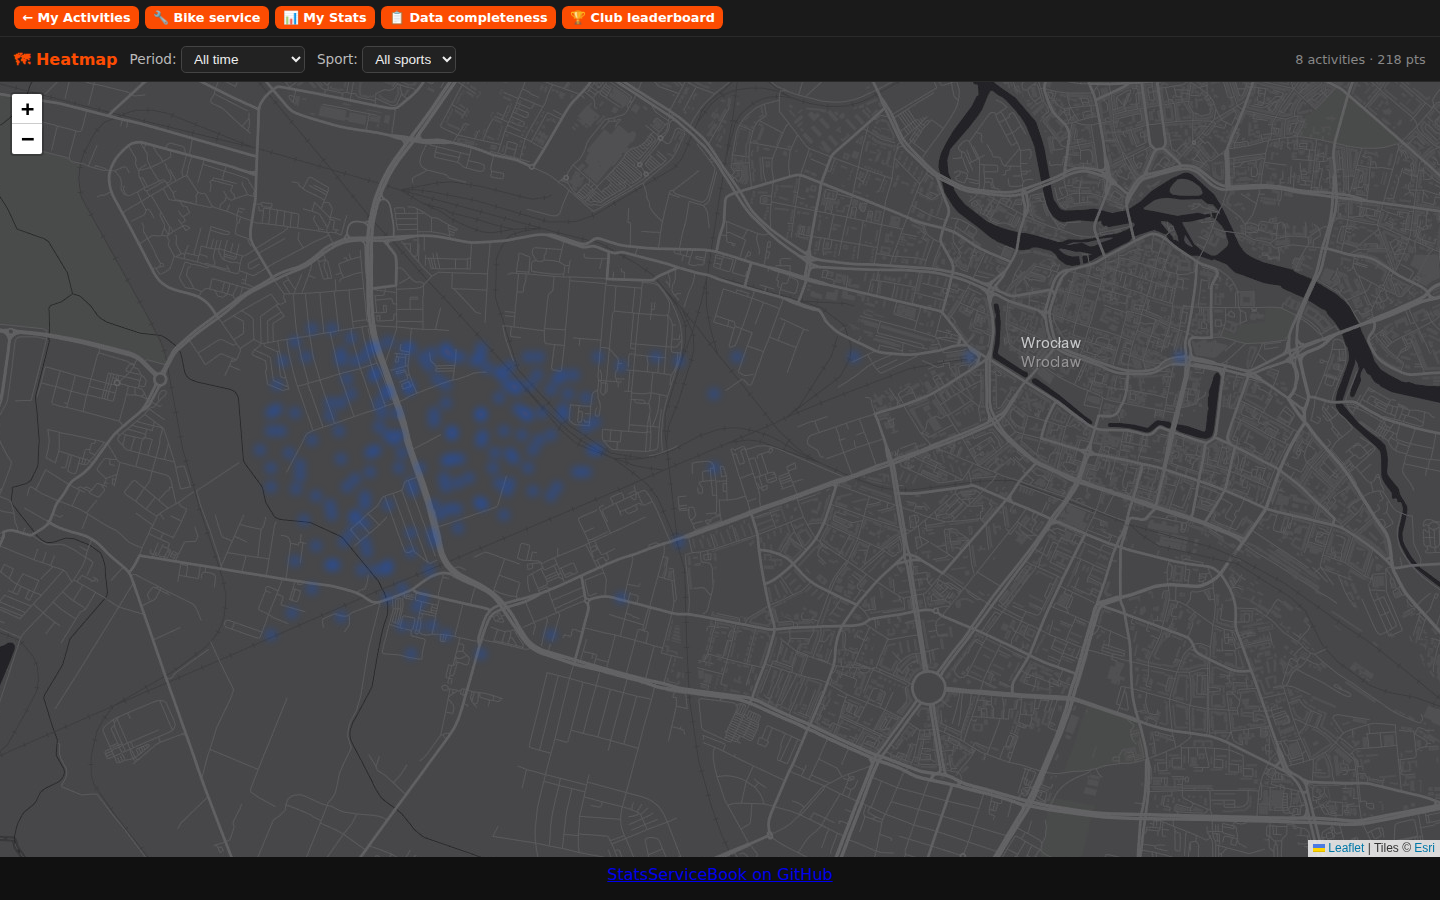
A full-viewport page at /strava/me/heatmap.html (linked from the My Activities header and footer).
- Leaflet.heat overlay — all GPS-tracked activities rendered as a heat layer. Routes you ride frequently appear brighter (blue → orange → yellow gradient).
- Period filter — Last 3 months (default), Last 30 days, Last 7 days, All time, or individual years built dynamically from your data.
- Sport-type filter — defaults to Ride; built dynamically from unique sport types in your data; "All sports" shows everything.
-
City label overlay —
cities.jsonis generated from Overpass API on each run: all cities/towns with population > 15 000 within the bounding box of your GPS data are rendered as dot + name labels on a separate Leaflet pane (z-index 450) above the heat layer. Falls back to the previouscities.jsonif Overpass is unreachable. - Dark basemap — Esri World Dark Gray Base (free, no API key required); falls back to OSM on tile error.
- Activity + point count shown in the top bar; map auto-fits to the visible tracks.
heatmap.json is generated alongside the other pages on each cron run. Every 10th GPS track point is sampled (~11 m precision) to keep the file small. Generation runs last so the dashboard, stats, and other pages are available immediately. As an optimisation, if no GPX file in the web directory is newer than the existing heatmap.json and the heatmap script itself has not changed, regeneration is skipped — heatmap.html is always rewritten.
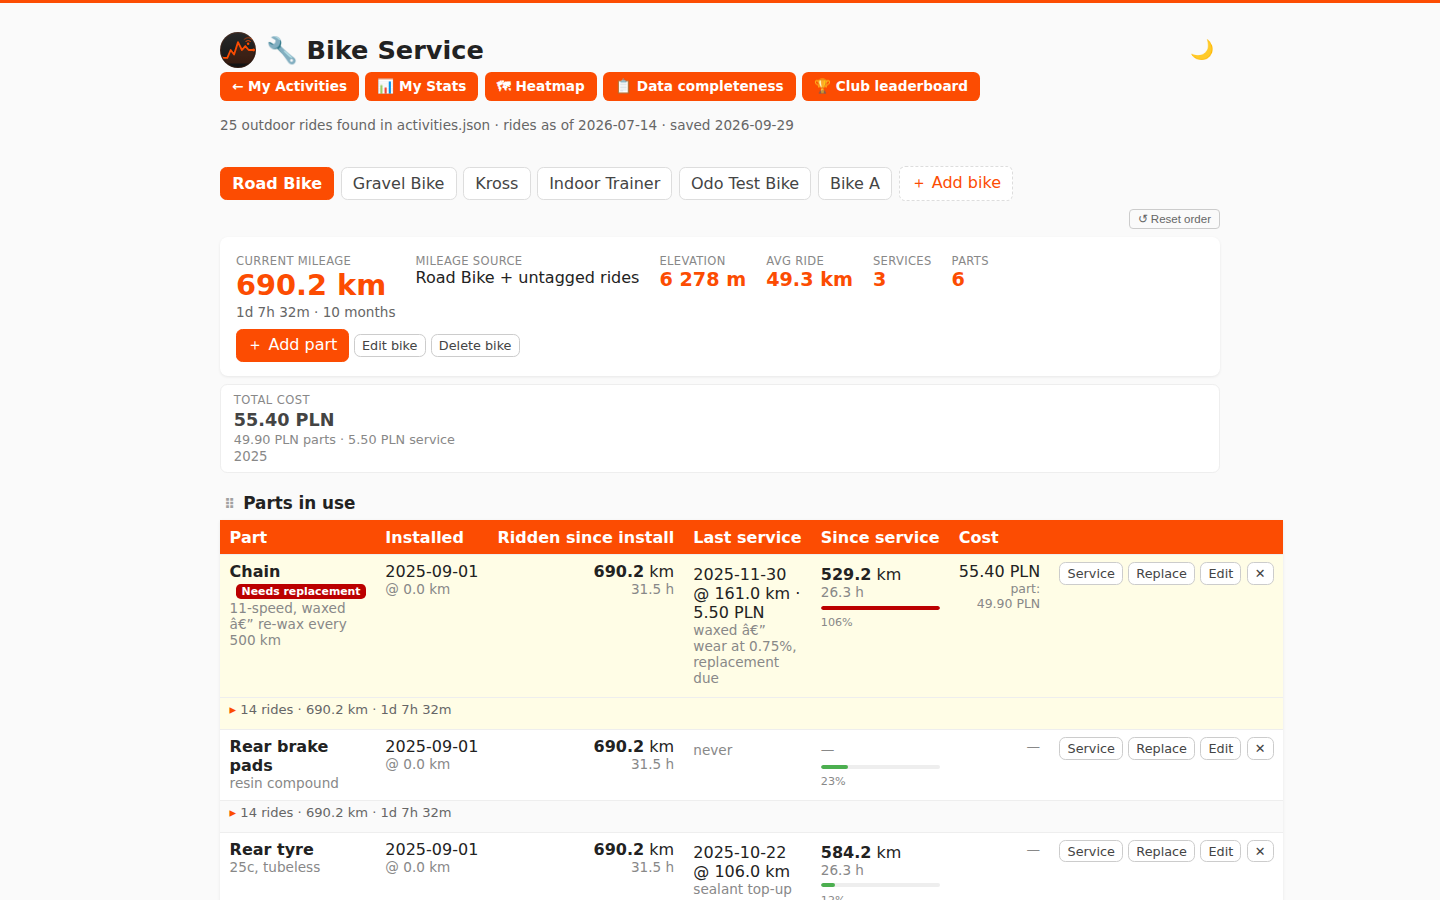 A read/write page at
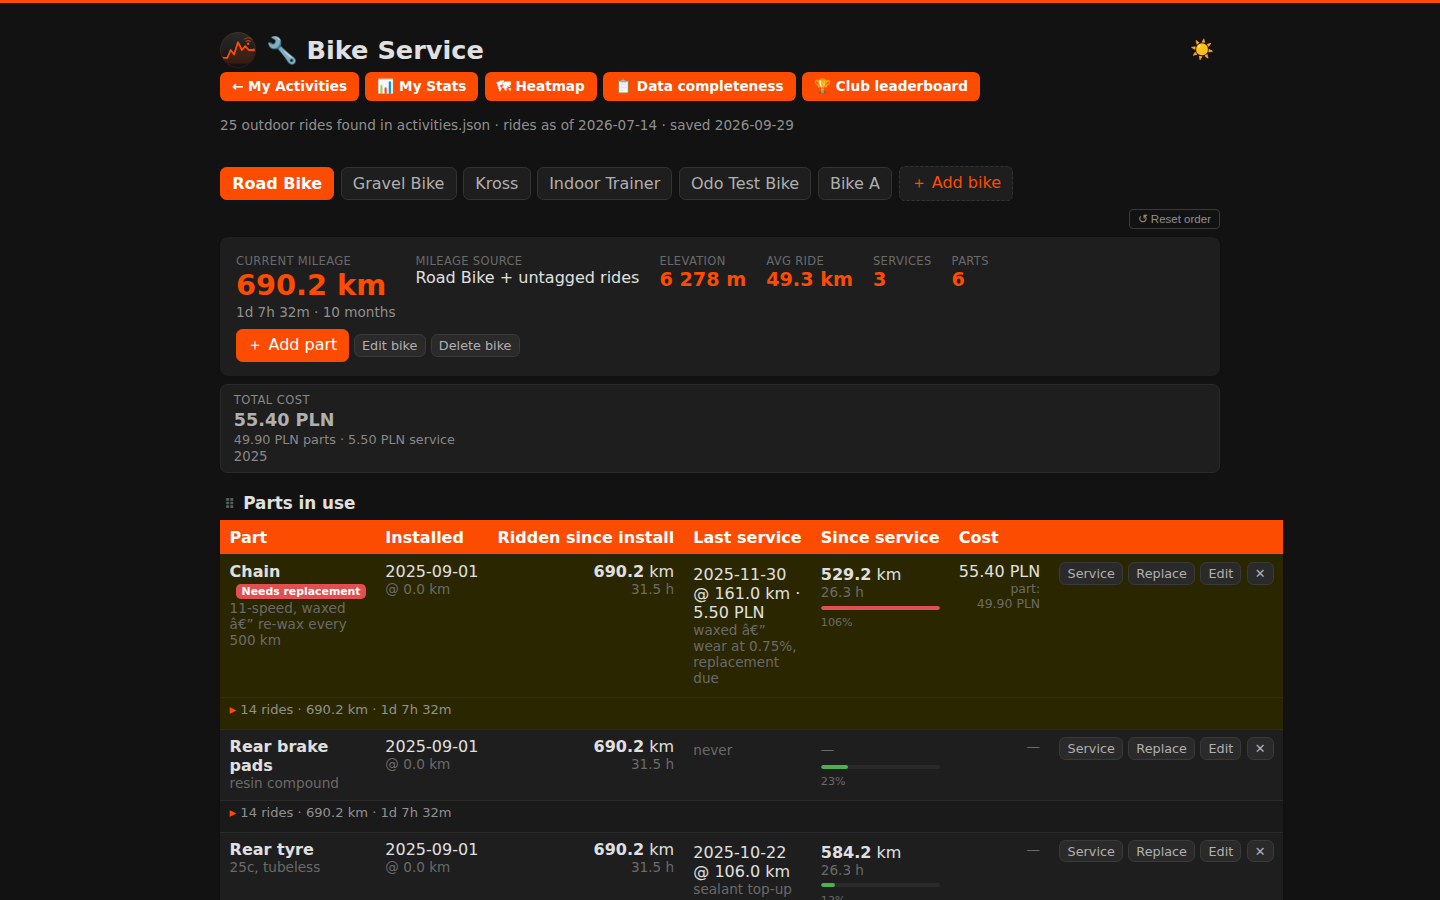
 /strava/me/bike.html. All other pages are static; this one saves data through a CGI.
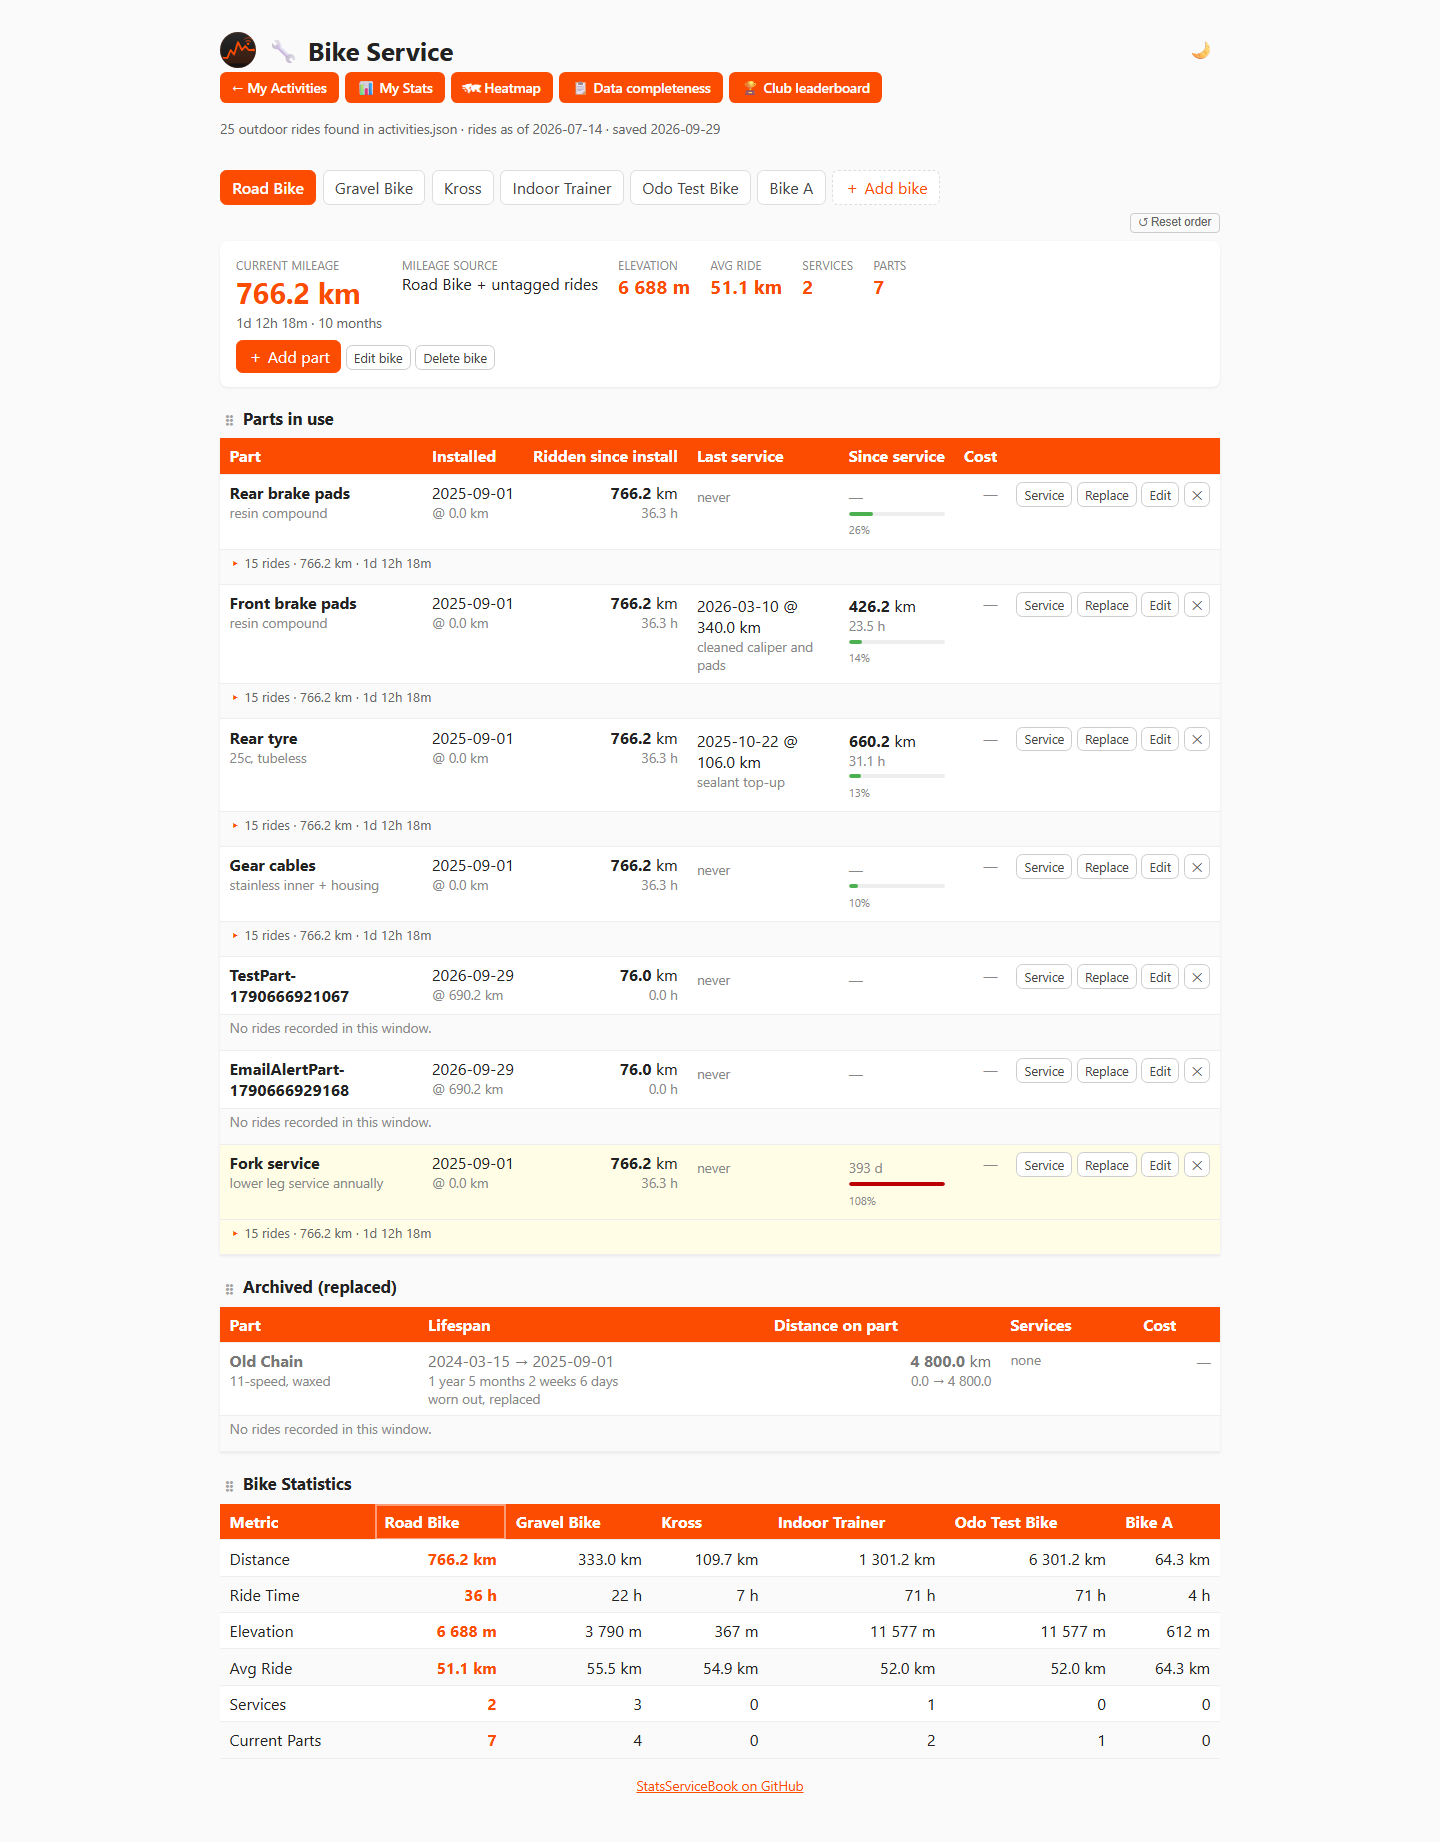
Every mileage figure is computed live in the browser from activities.json: cumulative distance of outdoor Ride activities up to a chosen date. A calendar picker (default: today) lets you pick any date and mileage auto-recomputes instantly. Map a bike to a Strava gear and only that bike's rides count; leave it unmapped and all rides are attributed.
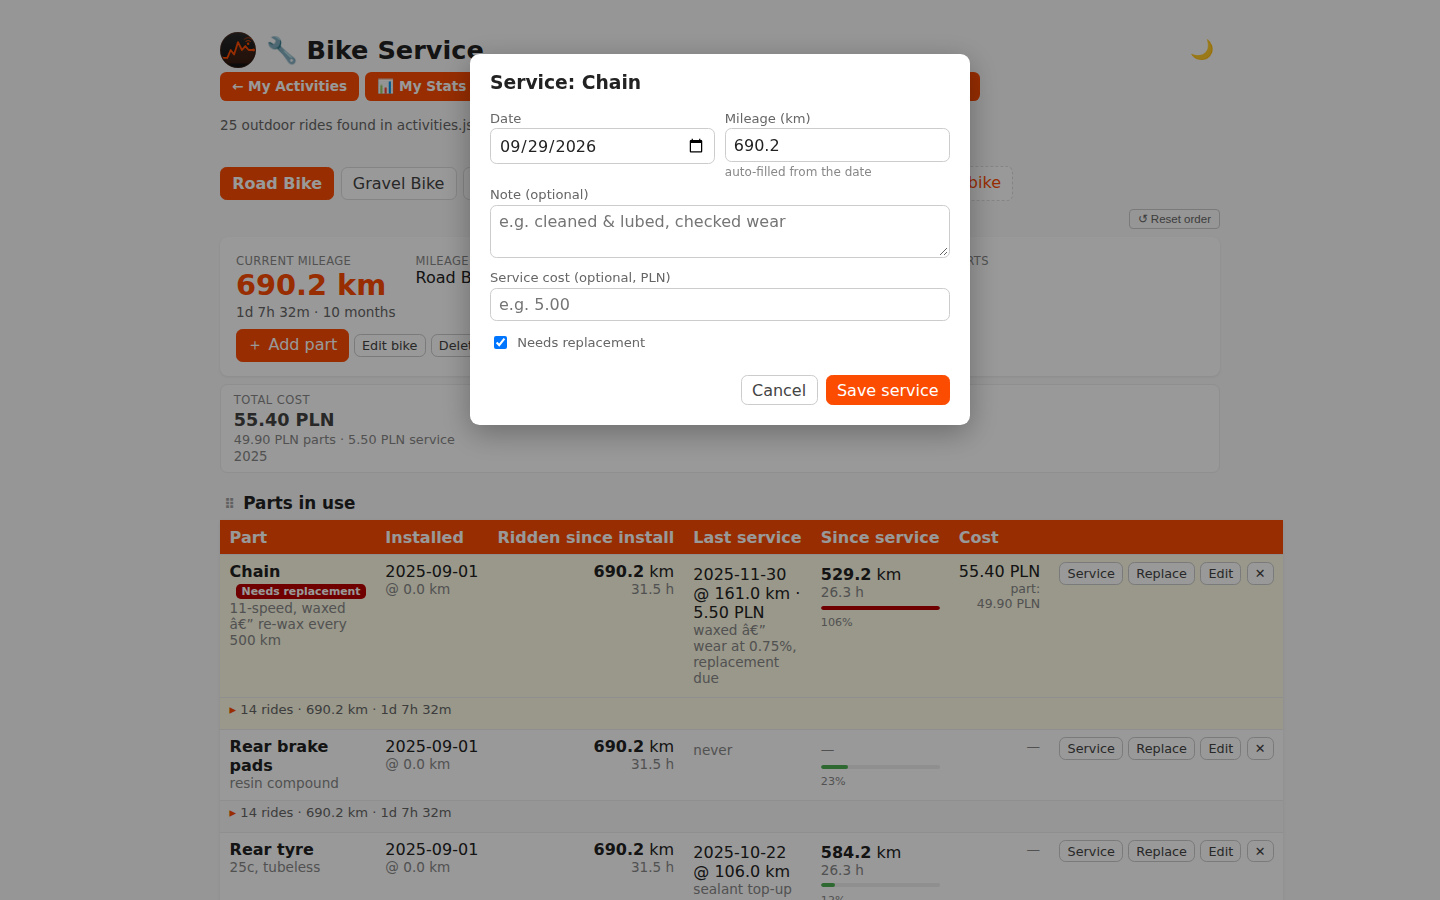
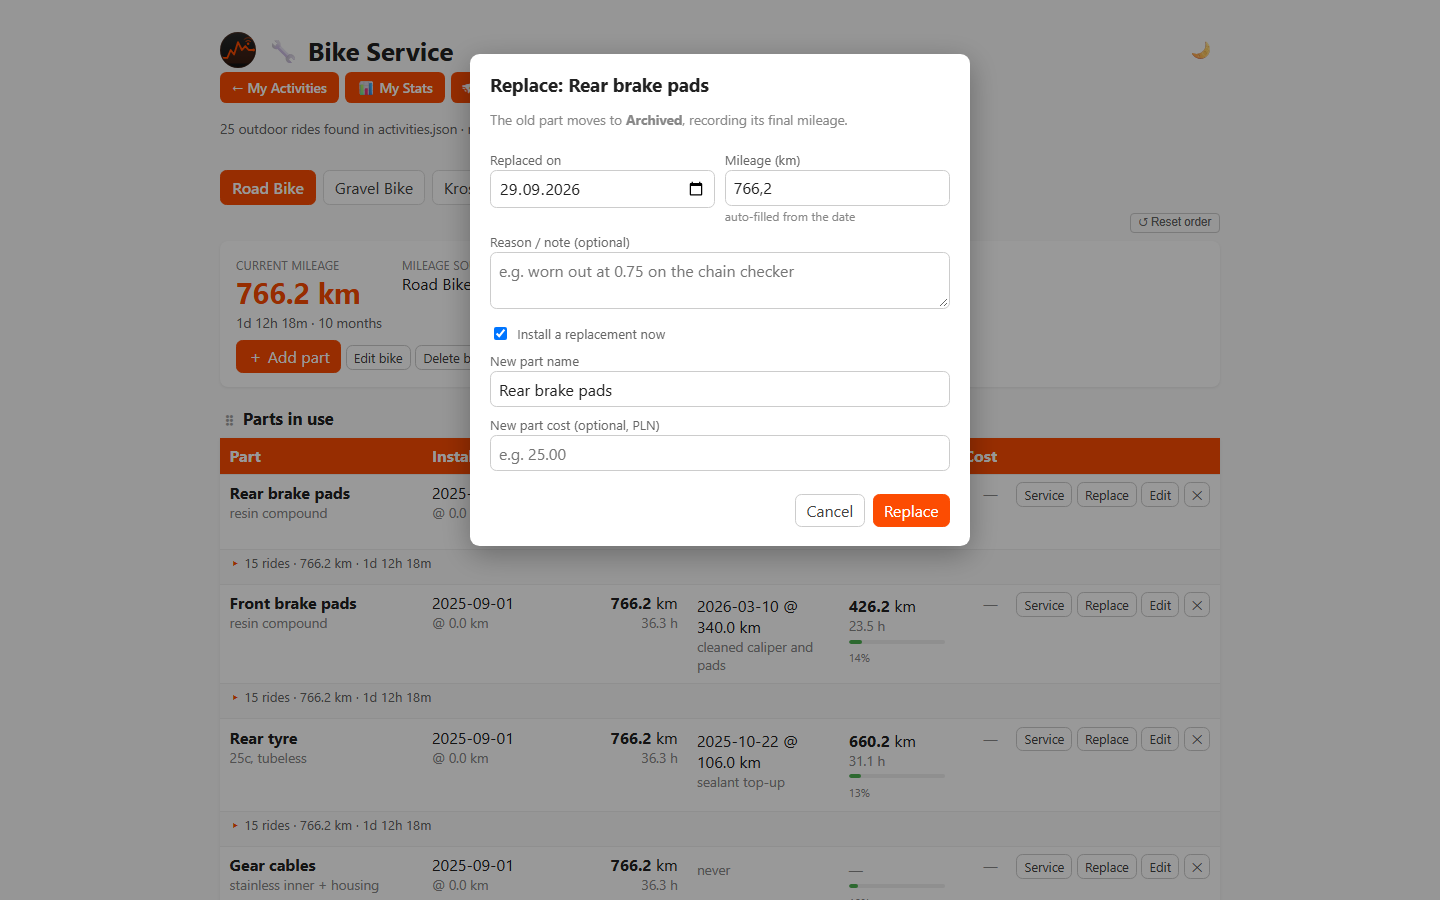 Each part records the date it was fitted and the bike's mileage at that moment. You can:
- Service a part — logs date, current mileage, a free-text note, and an optional service cost.
- Replace a part — the old part moves to an Archived section with final mileage and calendar duration ("1 year 5 months 2 weeks"); optionally a successor is fitted on the same day with its purchase cost recorded.
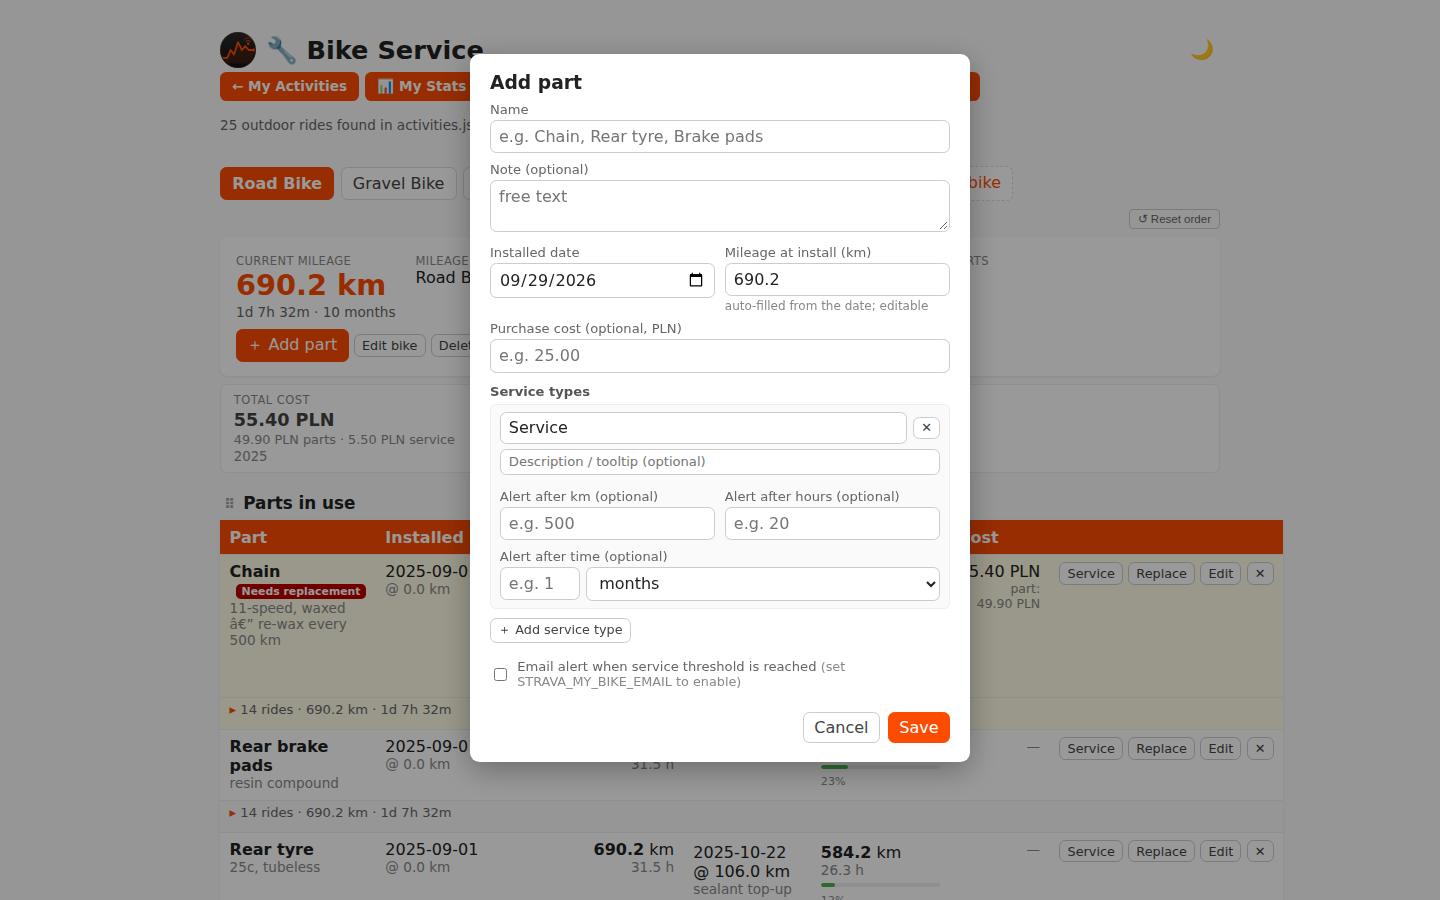
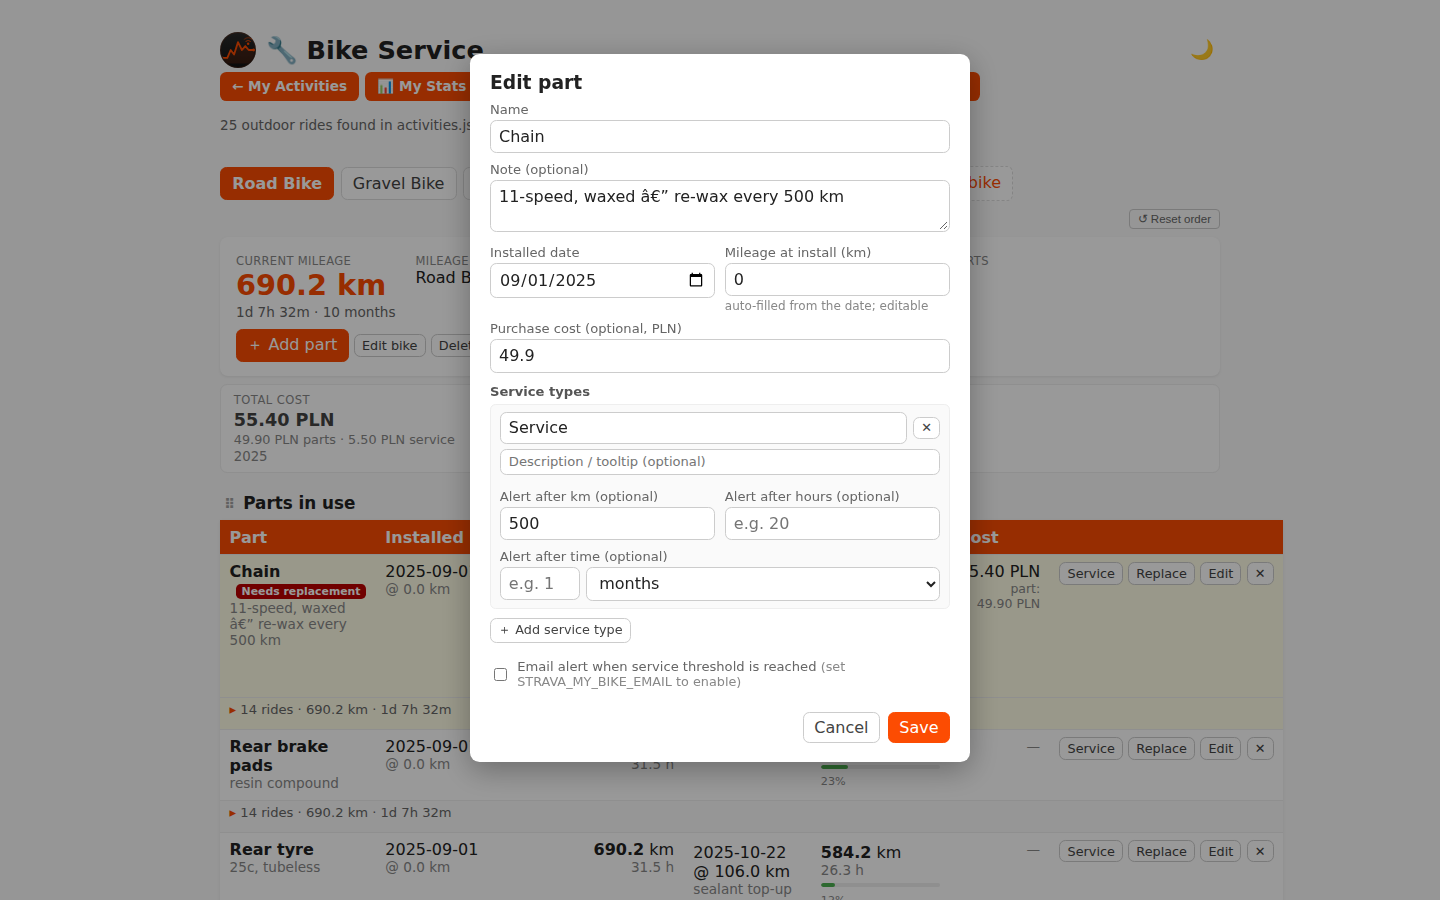 Each part can have one or more named service types — e.g. a chain can have "Clean & Lube" (every 500 km) and "Replace" (every 2 000 km). Each type has its own independent thresholds:
- km threshold — distance since last service of that type
- hours threshold — riding time since last service
- calendar-time threshold — N weeks / months / years (useful for suspension, cables, or time-based intervals regardless of riding distance)
All three thresholds combine: the highest percentage of the three drives the progress bar. Once any type exceeds 100 % its row is highlighted in yellow. Existing single-threshold parts are migrated to a single "Service" type automatically on first load.
Each part has an optional purchase cost field, and each service record has an optional service cost field. When any cost is recorded the bike header shows a Total cost summary. When costs span more than one year a collapsible By year breakdown appears.
The currency code is set by STRAVA_MY_CURRENCY in /etc/strava-my-activities.conf (default PLN). It is appended to every displayed amount — e.g. 25.00 PLN or 12.50 EUR. Costs are stored as plain numbers in bike-service.json; changing the currency config only changes the label shown in the browser.
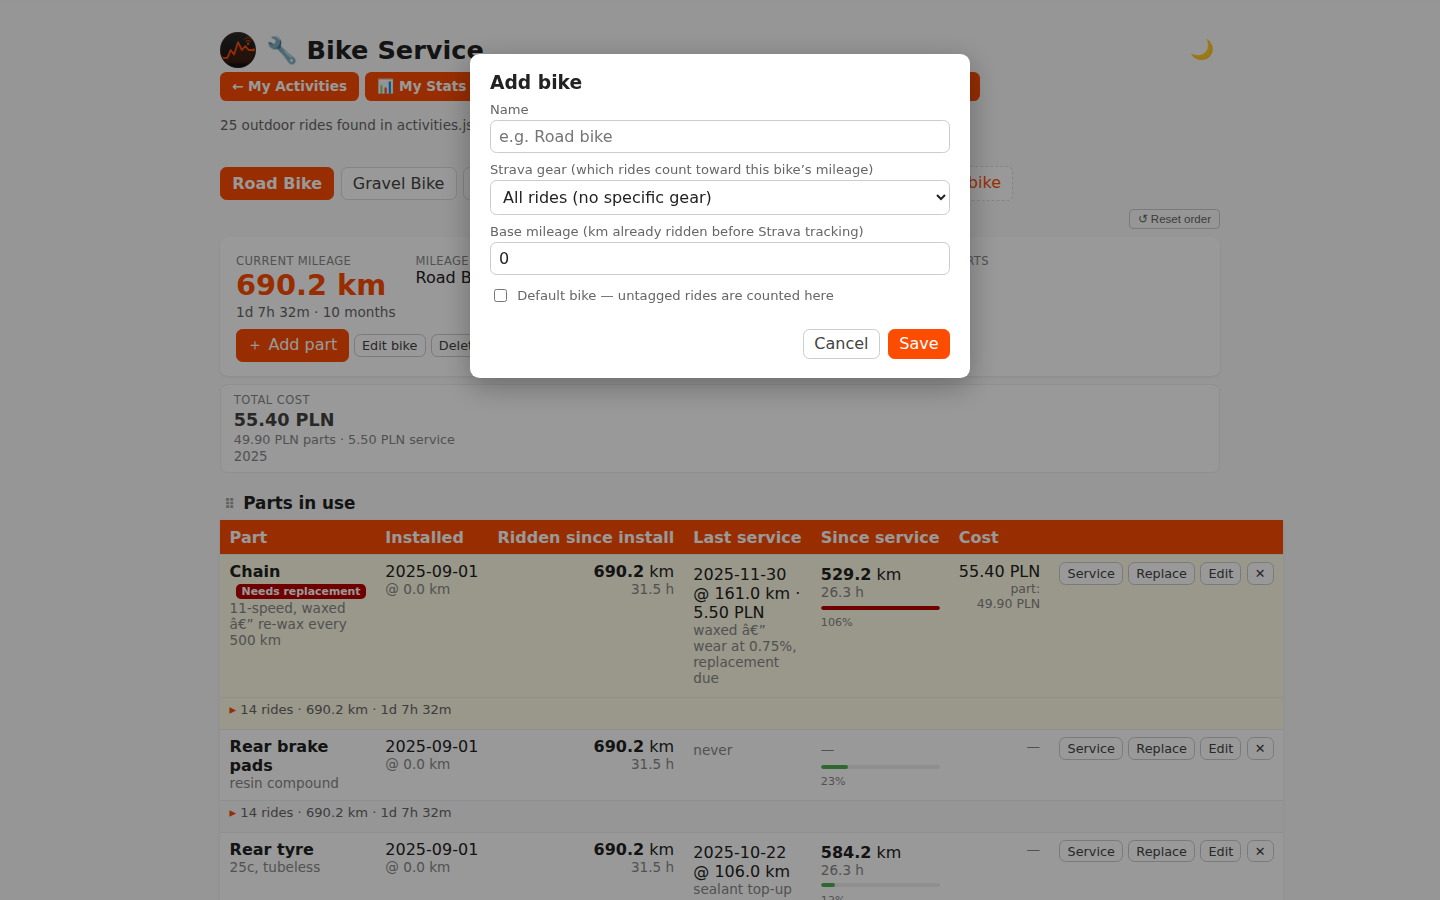
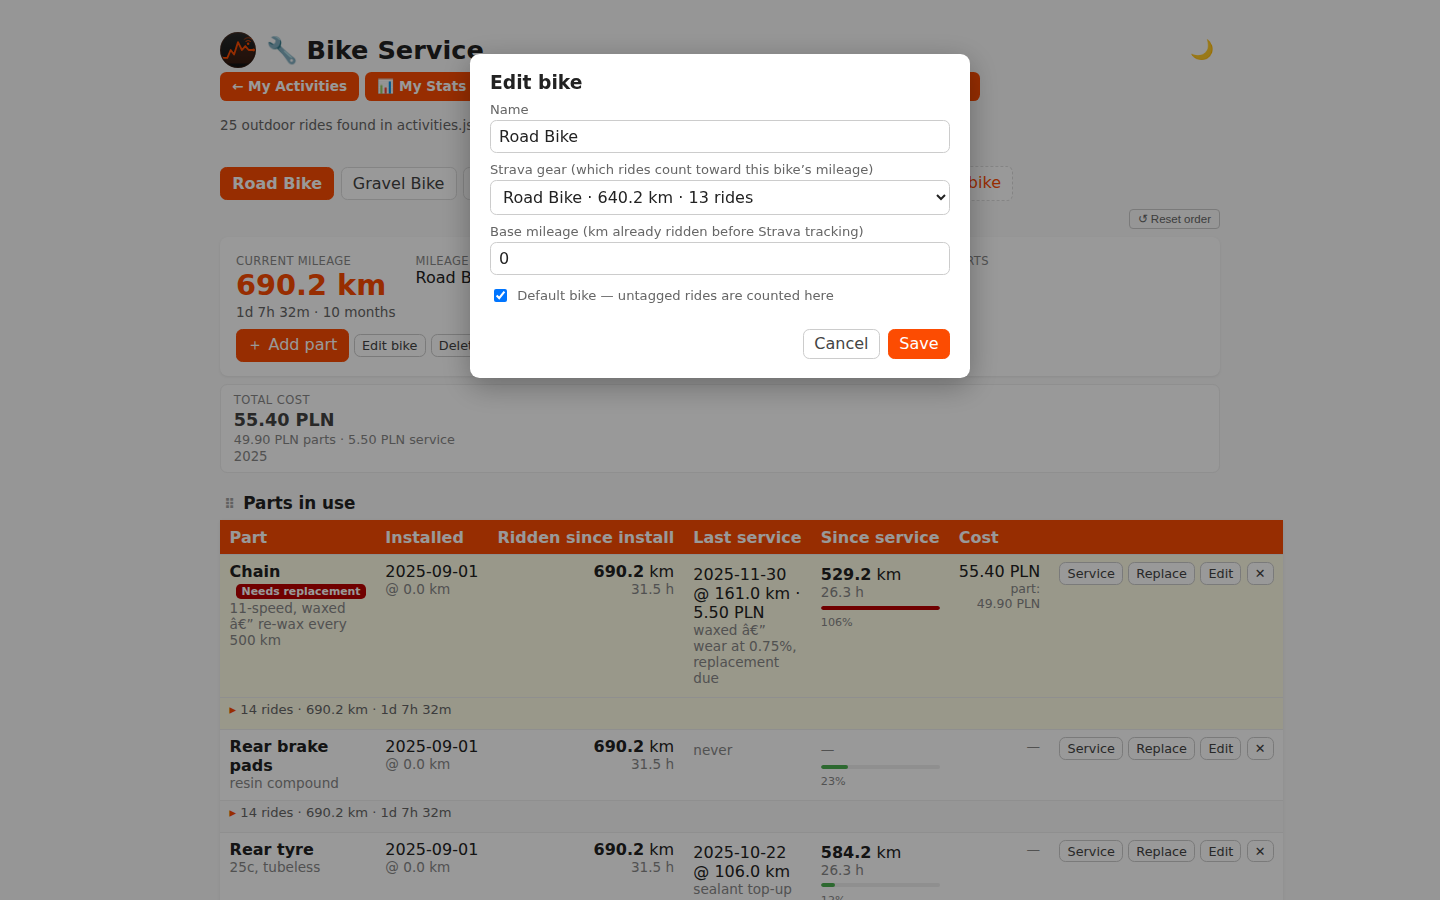
Track as many bikes as you like; each is a separate tab. The initial bike name is set by STRAVA_MY_DEFAULT_BIKE_NAME in the config and is used only as a seed when no bikes are stored yet.
When two or more bikes have any recorded data, a Bike Statistics section appears at the bottom of the panel, comparing all bikes side by side in a single table:
| Metric | Description |
|---|---|
| Distance | Total km ridden on this bike |
| Ride Time | Total riding hours |
| Elevation | Total metres climbed |
| Avg Ride | Mean distance per ride |
| Services | Total number of service events recorded |
| Current Parts | Number of active (non-archived) parts |
The currently selected bike is highlighted in the table (bold accent color, outline header). The comparison table is the "Bike statistics" section and can be reordered like any other section on the page.
The "Email alert when service threshold is reached" checkbox is always visible in the Add / Edit part modal. Tick it for any part you want to be notified about. Emails are only sent when STRAVA_MY_BIKE_EMAIL is set in /etc/strava-my-activities.conf; until then the checkbox shows a small grey hint (set STRAVA_MY_BIKE_EMAIL to enable).
| Threshold % | Behaviour |
|---|---|
| ≥ 90 % | WARNING email — service due soon |
| ≥ 100 % | ALERT email — service overdue; re-sends every 7 days while still overdue |
Each tier fires exactly once per threshold crossing — you won't receive the same warning every day. When a part is serviced and the % drops back below 90 %, the tier resets so you'll be warned again next cycle.
Notification state is tracked in $STATE_DIR/bike-email-state.json. Requires STRAVA_EMAIL_SMTP and STRAVA_EMAIL_USER to be set (same format as the monthly leaderboard email). See Email Notifications for SMTP setup.
The page reads and writes bike-service.json through a tiny POSIX-sh CGI installed to STRAVA_MY_CGI_DIR (default /www/cgi-bin). The CGI is the only writer — daily cron runs that regenerate bike.html never touch your data. No auth: open-on-the-LAN, intended for a private home router only.
Every section on the Personal stats, Activity detail, Bike service, and Club leaderboard pages can be dragged to a new position.
Desktop only. The drag handle and reset button are hidden on touch/mobile devices. The HTML5 Drag and Drop API does not fire on touch screens, so reordering is unavailable there; the saved order from a desktop visit is still applied on mobile.
- Hover over any section heading — a ⠿ drag handle appears on the left.
- Click and drag the handle to move the section above or below its neighbours.
- Release to drop it in place.
The reordered layout is saved in localStorage and restored on the next page load.
A ↺ Reset section order button appears above the section list. Clicking it clears the saved order and restores the page to its default layout.
| Page | Default order |
localStorage key |
|---|---|---|
| Personal stats | KPI tiles → Annual Goals → Weekly Goals → Records → Top 10 → Year overview → Monthly chart → Monthly table → Year-over-year heatmap → Sport breakdown → Day-of-week | ssb-stats-sec |
| Activity detail | Stat cards → Map → Elevation → Heart rate → Cadence → Power → HR zones → Splits | ssb-detail-sec |
| Bike service | Parts in use → Archived parts → Bike statistics | ssb-bike-sec |
| Club leaderboard | Leaderboard table → Top 5 year → Period tiles → Achievements → This year → All-time tiles | ssb-lb-sec |
Bike service and Club leaderboard sections are conditional — a section only appears (and is reorderable) if data for it exists. Saved order entries for absent sections are silently ignored.
| Stats reordered | Activity detail reordered |
|---|---|
 |
 |
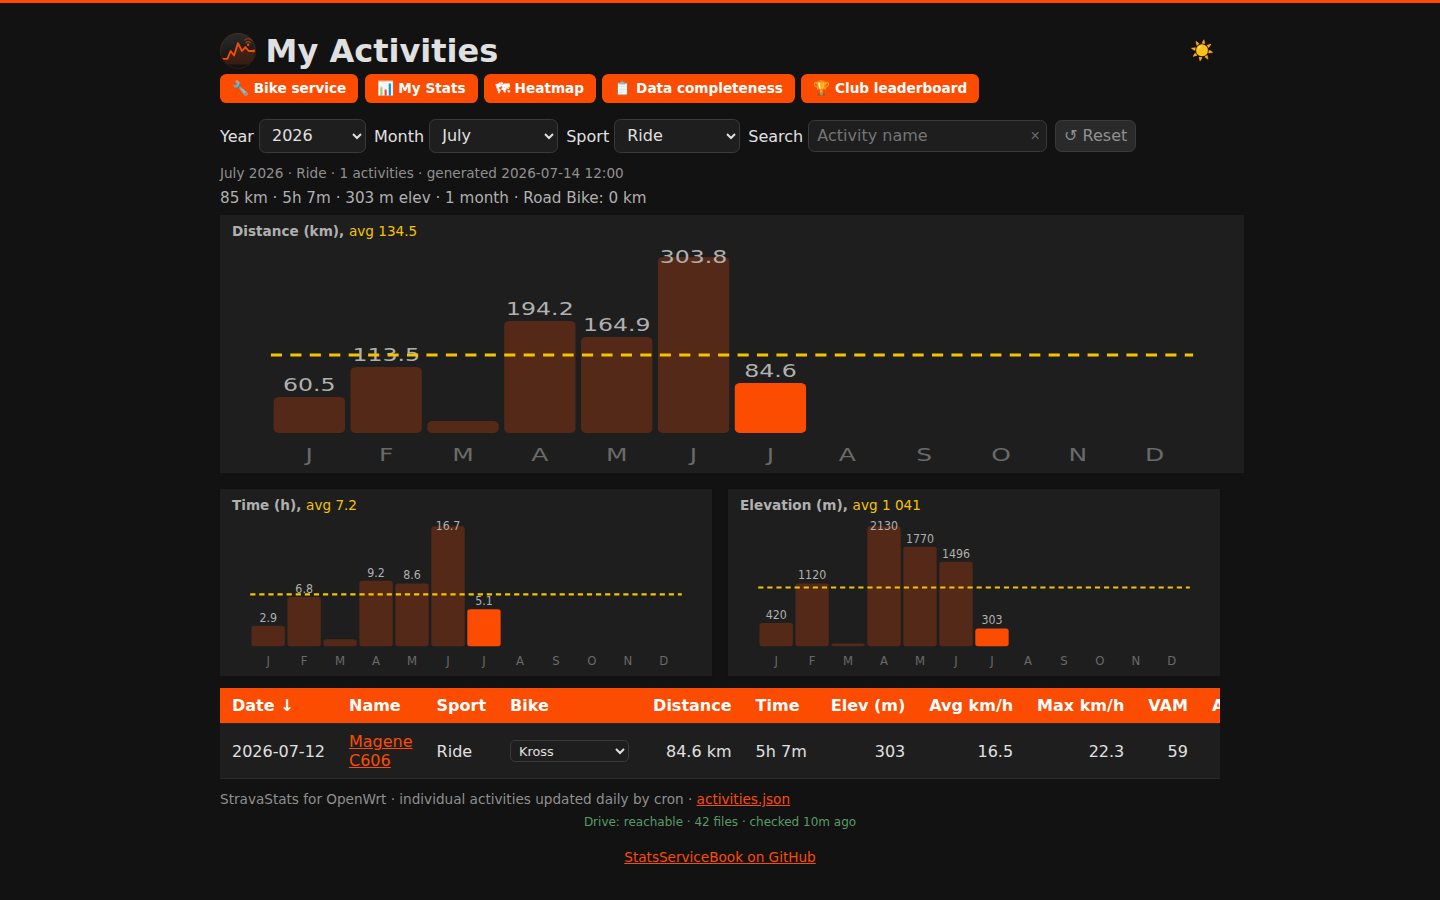
Every page except the heatmap (which is already dark by design) has a 🌙 / ☀️ toggle button fixed to the top-right corner of the screen.
| Light | Dark |
|---|---|
|
 |
|
 |
|
 |
|
 |
|
 |
How it works:
- The default theme follows the OS
prefers-color-schemesetting — no configuration needed. - Clicking the toggle manually overrides the OS preference and stores the choice in
localStorage, so it persists across page loads and browser restarts. - The chosen theme is applied immediately via an anti-FOUC inline script in
<head>— there is no flash of the wrong theme on page load. - All colours are CSS custom properties; SVG chart fills and strokes use
var(--accent),var(--chart-grid), etc., so charts adapt without re-rendering. - Weather source badges (
.wx-arch,.wx-fcst,.wx-dev) have distinct dark-mode palettes that maintain sufficient contrast.
Each run reconciles the activity store against the feed:
- Renamed rides, corrected sport types, recalculated distance/time are updated in place.
- Activities deleted on Strava are pruned from the dashboard (cached detail file removed; changed activities have their detail re-fetched).
- Deletion is conservative — only happens when the run reached the end of the feed, or within the date window actually fetched on a capped run. An empty feed never prunes.
- Set
STRAVA_MY_PRUNE_DELETED=0to disable deletions (additions and in-place updates still apply).
Beyond the summary feed, each run fetches the full activity object for activities that don't yet have a detail file. Because Strava's read API is rate-limited (100 req / 15 min, 1 000 / day), it fetches at most STRAVA_MY_DETAIL_MAX_PER_RUN new files per run (newest first). History backfills gradually; activities Strava reports gone (HTTP 404/410) are recorded in a skip list and not retried.
In scrape mode the script fetches each activity's HTML page and extracts stats from Strava's embedded bootstrap data. It also downloads the GPX export per activity so the Leaflet route map works.
The My Activities dashboard shows a colour-coded banner indicating when the _strava4_session cookie was last verified and when it will expire (~30 days). Green = fresh, amber = expiring soon, red = expired.
Walk / Run / Hike detail pages — per-km splits are computed client-side from the downloaded GPX track (haversine distance + timestamps + elevation + HR + cadence), so these activity types show a pace/speed bar chart instead of "no splits". The steps card shows the actual device step count from the scraped page when available; otherwise it falls back to a cadence estimate.
Health alert emails — three silent failure conditions in scrape mode now trigger a consolidated alert email (once per day, rate-limited via $STATE_DIR/scrape-alert.txt):
| Trigger | Condition |
|---|---|
| Strava layout change | Detail page parse produced no usable data |
| Cookie expired mid-run | Session cookie rejected during detail backfill |
| Normalization failure |
jq could not parse an activity list page |
The email is sent to STRAVA_MY_BIKE_EMAIL (same address used for bike-service alerts). No new config key needed — set that address and both alert types activate.
When both a Magene FIT file and a HealthSync watch export cover the same ride (start times within ±10 min, end times within ±5 min), the two records are merged:
- Watch record keeps its heart-rate data (which the Magene doesn't have).
- Watch record gains the Magene's wheel-sensor–accurate distance, speed, cadence, and elevation.
- Merged record carries
dual_source: trueand amagene_idback-reference.
For a standalone Magene activity (no matching watch record), distance is extracted directly from the FIT binary's odometer field — wheel-sensor accuracy. Falls back to GPS Haversine if the FIT doesn't contain usable odometer data.