feat(LineChart): add React Native support - #3718
Conversation


Add SVG-based `LineChart.native.tsx` implementation with:
- native line rendering
- tap-to-stay scrub tooltip on a single responder surface
- reference lines with web-matching label placement
- opaque tooltip matching the web appearance

Includes native unit tests and snapshots, plus a story tweak.

Co-authored-by: Cursor <cursoragent@cursor.com>


🦋 Changeset detectedLatest commit: c5ad72e The changes in this PR will be included in the next version bump. This PR includes changesets to release 1 package
Not sure what this means? Click here to learn what changesets are. Click here if you're a maintainer who wants to add another changeset to this PR |

|
🤖 Slash AI Review has been triggered. View execution logs |

🛡️ Coverage ReportSummaryFull Coverage Details |
|
(Review Cancelled - Superseded by a new run) |
![rzp-slash-public[bot]](https://avatars.githubusercontent.com/u/7713209?s=60&v=4)

There was a problem hiding this comment.
✨ Agentic PR Review ✨
Usage
import {
  ChartLine,
  ChartLineWrapper,
  ChartXAxis,
  ChartYAxis,
  ChartCartesianGrid,
  ChartTooltip,
  ChartLegend,
  ChartReferenceLine,
} from '@razorpay/blade/components';

<ChartLineWrapper data={data}>
  <ChartCartesianGrid />
  <ChartXAxis dataKey="name" />
  <ChartYAxis />
  <ChartTooltip />
  <ChartLegend />
  <ChartLine dataKey="sales" name="Sales" />
</ChartLineWrapper>![rzp-slash[bot]](https://github.githubassets.com/images/gravatars/gravatar-user-420.png)
Co-authored-by: admin <admin>

|
✨ Slash PR Healer ✨ Fixed the following CI failures:
Also added:
|
|
(Review Cancelled - Superseded by a new run) |
|
Fixed in branch Changes:
[resolved by agent] |
There was a problem hiding this comment.
✨ Agentic PR Review ✨
UI Review
⏭️ 1 skipped
Usage
import { ChartLineWrapper, ChartLine, ChartXAxis, ChartYAxis, ChartLegend, ChartTooltip, ChartCartesianGrid, ChartReferenceLine } from '@razorpay/blade/components';

<ChartLineWrapper data={data} testID="line-chart" colorTheme="categorical">
  <ChartXAxis dataKey="name" />
  <ChartYAxis />
  <ChartLegend />
  <ChartTooltip />
  <ChartLine dataKey="sales" name="Sales" type="monotone" />
  <ChartLine dataKey="profit" name="Profit" strokeStyle="dashed" />
</ChartLineWrapper>…e-level eslint-disable with targeted per-line disables [resolved by agent] Co-authored-by: admin <admin>
|
🤖 Slash AI Review has been triggered. View execution logs |
|
(Review Cancelled - Superseded by a new run) |
 rzp-slash-public
Bot
added
the
rcore:eligible-for-auto-approval
rzp-slash-public
Bot
added
the
rcore:eligible-for-auto-approval
 rohankokane-dev
left a comment
rohankokane-dev
left a comment
rohankokane-dev
left a comment
There was a problem hiding this comment.
✨ Agentic PR Review ✨
Usage
import {
  ChartLineWrapper,
  ChartLine,
  ChartXAxis,
  ChartYAxis,
  ChartCartesianGrid,
  ChartTooltip,
  ChartLegend,
  ChartReferenceLine,
} from '@razorpay/blade/components';

<ChartLineWrapper data={data} colorTheme="categorical" testID="revenue-chart">
  <ChartCartesianGrid />
  <ChartXAxis dataKey="month" />
  <ChartYAxis label="Revenue" />
  <ChartTooltip />
  <ChartLegend />
  <ChartLine dataKey="revenue" name="Revenue" type="monotone" strokeStyle="solid" />
  <ChartReferenceLine y={100} label="Target" />
</ChartLineWrapper>Co-authored-by: admin <admin>
|
(Review Cancelled - Superseded by a new run) |
Skip null/undefined cells when computing the y-domain, show a placeholder for missing tooltip values, and clamp yMax to 0 for all-negative data instead of niceCeil's fallback of 1.

Co-authored-by: Cursor <cursoragent@cursor.com>
|
(Review Cancelled - Superseded by a new run) |
|
(Review Cancelled - Superseded by a new run) |
There was a problem hiding this comment.
✨ Agentic PR Review ✨
Status: Approved ✅
UI Review
✅ 5 passed
Passing checks (5)
| Check | Screenshot |
|---|---|
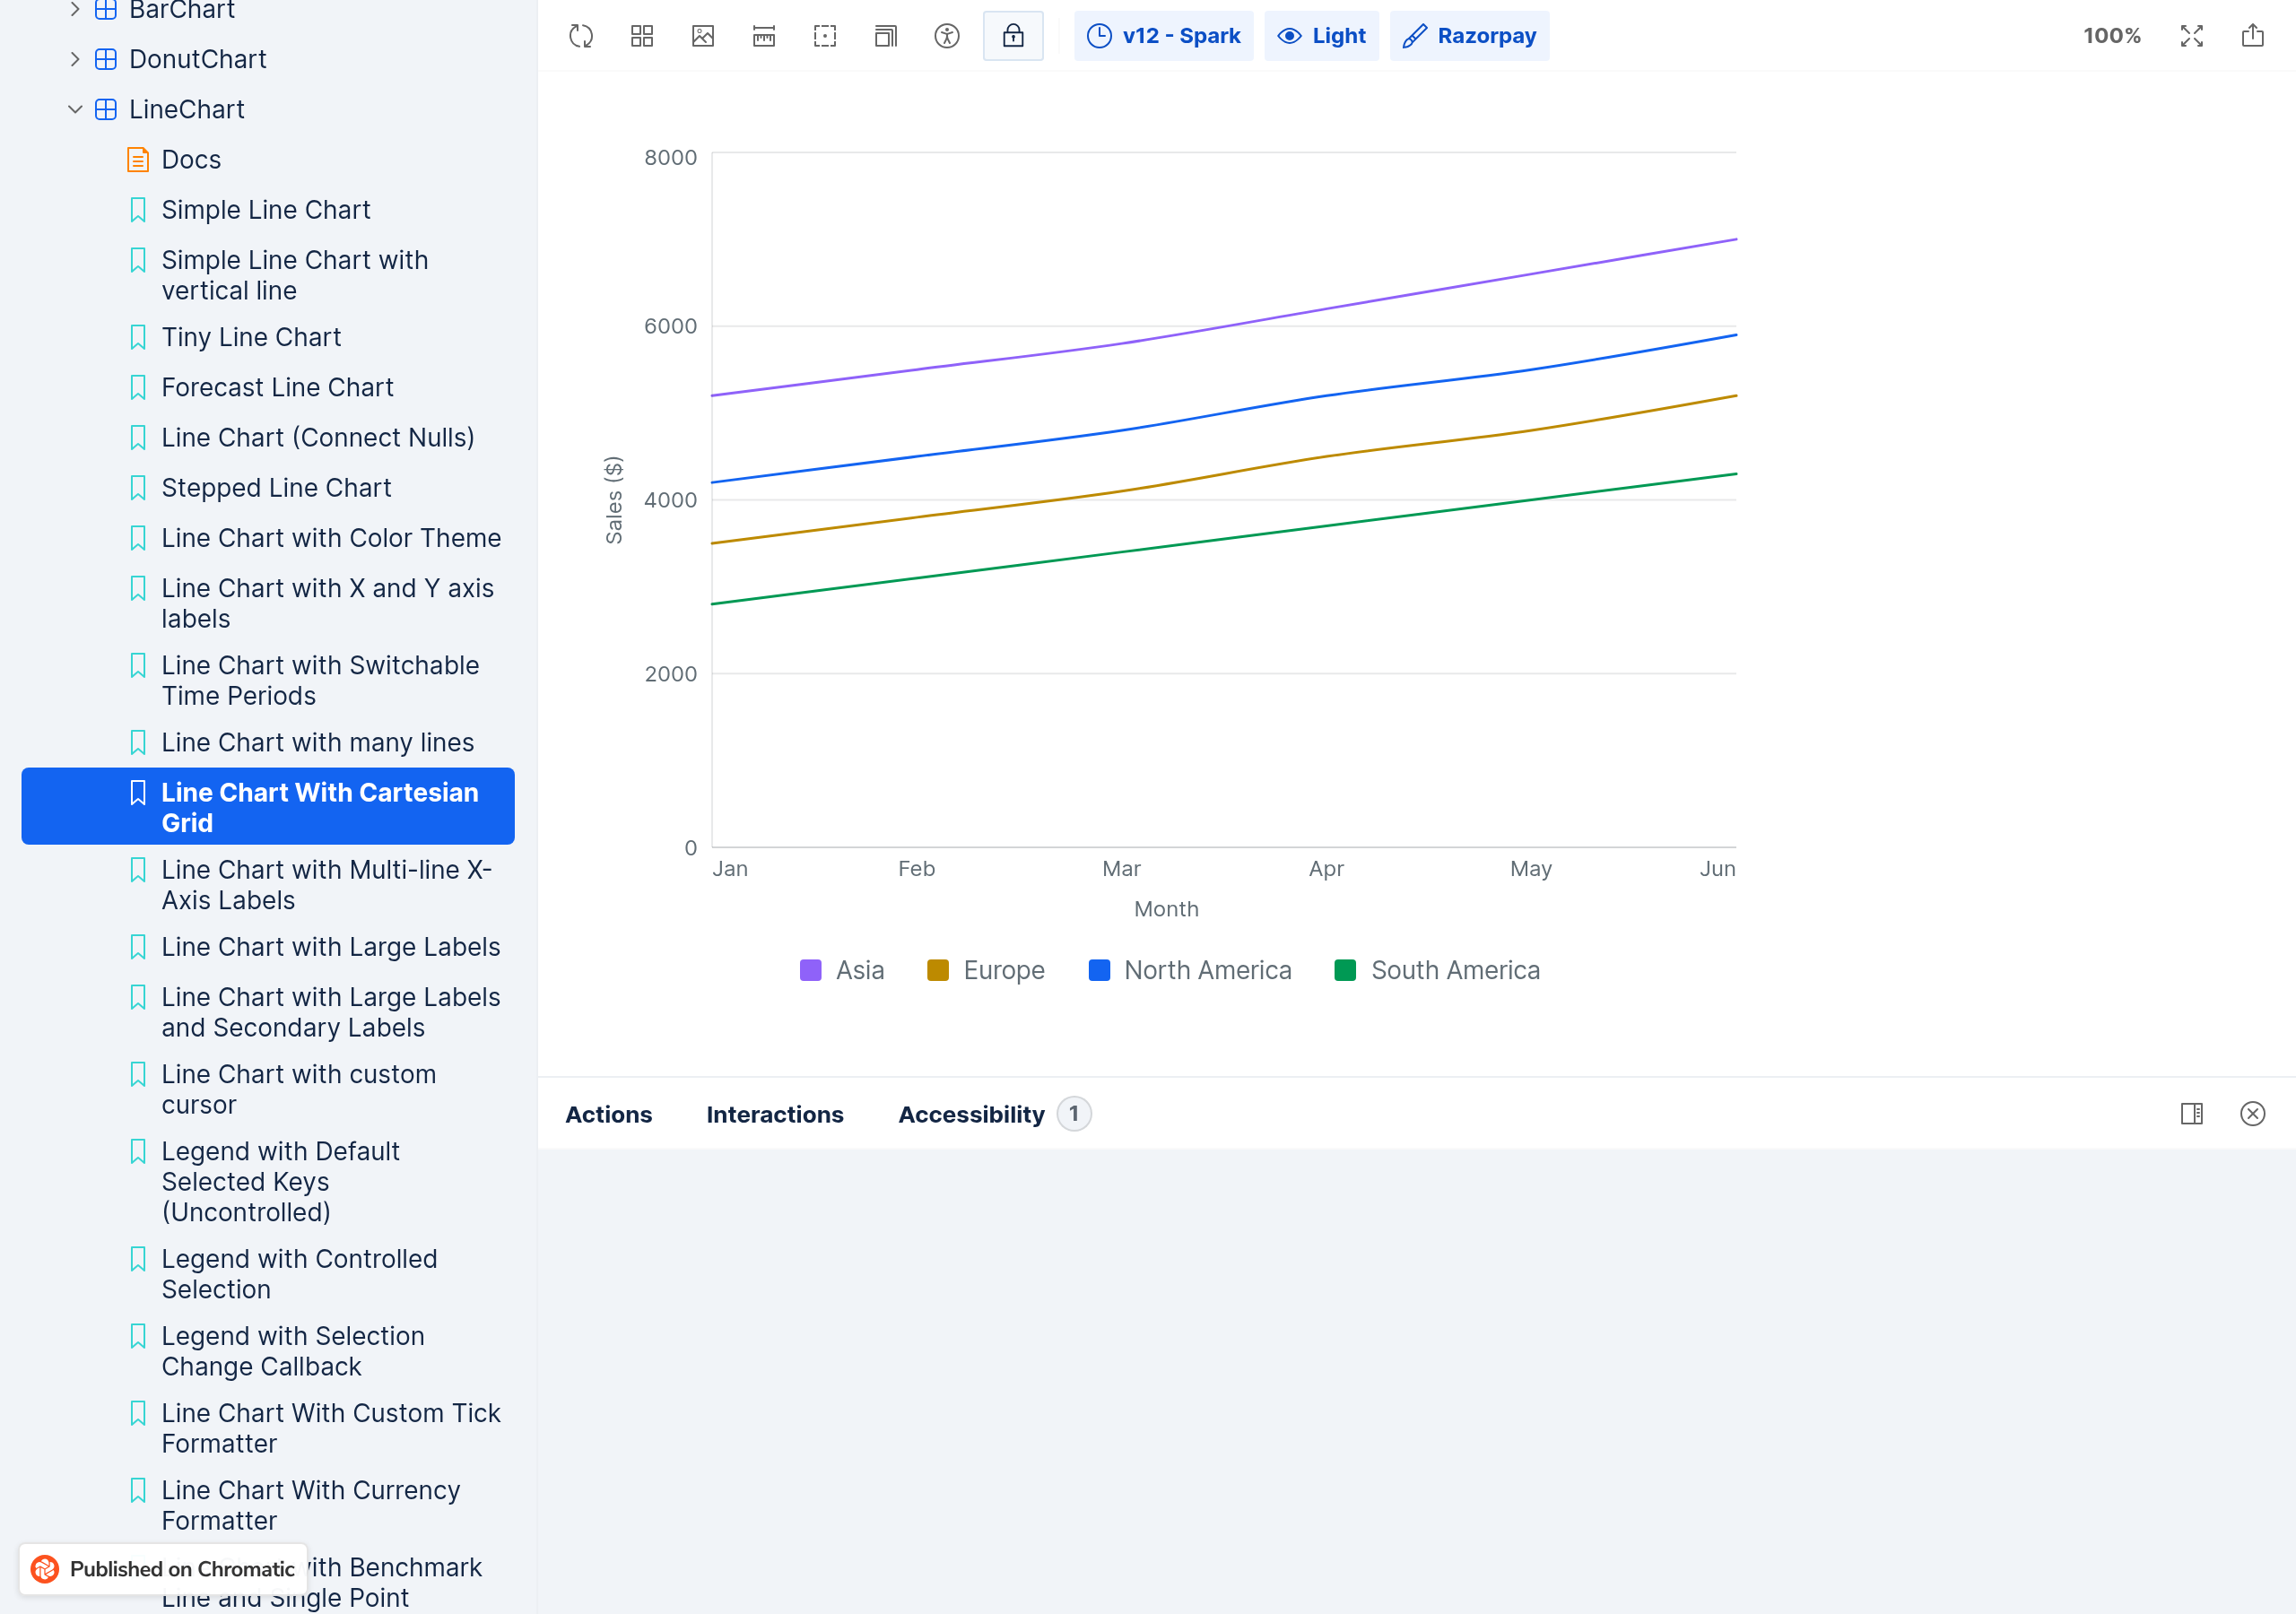
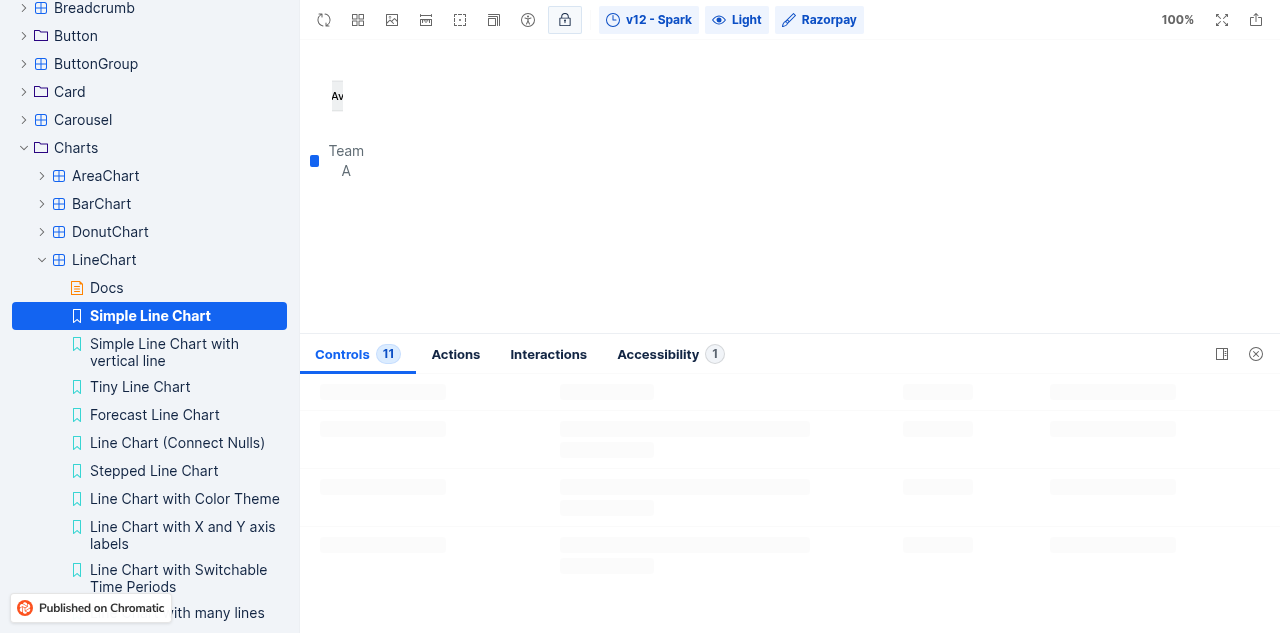
| ✅ LineChart SimpleLineChart |  |
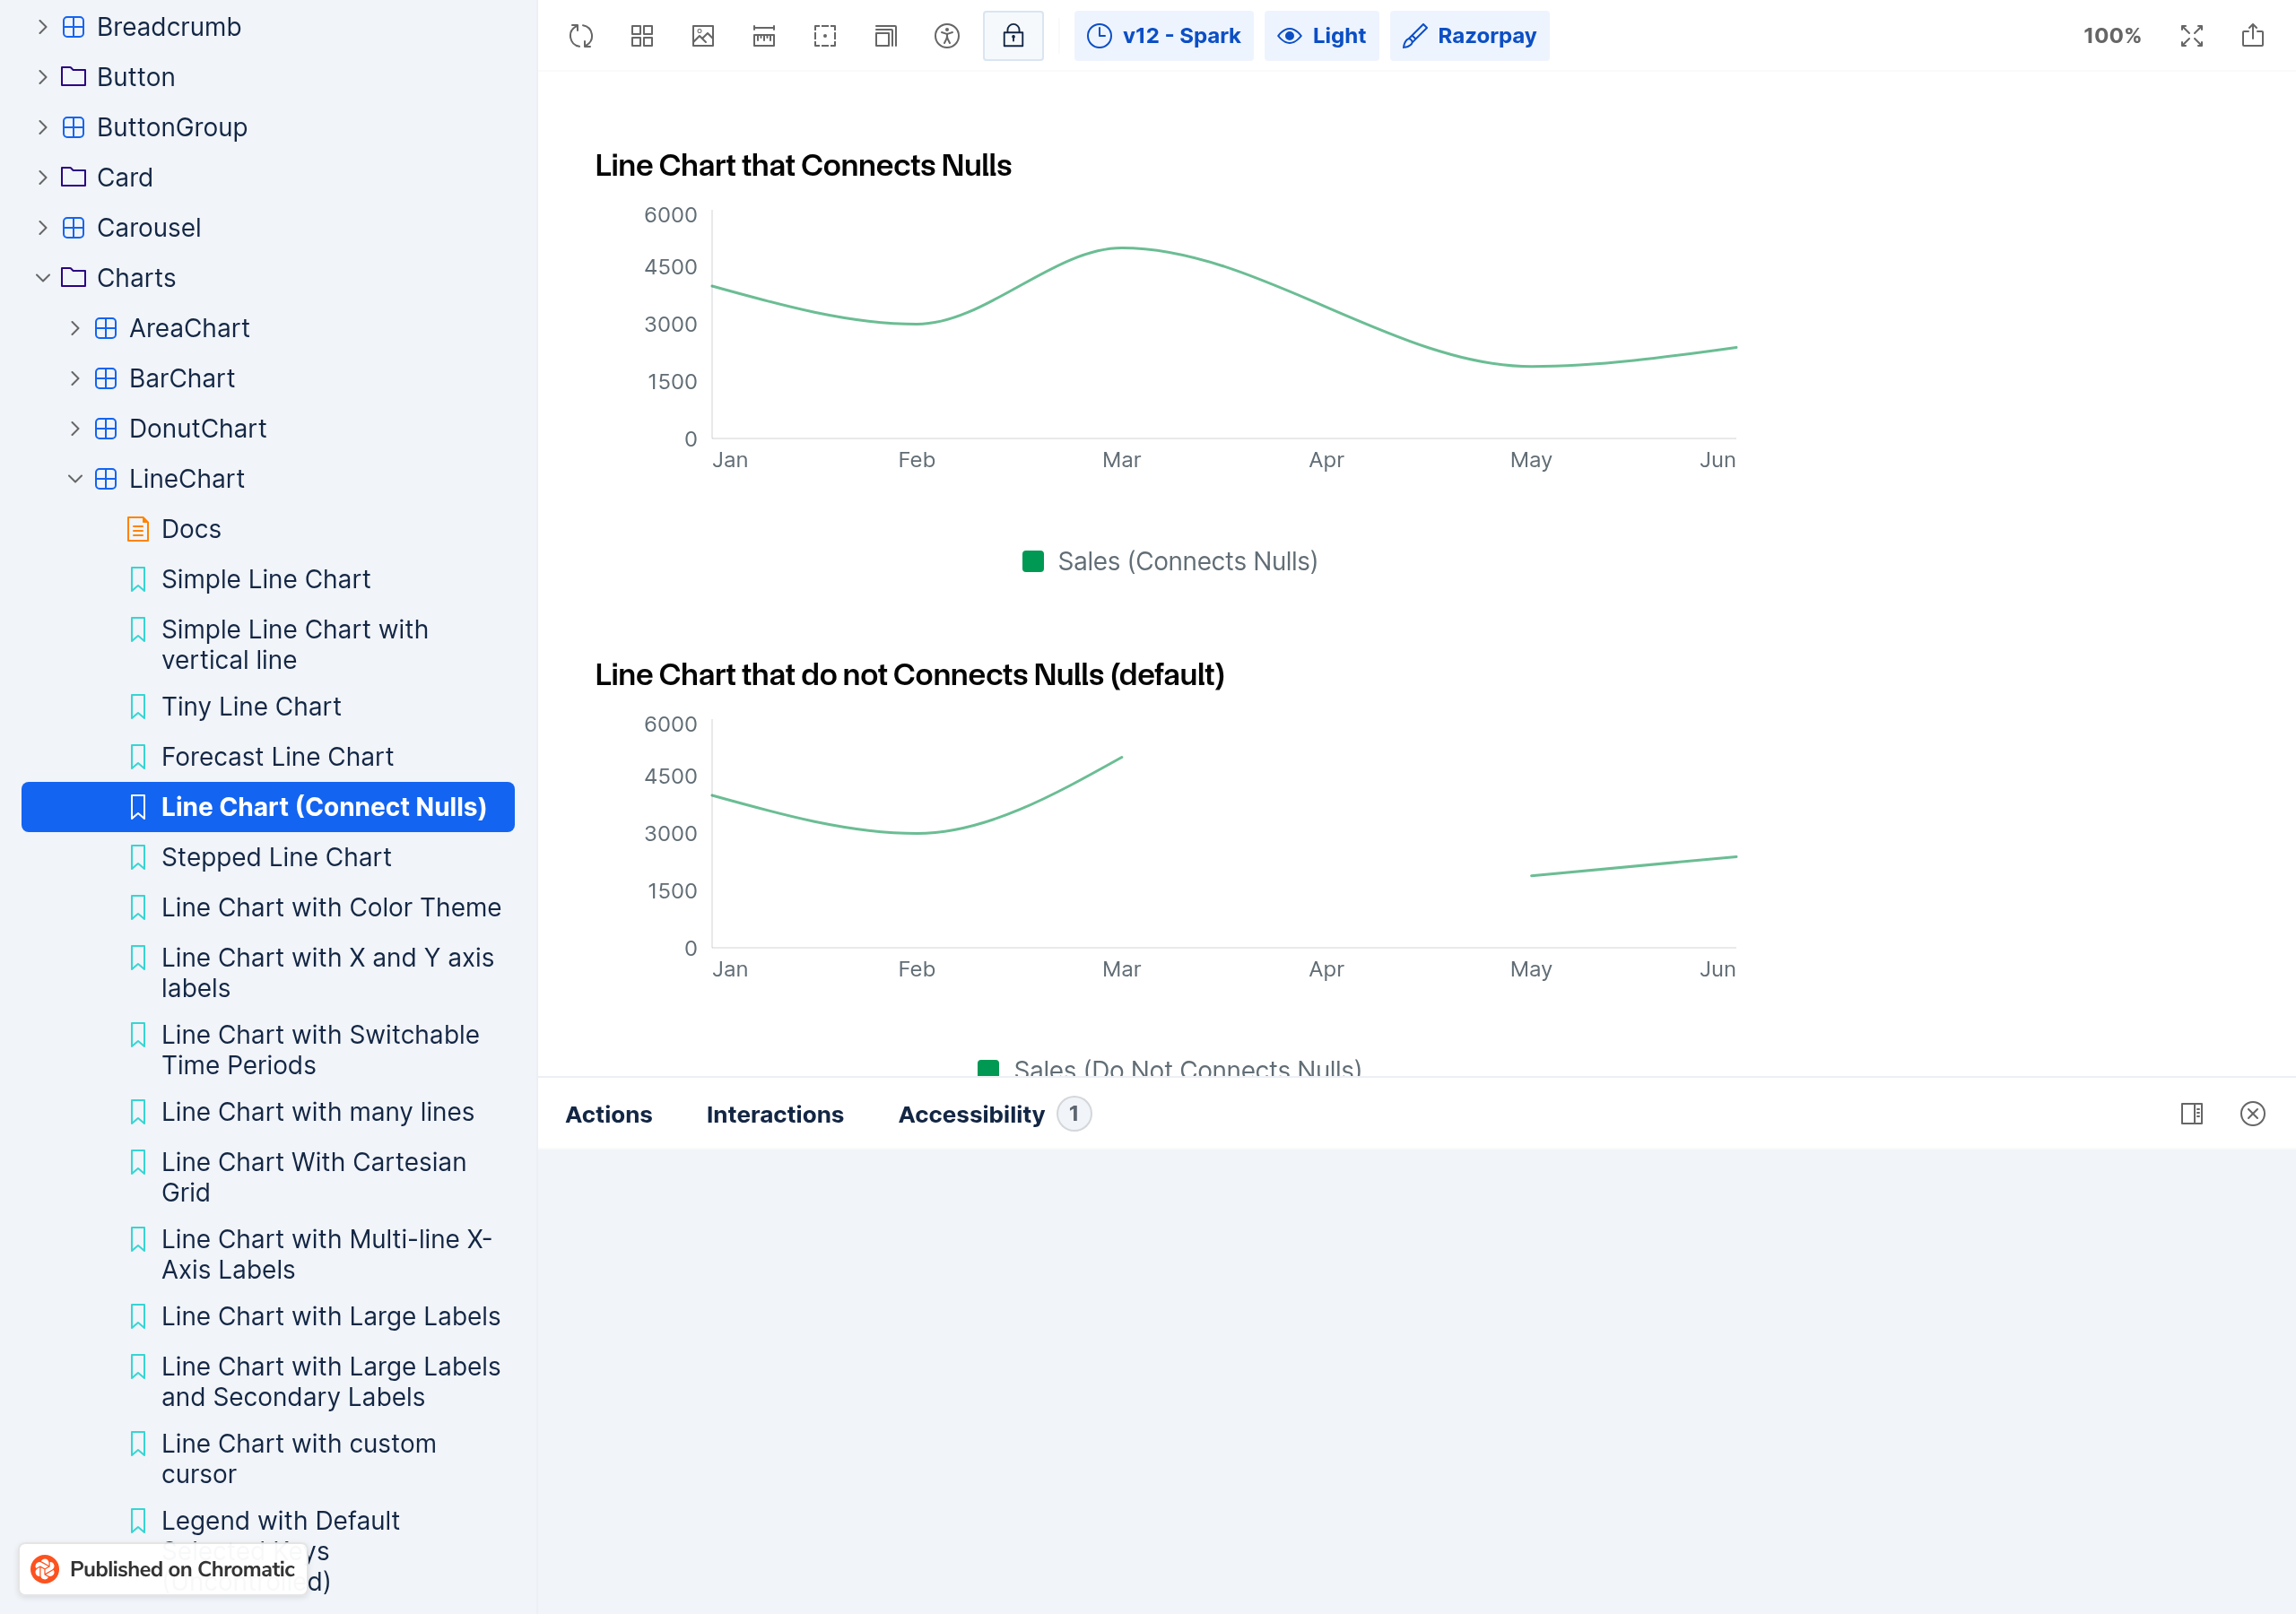
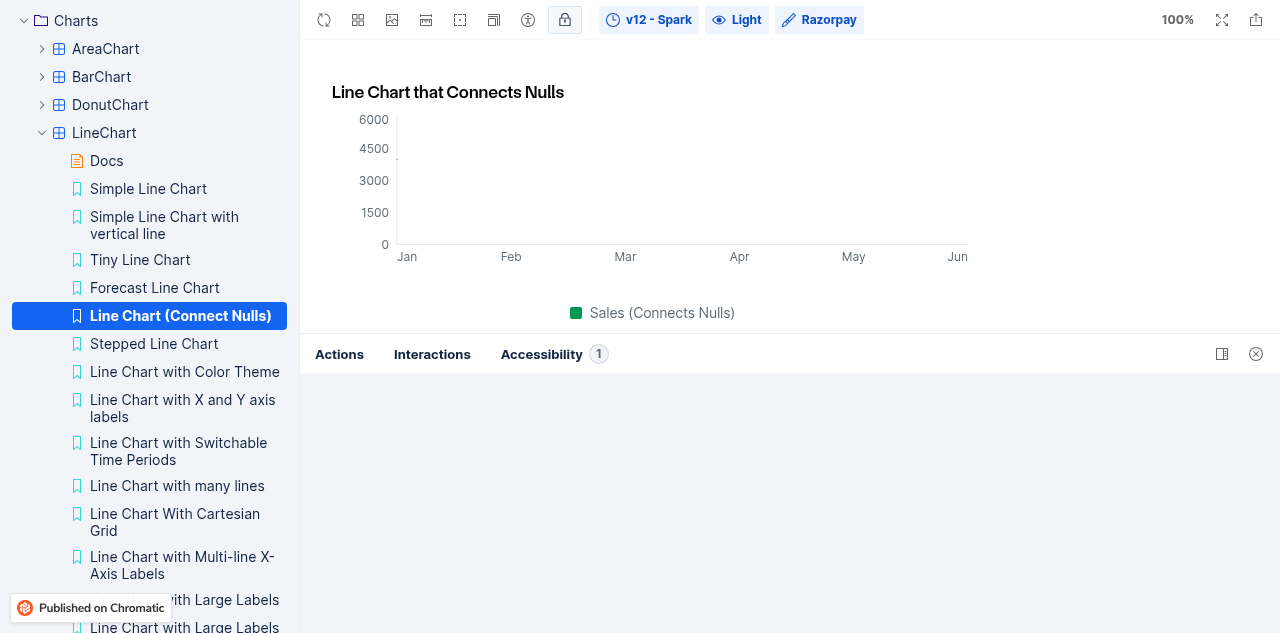
| ✅ LineChart LineChartConnectNulls |  |
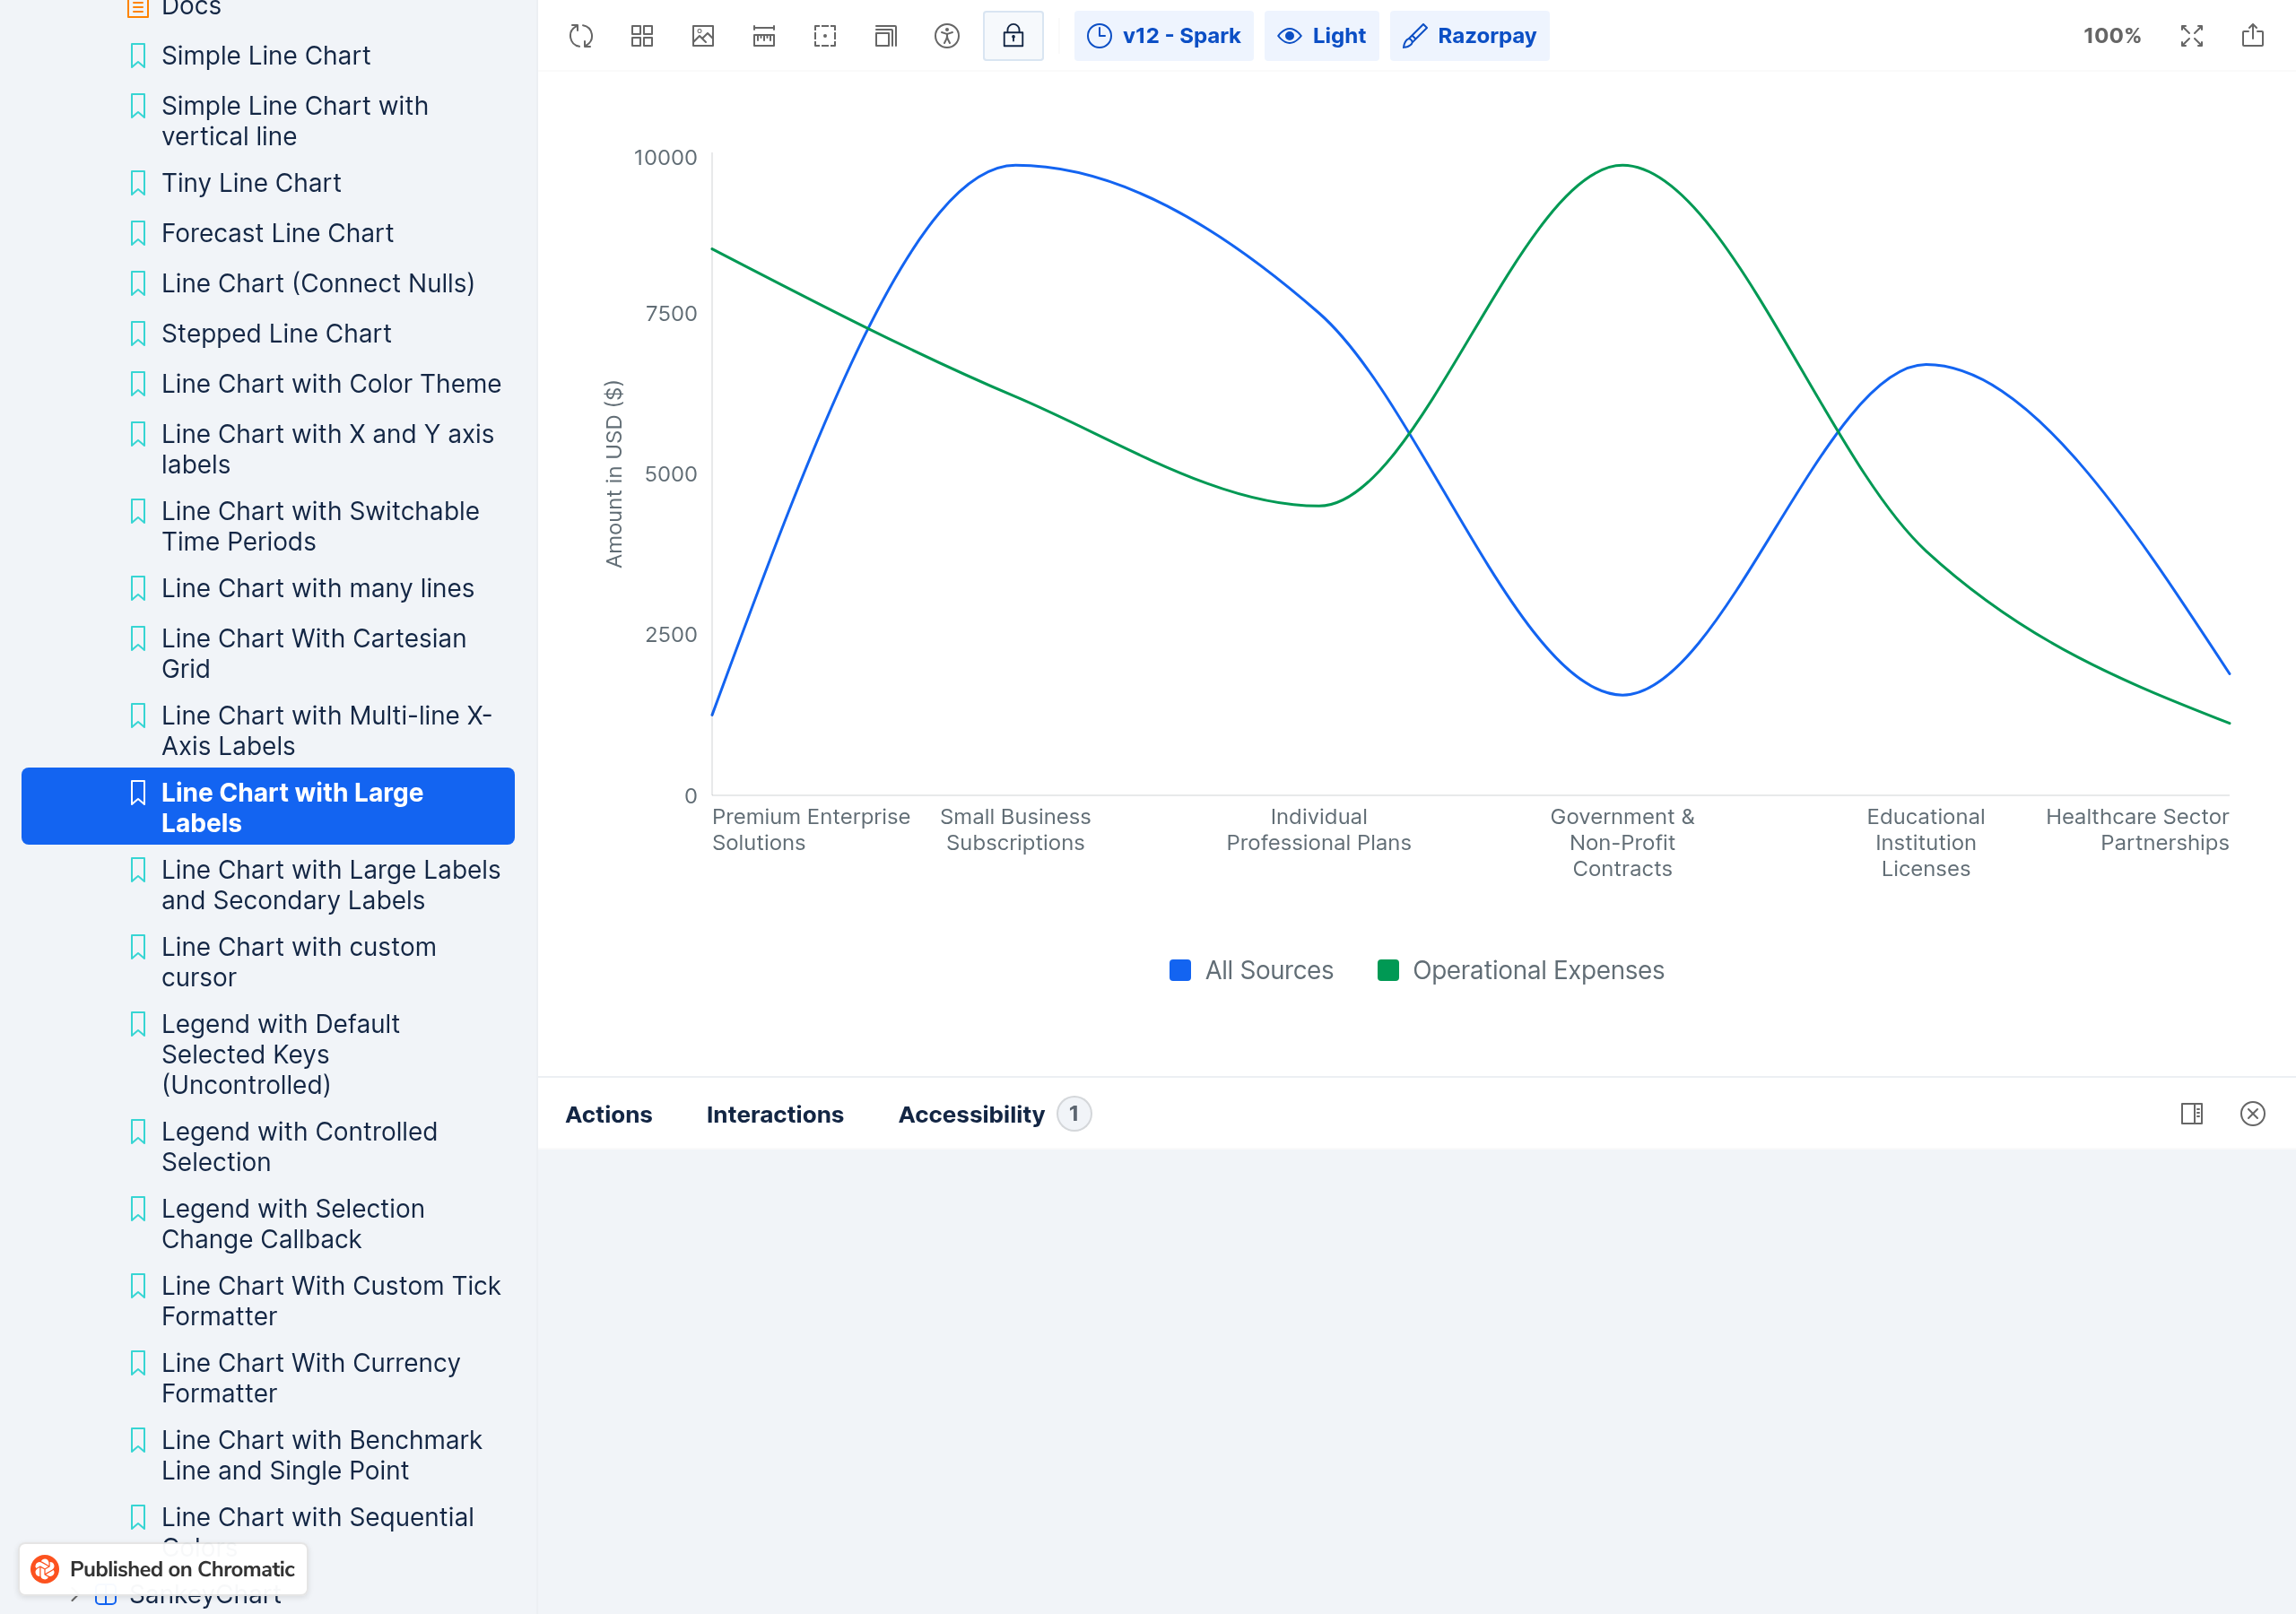
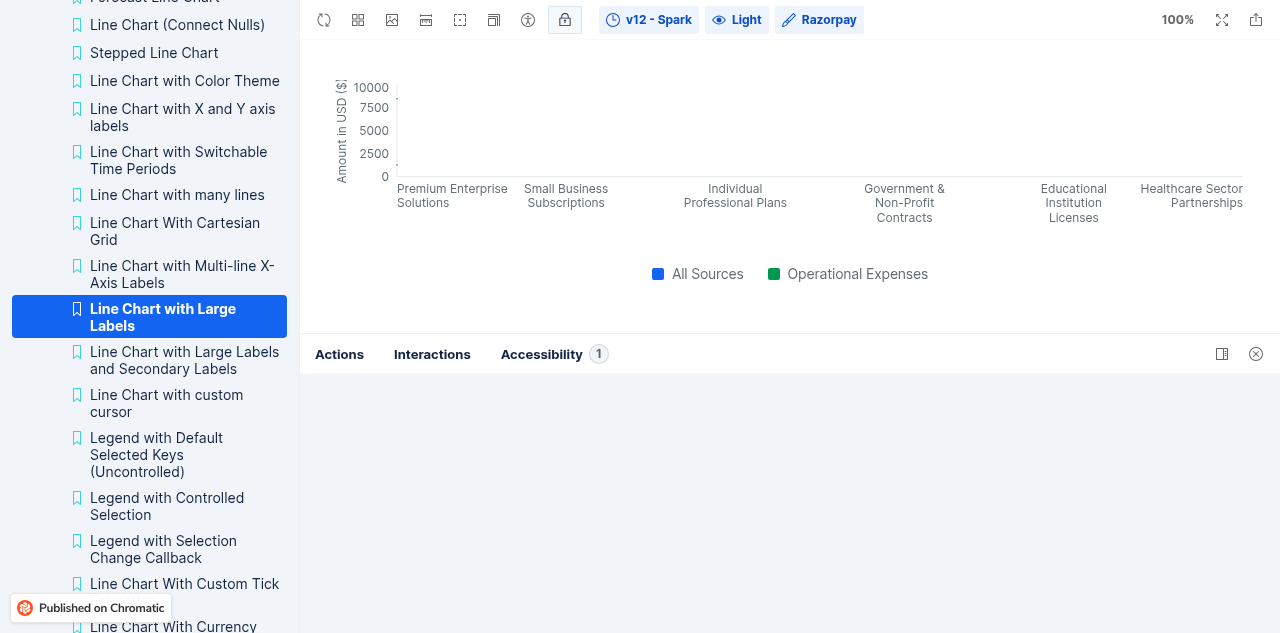
| ✅ LineChart LineChartWithLargeLabels |  |
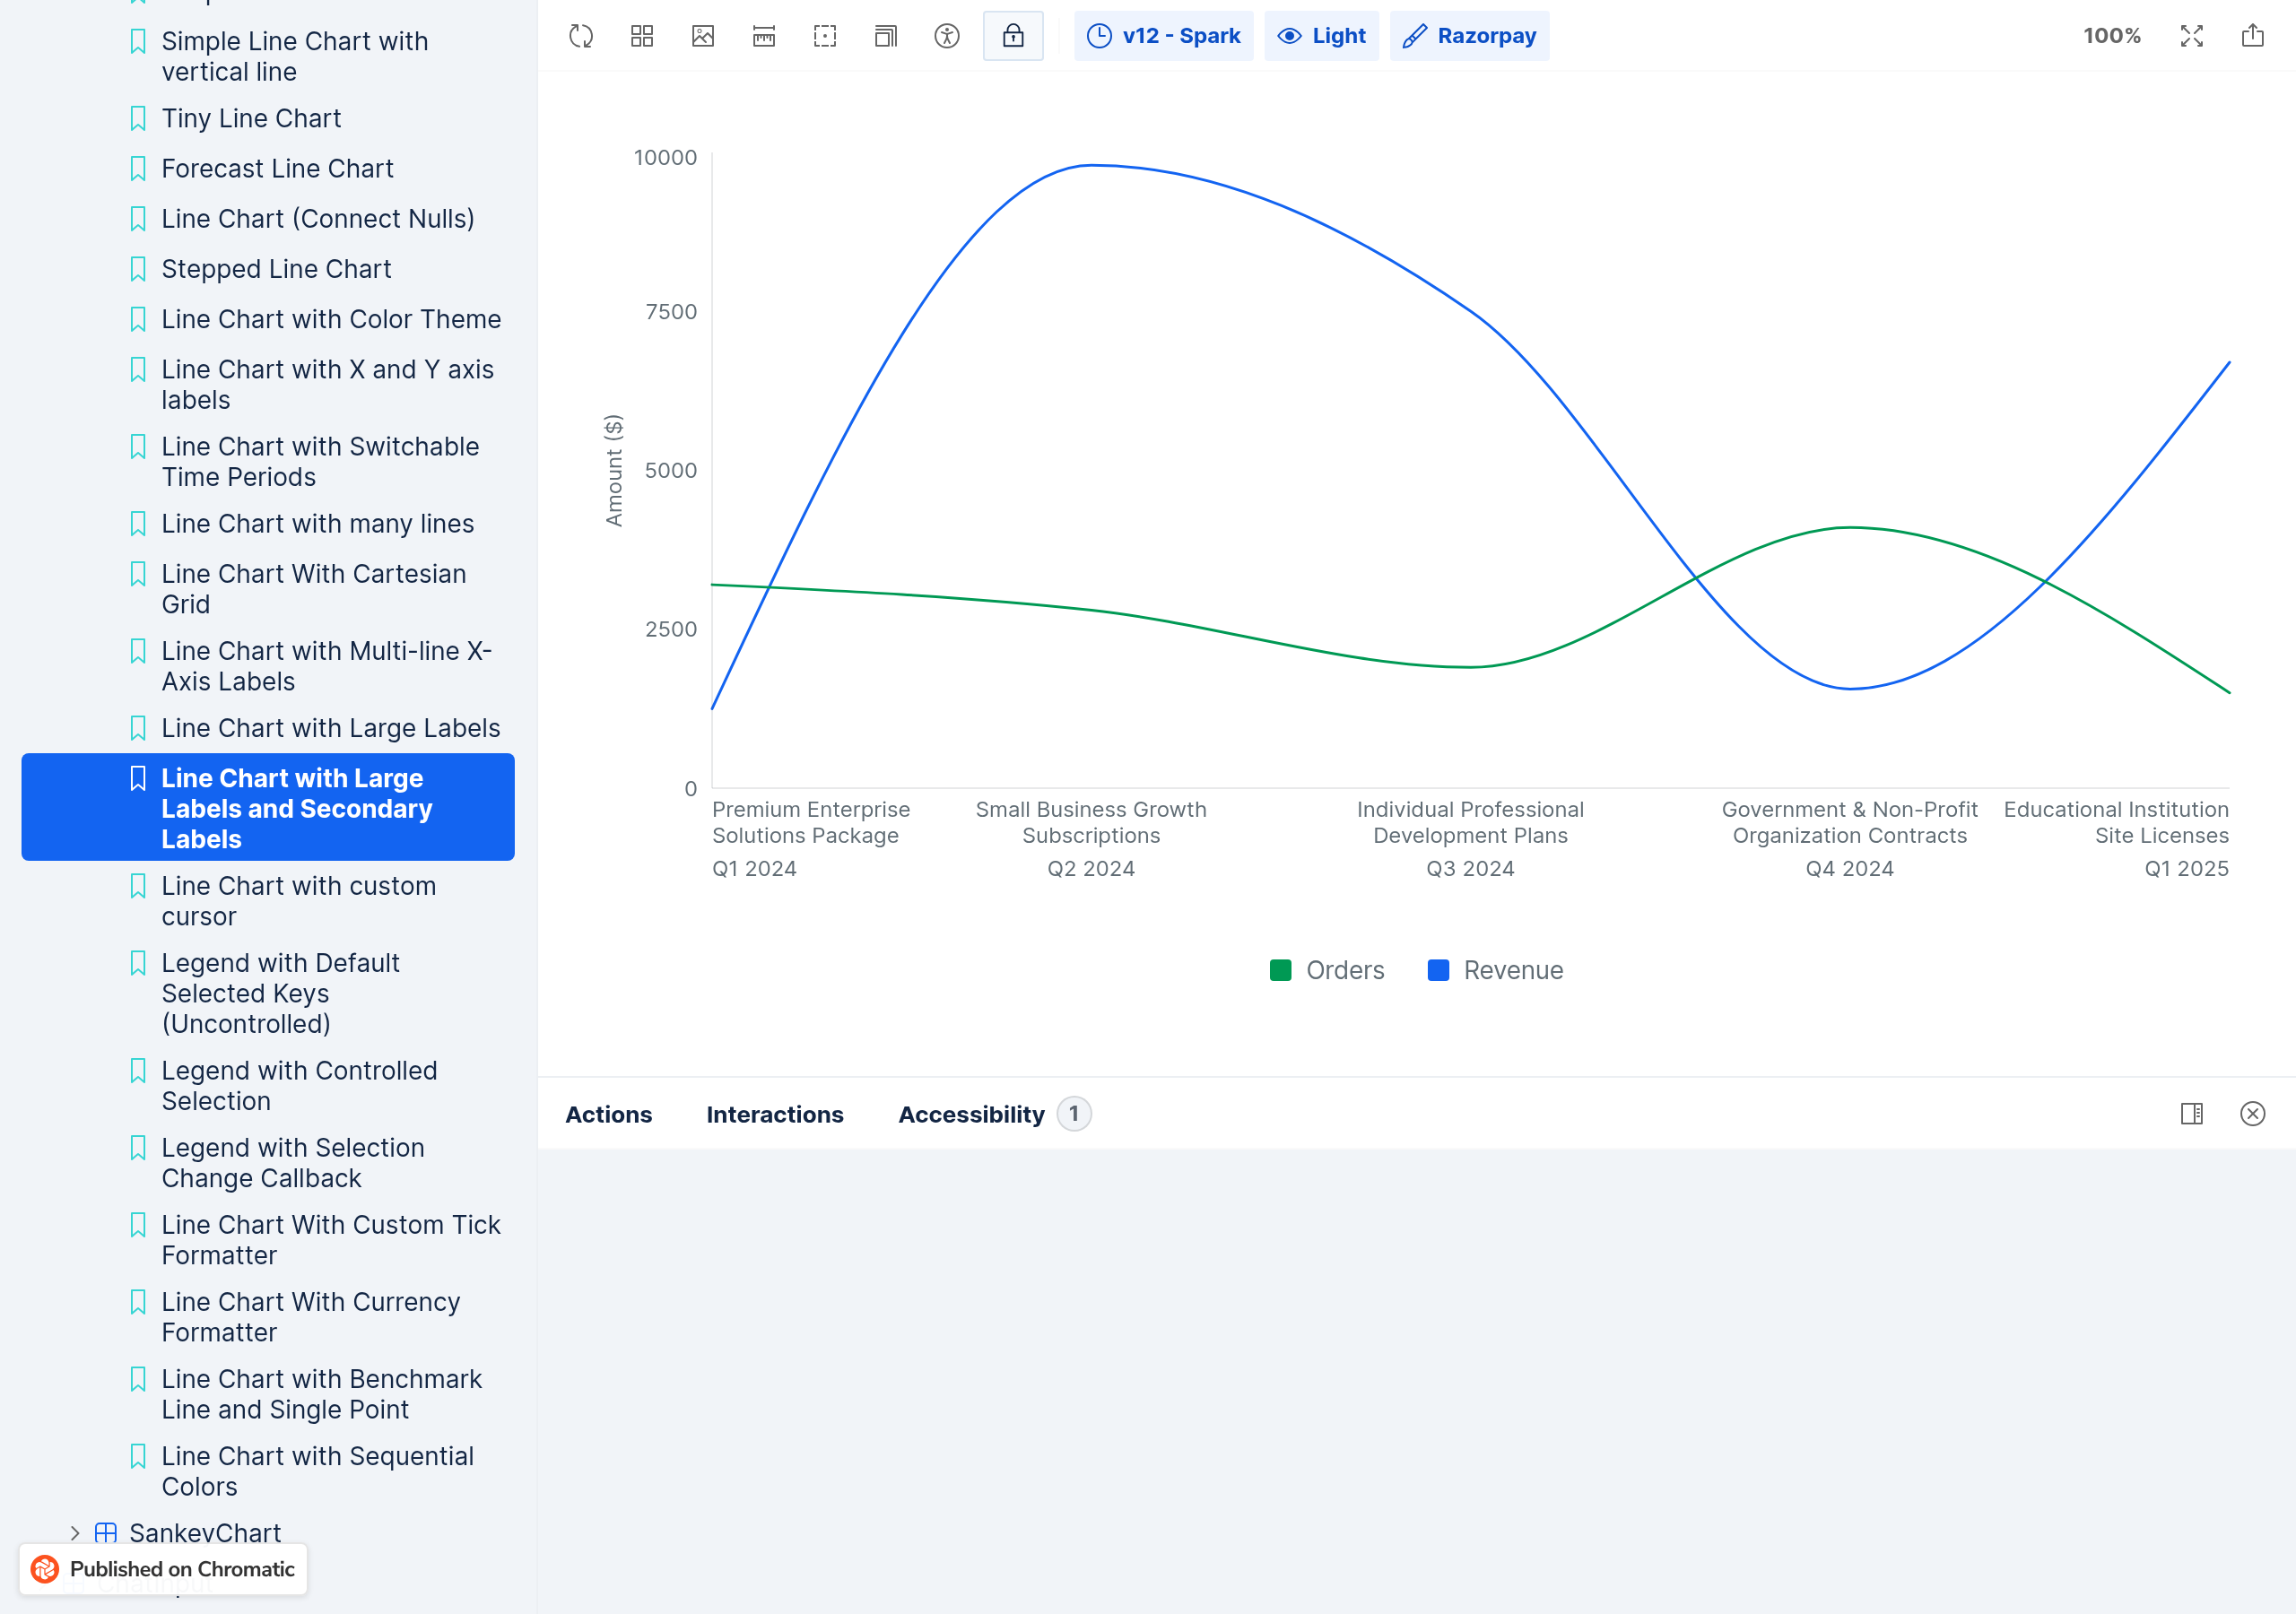
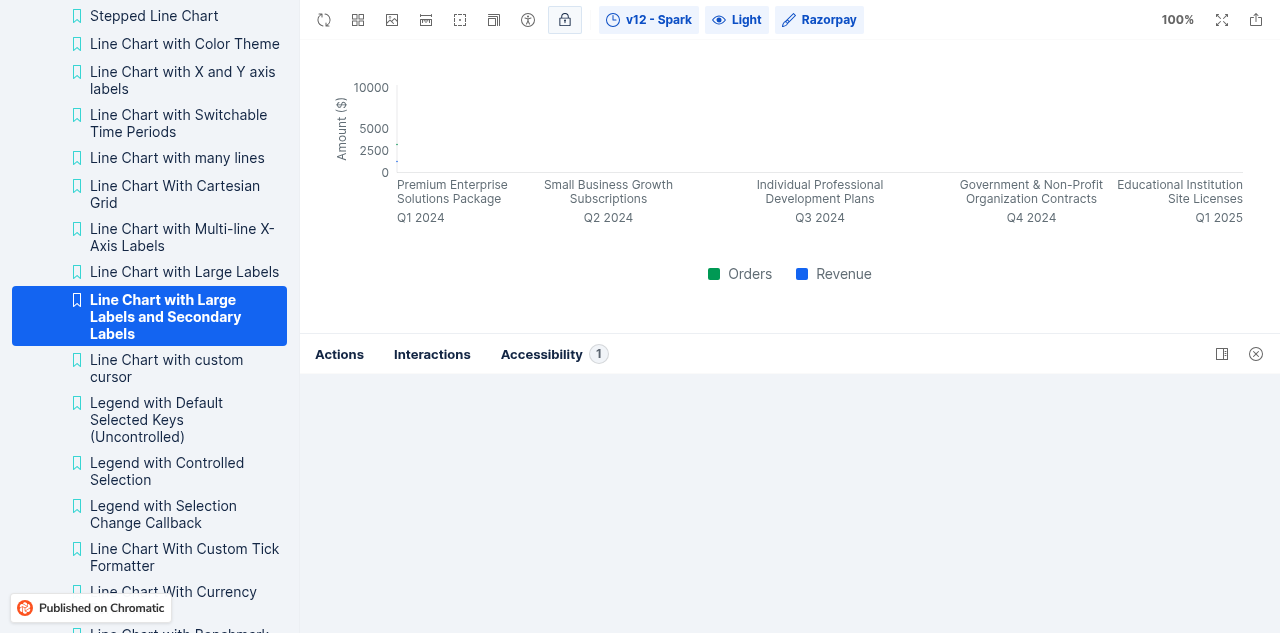
| ✅ LineChart LineChartWithLargeLabelsAndSecondary |  |
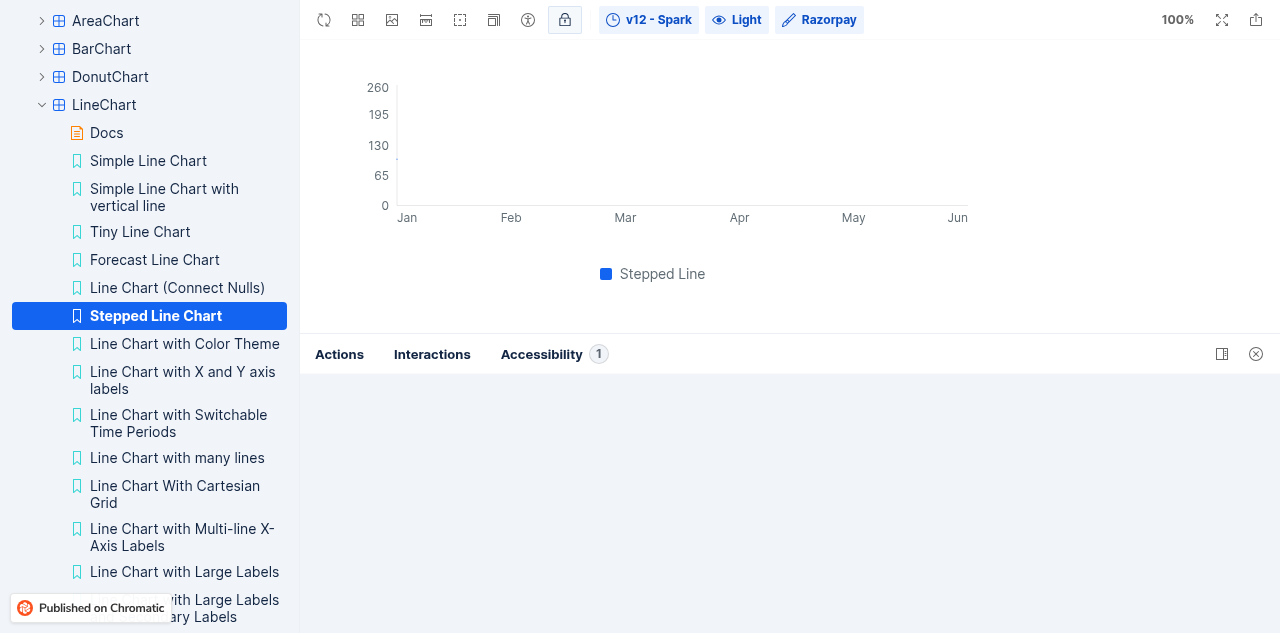
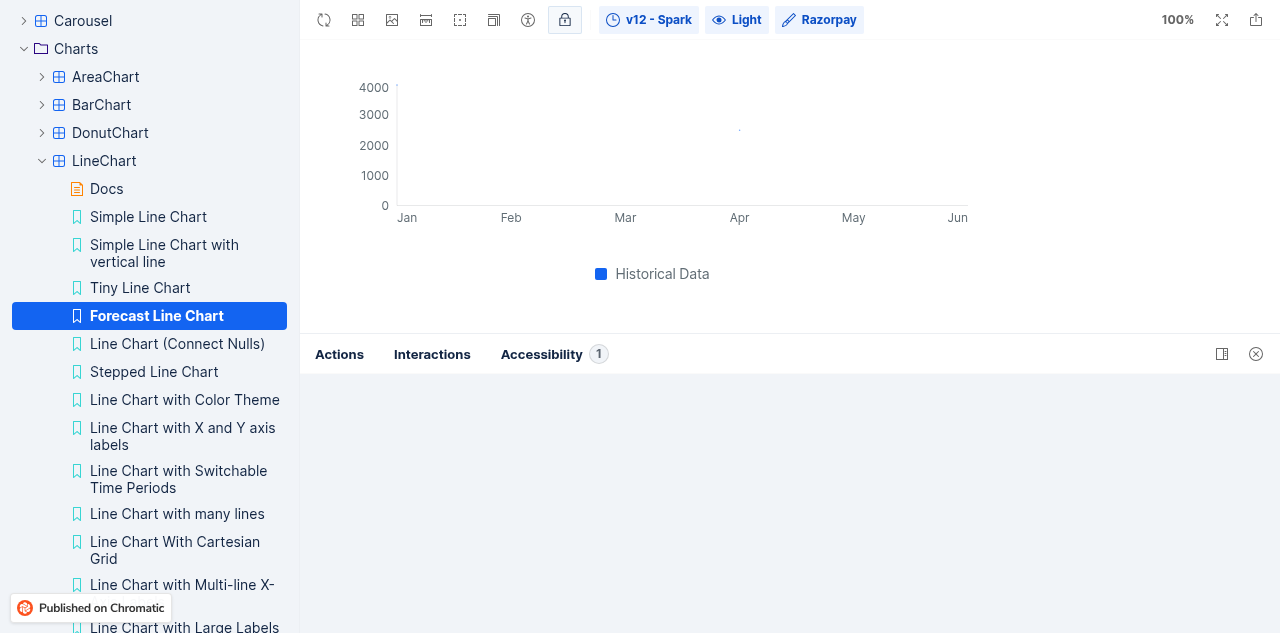
| ✅ LineChart ForecastLineChart | 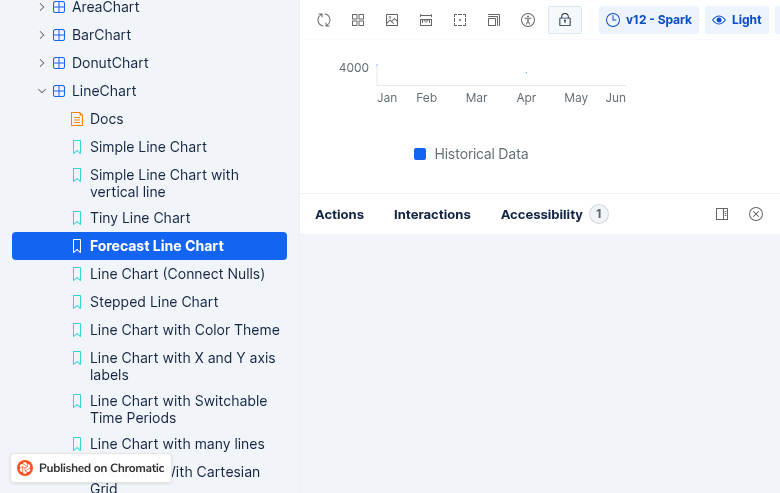 |
Usage
import { ChartLineWrapper, ChartLine, ChartXAxis, ChartYAxis, ChartTooltip, ChartLegend, ChartReferenceLine, ChartCartesianGrid } from '@razorpay/blade/components';

<ChartLineWrapper data={salesData} colorTheme="categorical" testID="line-chart">
  <ChartCartesianGrid />
  <ChartXAxis dataKey="month" />
  <ChartYAxis />
  <ChartTooltip />
  <ChartLegend />
  <ChartReferenceLine y={4000} label="Target" />
  <ChartLine dataKey="sales" name="Sales" type="monotone" strokeStyle="solid" />
  <ChartLine dataKey="profit" name="Profit" connectNulls />
</ChartLineWrapper>…l blocking - Fix buildStepPath: 'step' type now uses midpoint stepping (d3 curveStep) instead of being treated identically to 'stepAfter' - Fix touch responder: remove onStartShouldSetResponder that blocked vertical scrolling in parent ScrollViews; follow AreaChart.native.tsx pattern with onMoveShouldSetResponder horizontal threshold + onTouchStart/onTouchEnd - Update tests to use touchStart/touchEnd for tap interactions - Update snapshots for new View prop structure Co-authored-by: admin <admin>
|
(Review Cancelled - Superseded by a new run) |
…tance conflicts [resolved by agent]

Co-authored-by: admin <admin>
|
🤖 Slash AI Review has been triggered. View execution logs |
|
(Review Cancelled - Superseded by a new run) |
CI Run Tests failed after the clip-path ID fix removed LineChart.native.test.tsx.snap; regenerate the 12 native snapshots.

Co-authored-by: Cursor <cursoragent@cursor.com>
|
(Review Cancelled - Superseded by a new run) |
There was a problem hiding this comment.
✨ Agentic PR Review ✨
UI Review
✅ 10 passed · ❌ 7 failed
| Check | Problem | Screenshot |
|---|---|---|
| LineChartWithManyLines (Legend alignment) | Legend align prop is ignored — legend is always centered. If a user sets align='left' or align='right' on ChartLegend, it has no effect on native. AreaChart.native.tsx correctly handles this prop. Suggestion: Add the same justifyContent logic as AreaChart: justifyContent: slots.legend.align === 'left' ? 'flex-start' : slots.legend.align === 'right' ? 'flex-end' : 'center' |
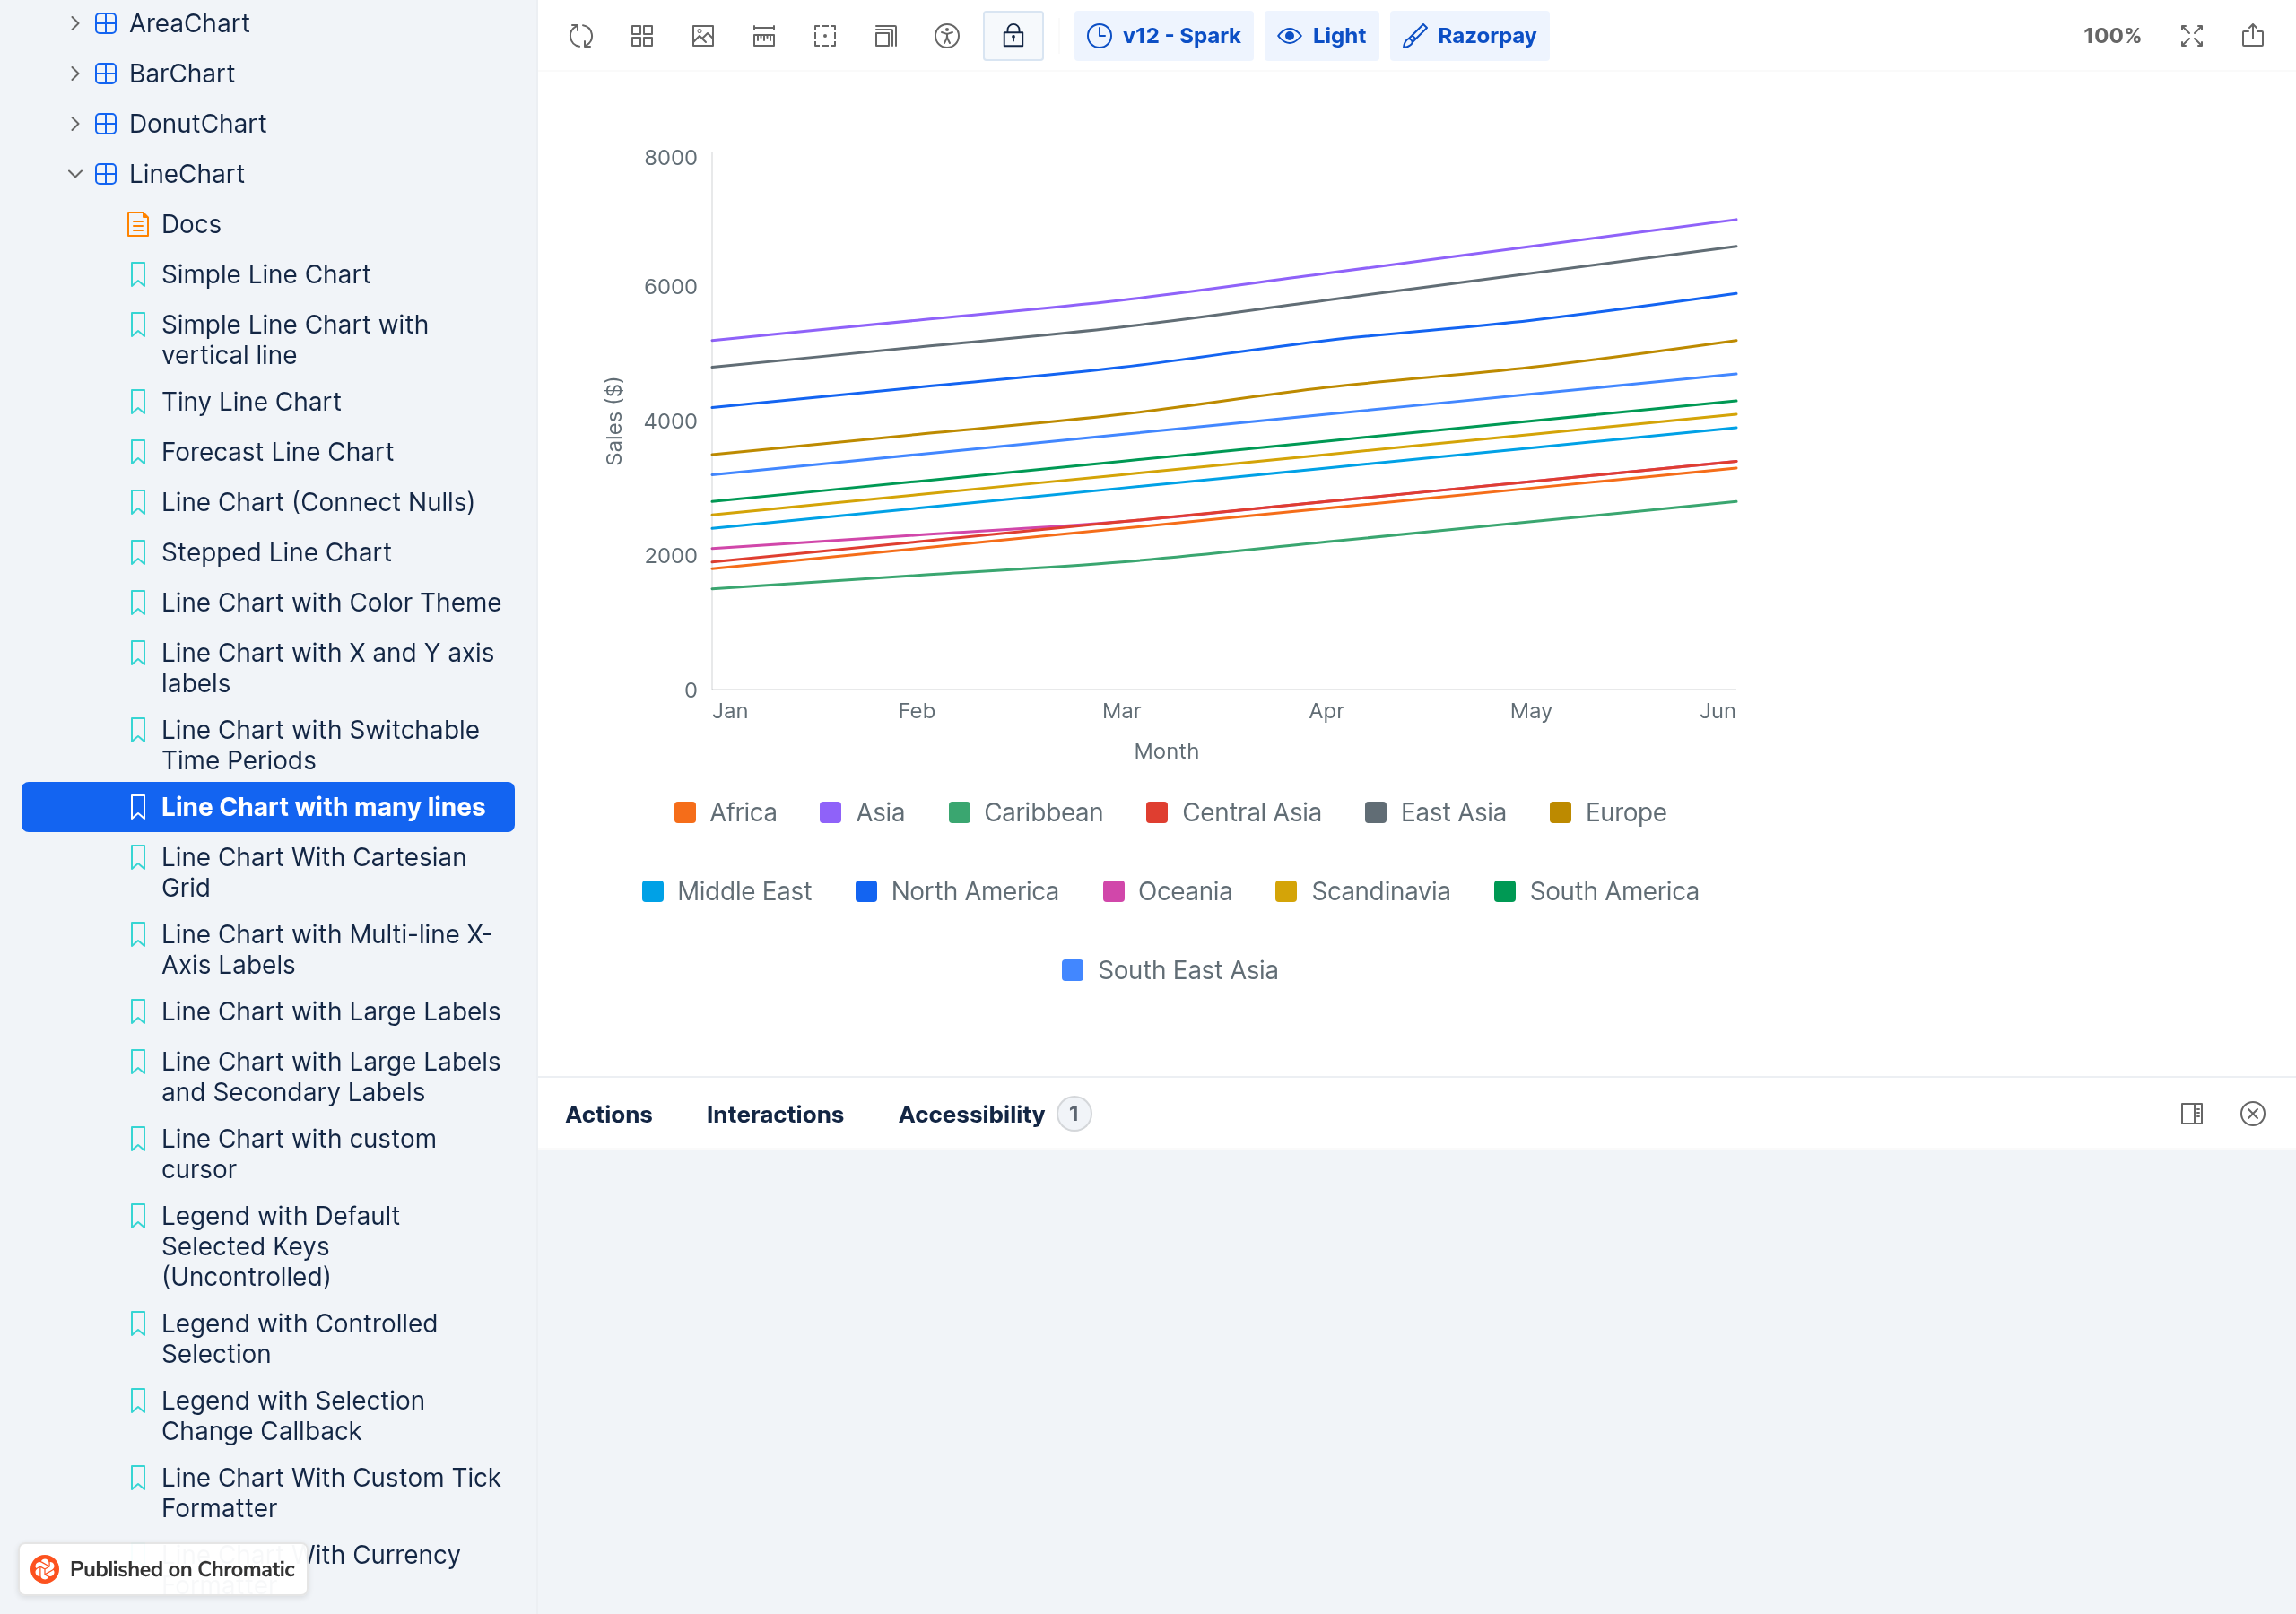 |
| LineChartWithManyLines (Legend vertical layout) | Vertical legend layout uses flexWrap: 'wrap' and alignItems: 'center' instead of flexWrap: 'nowrap' and alignItems: 'flex-start'. On narrow screens, vertical legend items may wrap into multiple columns unexpectedly. Suggestion: Apply conditional logic like AreaChart: flexWrap: slots.legend.layout === 'vertical' ? 'nowrap' : 'wrap' and alignItems: slots.legend.layout === 'vertical' ? 'flex-start' : 'center' |
|
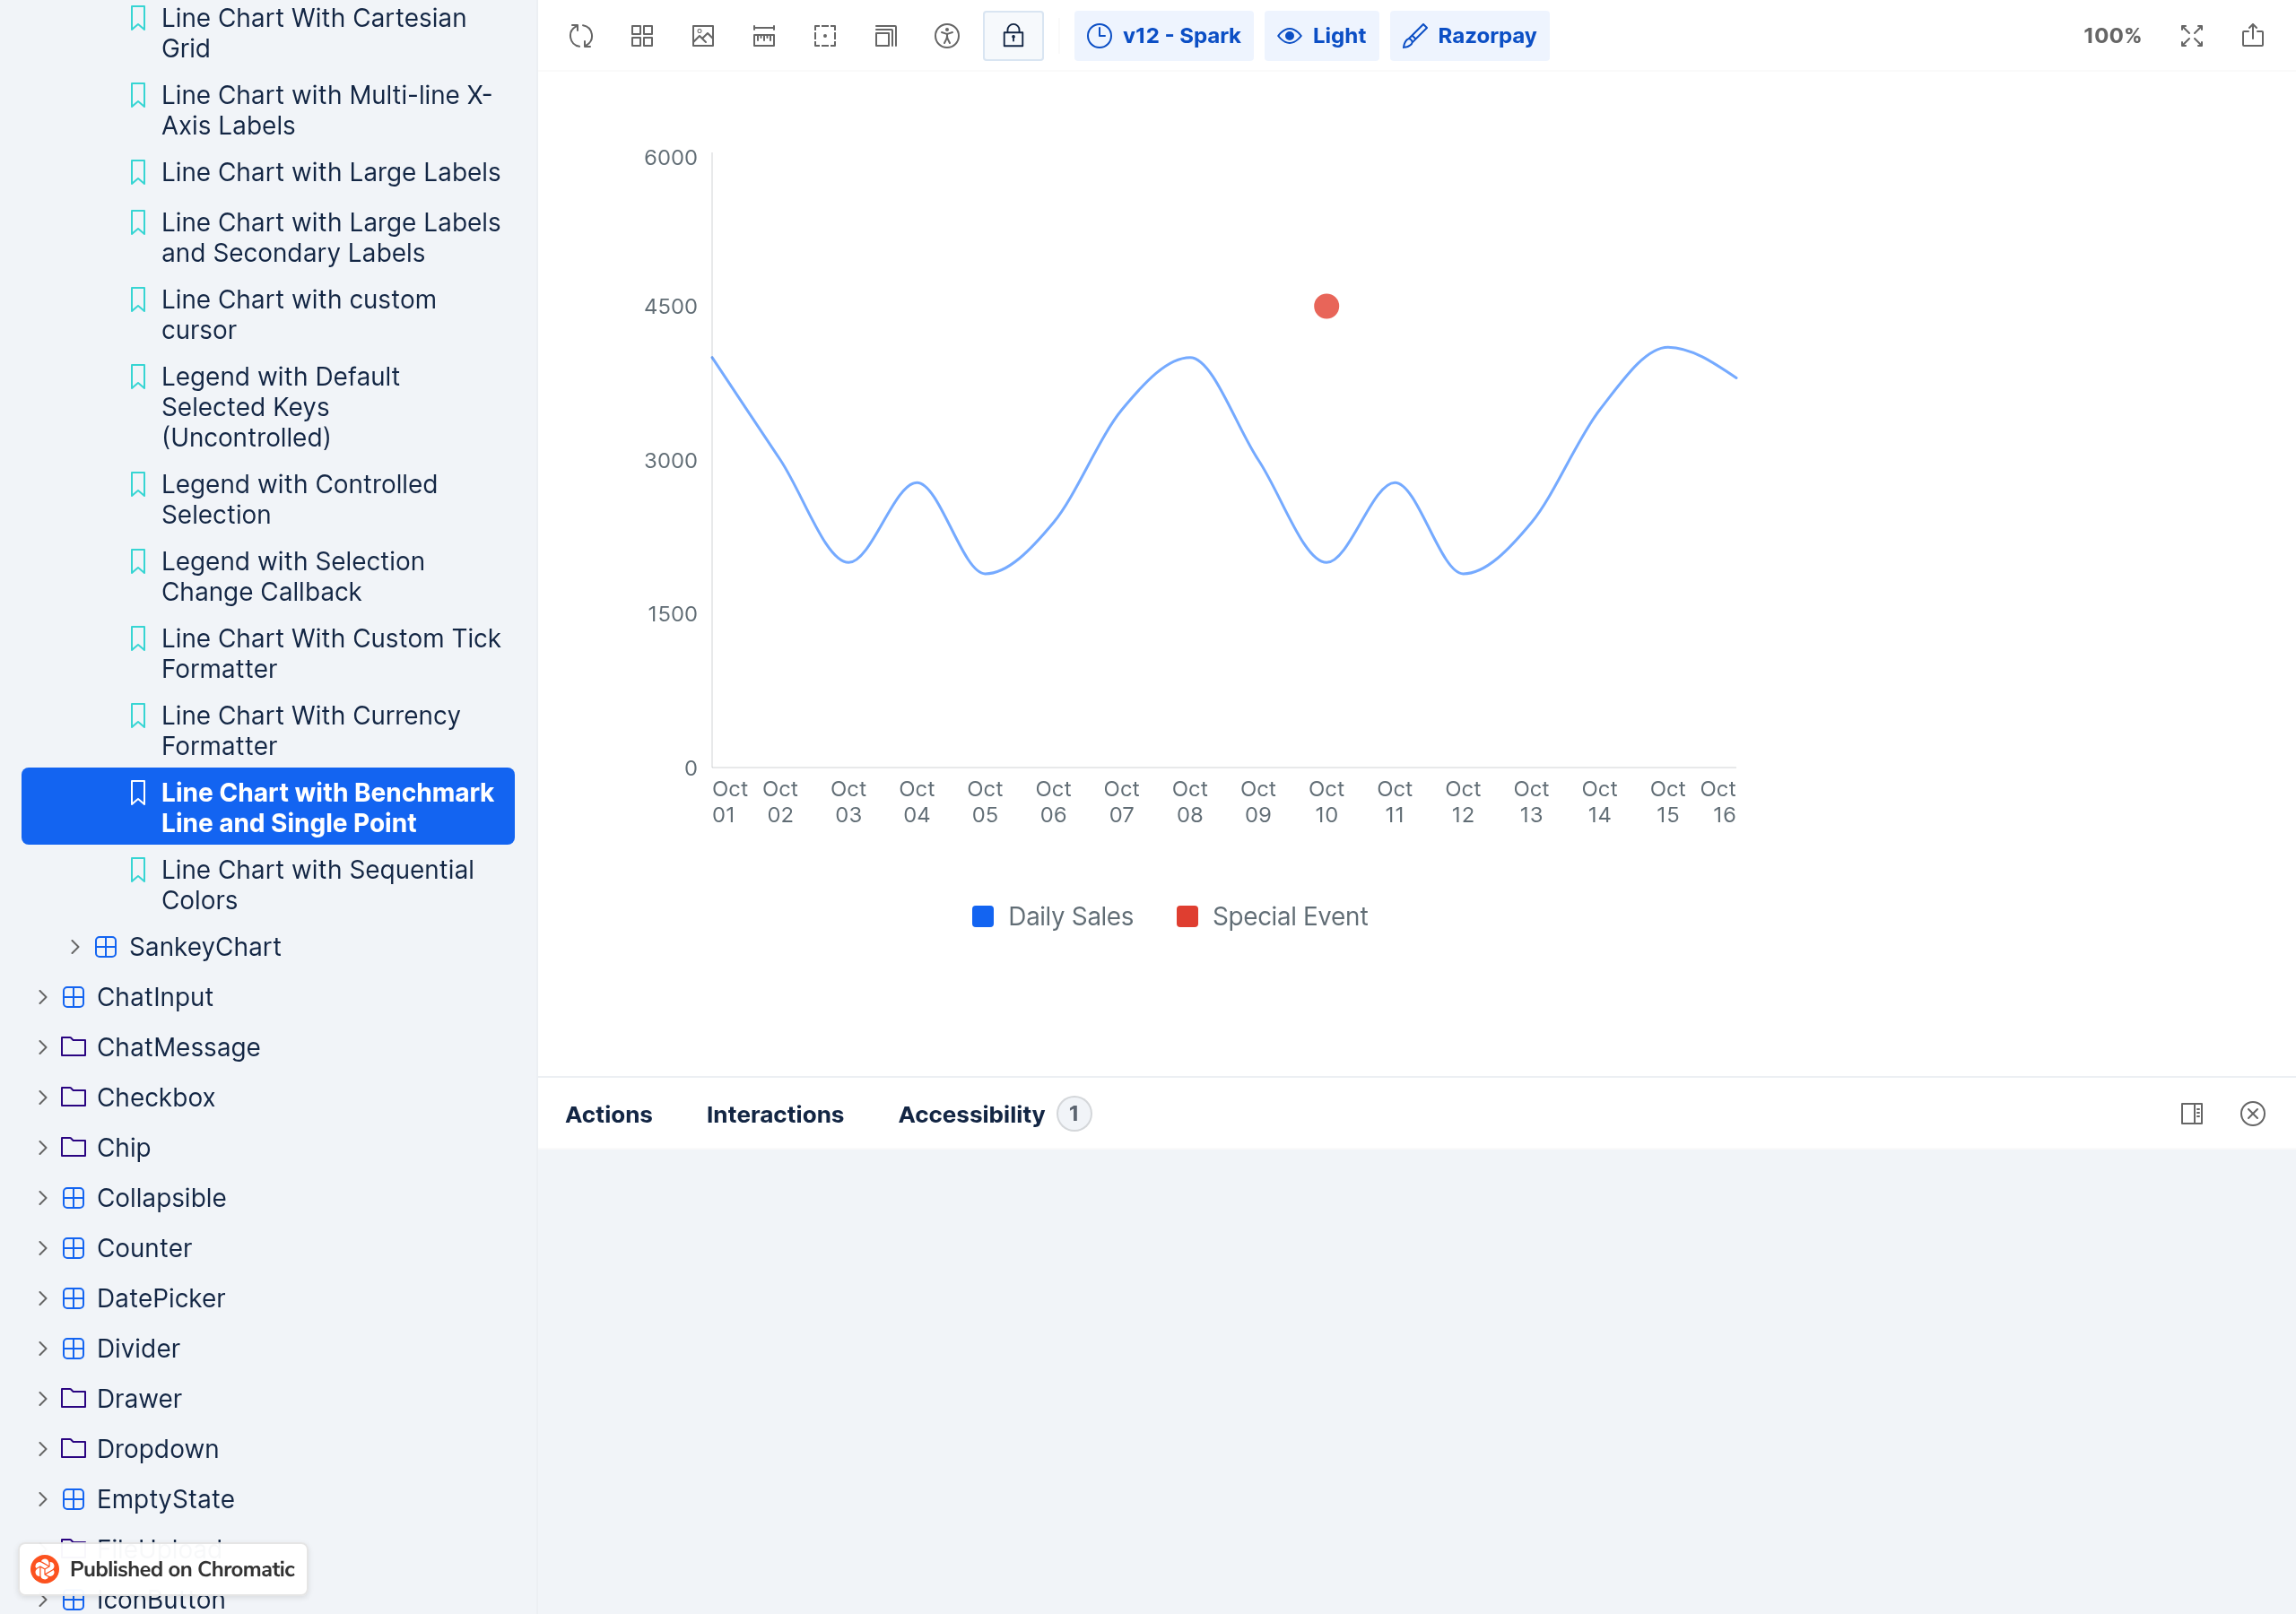
| LineChartWithBenchmarkAndSinglePoint (Reference Line - Vertical) | Vertical reference line label chip is not clamped to plot bounds. When the reference line is at the first or last data point, the chip will overflow off the edge of the SVG, becoming clipped or invisible. Suggestion: Clamp the chip x position like AreaChart: use x={Math.max(0, Math.min(x - chipWidth / 2, plotWidth - chipWidth))} for the Rect, and adjust the SvgText x to match. |
 |
| Reference Line Label Truncation | Reference line labels have no max width cap. A long label will create a chip wider than the entire chart, overflowing the SVG. Suggestion: Add a REF_LABEL_MAX_WIDTH constant (e.g., 200) and truncate long labels with ellipsis, matching AreaChart's approach. |
|
| Reference Line Chip Height Consistency | Reference line label chip height is 20px in LineChart but 30px in AreaChart. Visual inconsistency when both chart types are used together. Suggestion: Use chipHeight=30 to match AreaChart for visual consistency across chart types. |
|
| Legend Accessibility | Legend items lack accessibility props. No accessibilityRole or accessibilityLabel is set, so screen reader users cannot interact with or understand the legend toggle buttons. Suggestion: Add accessibilityRole="button" and accessibilityLabel with selection state to each legend Pressable, matching AreaChart. |
|
| CI: Snapshot Tests | 12 snapshot tests are failing in CI. The snapshots need to be updated to match the new LineChart.native.tsx output. Suggestion: Run yarn test:react-native -u to update the snapshots, then commit the updated snapshot files. |
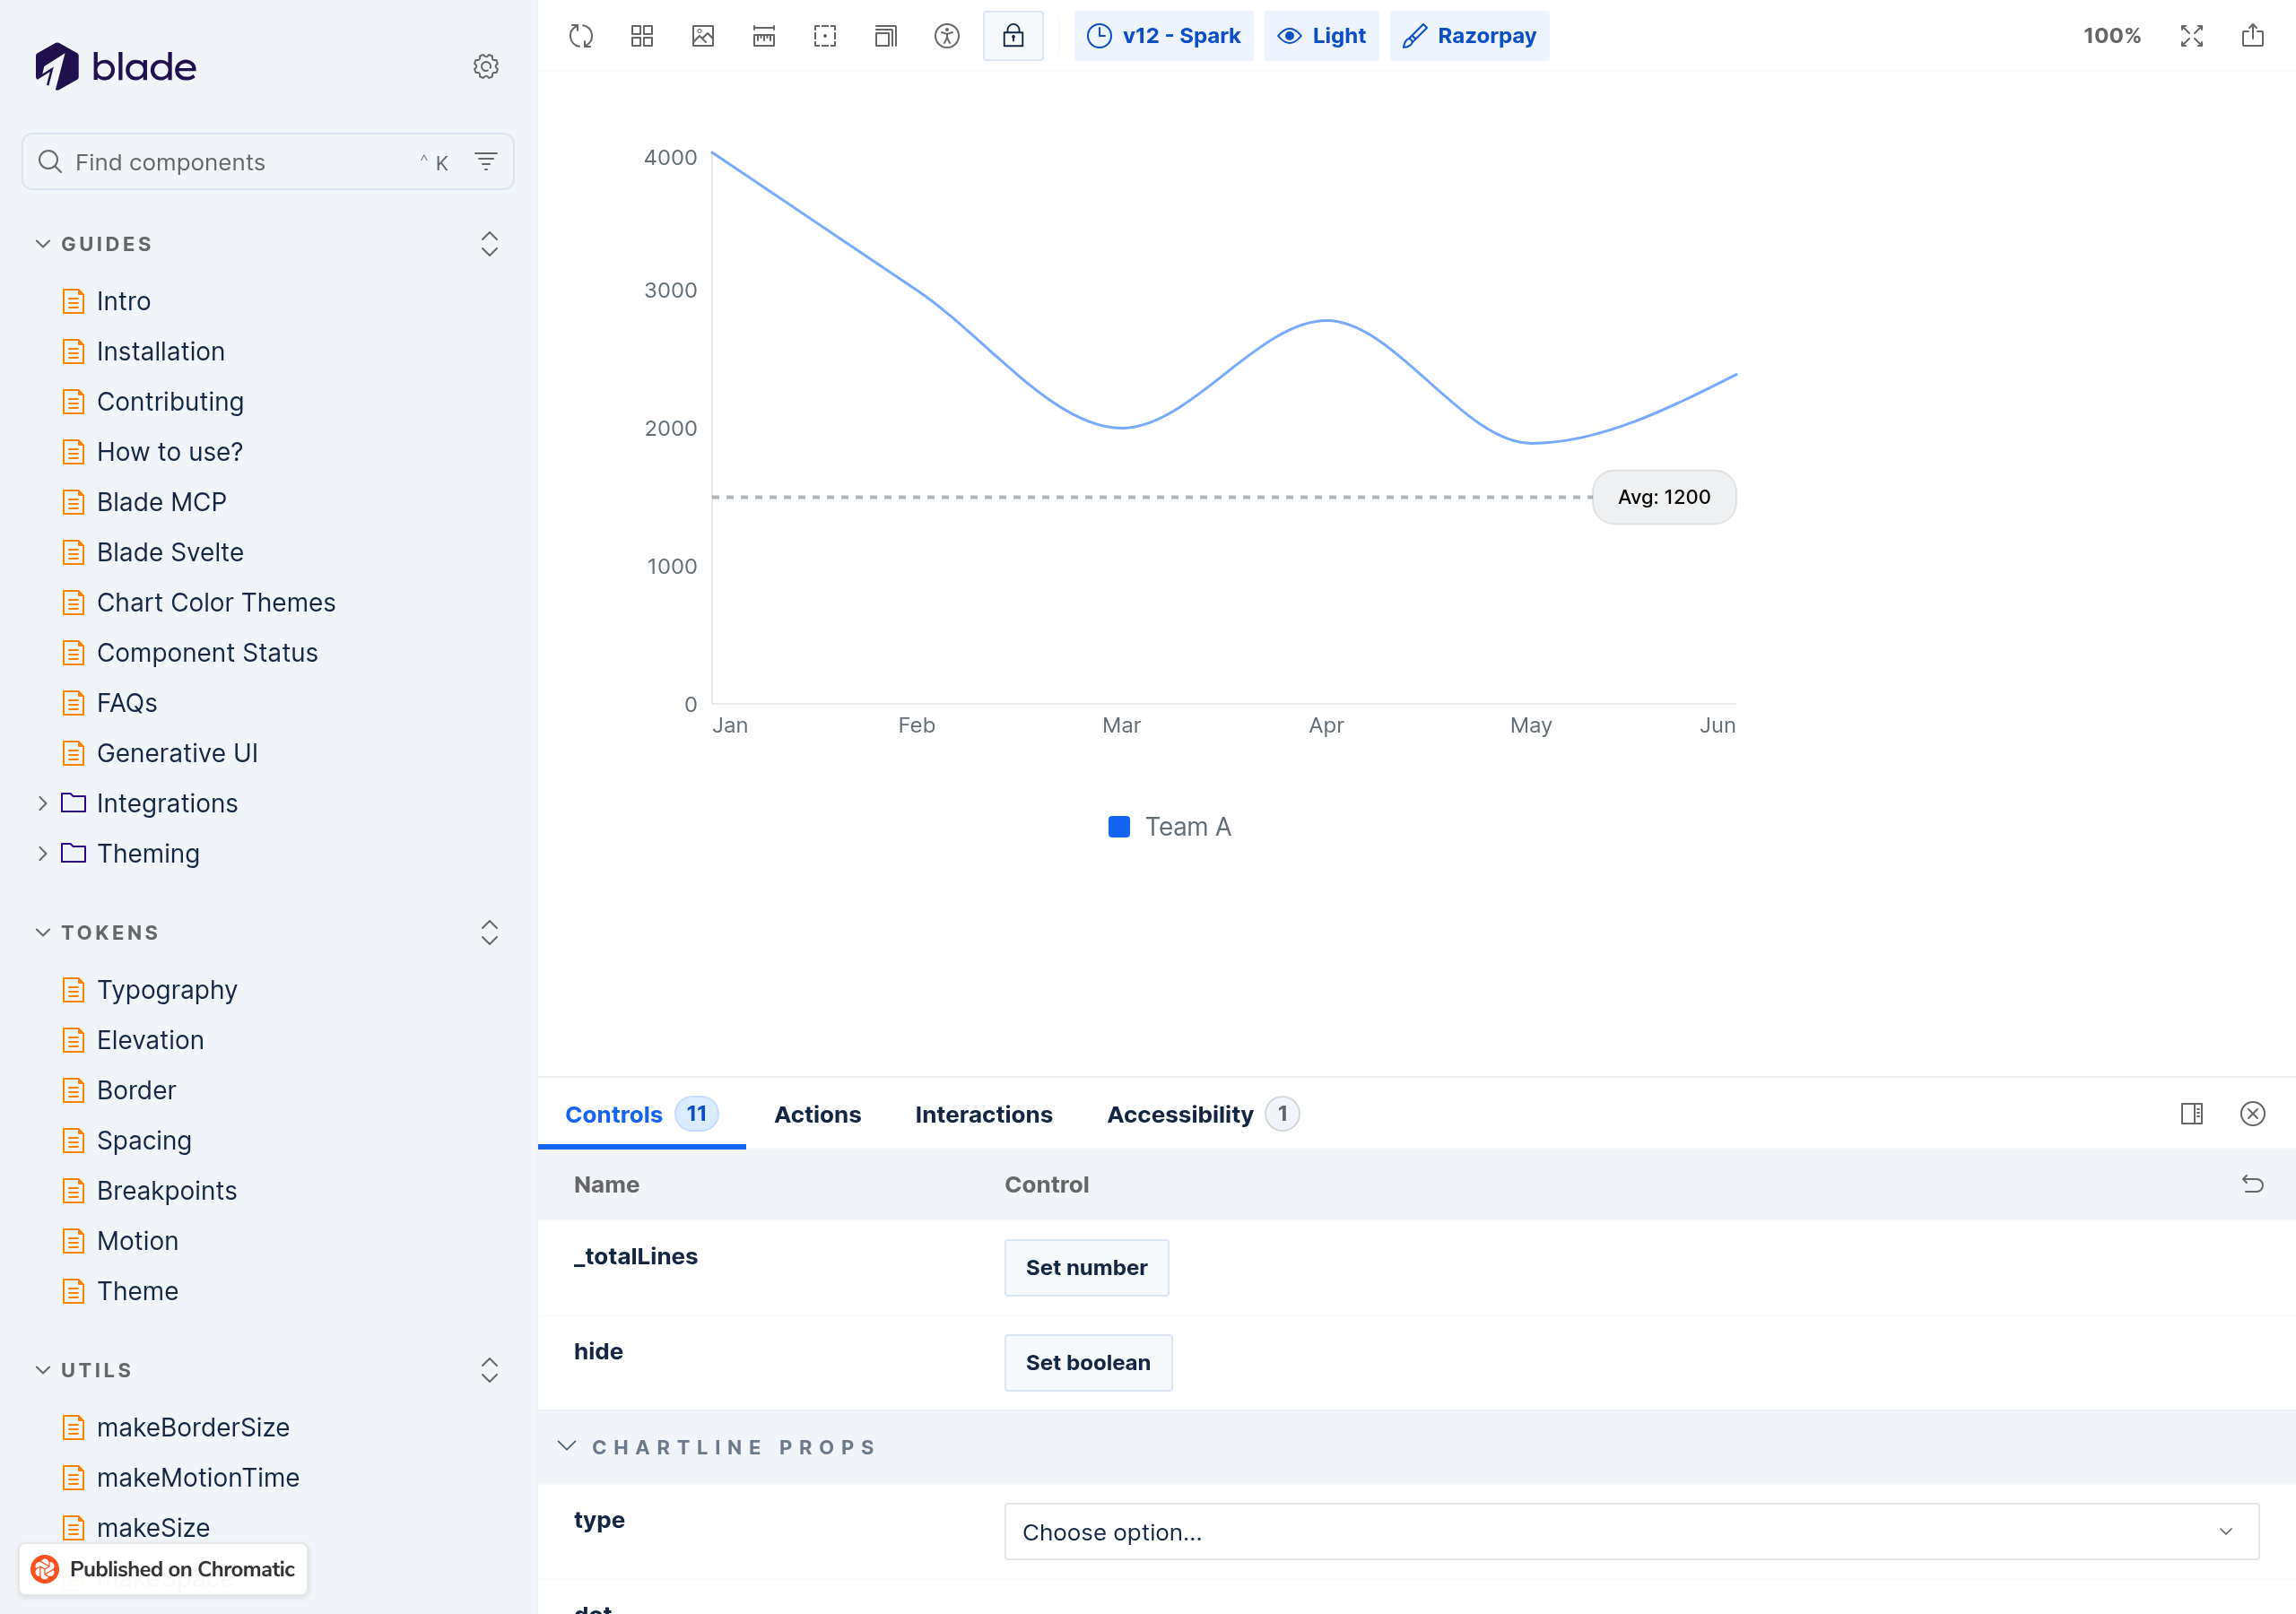
Passing checks (10)
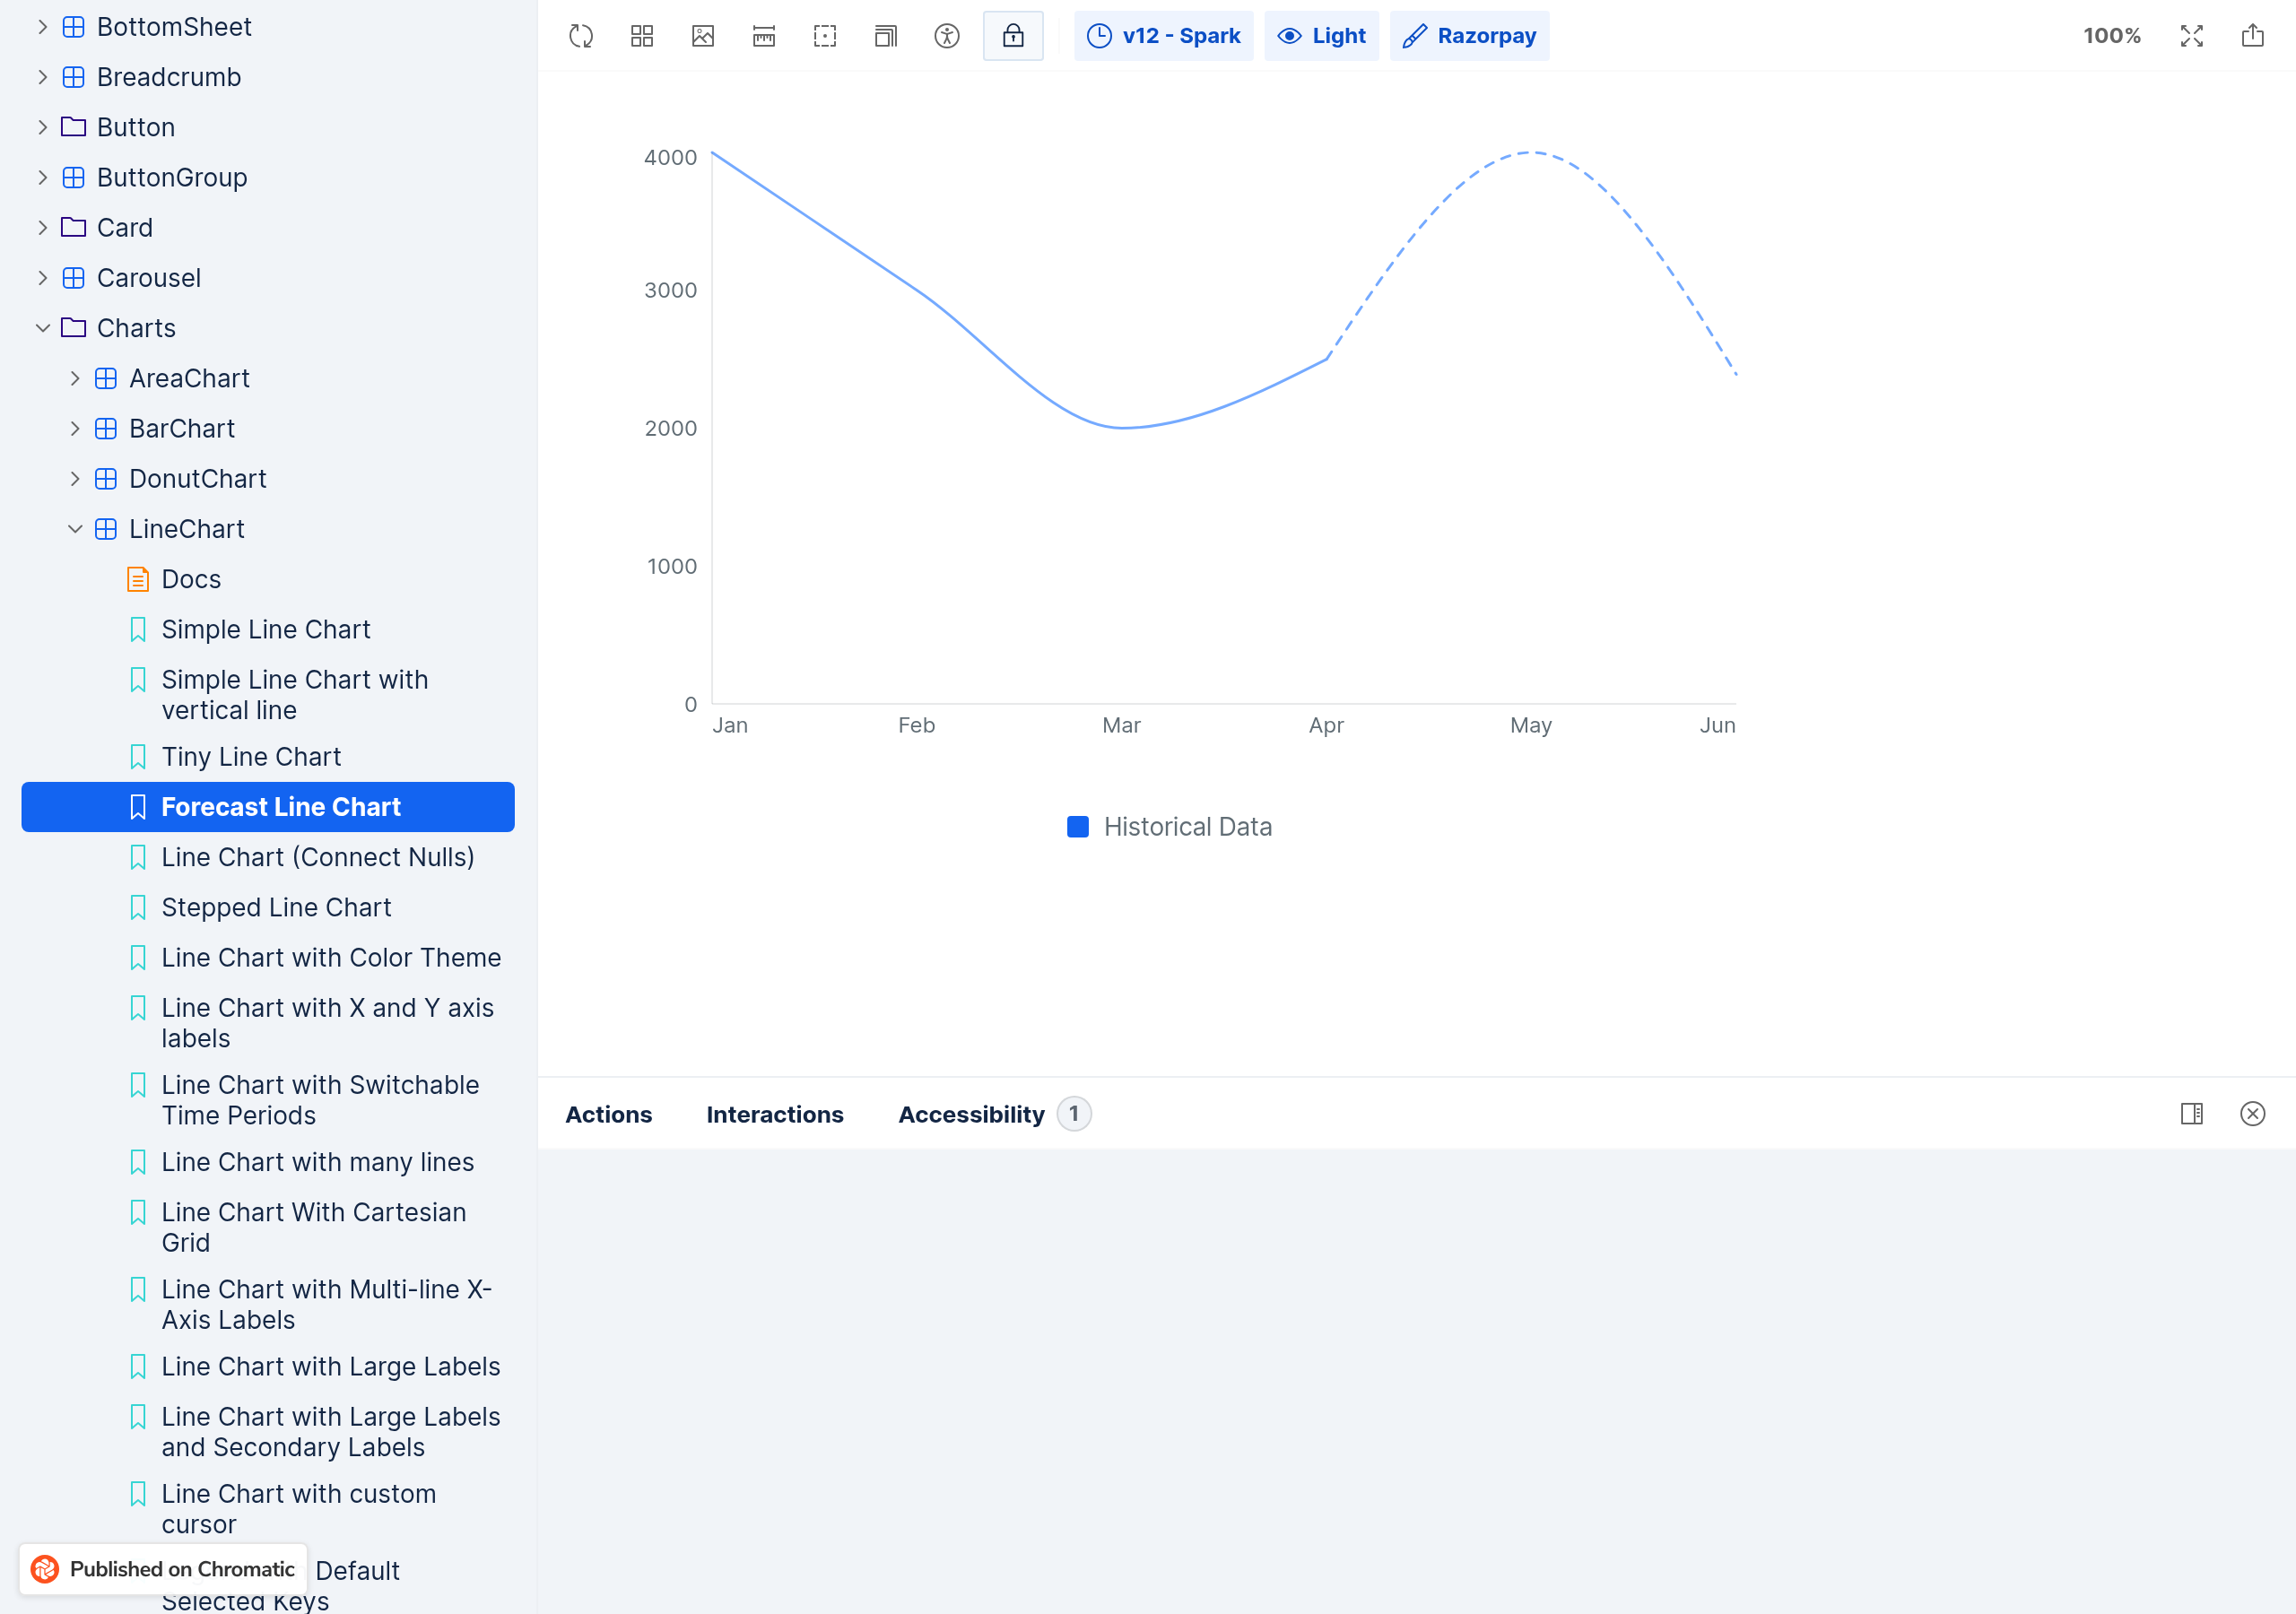
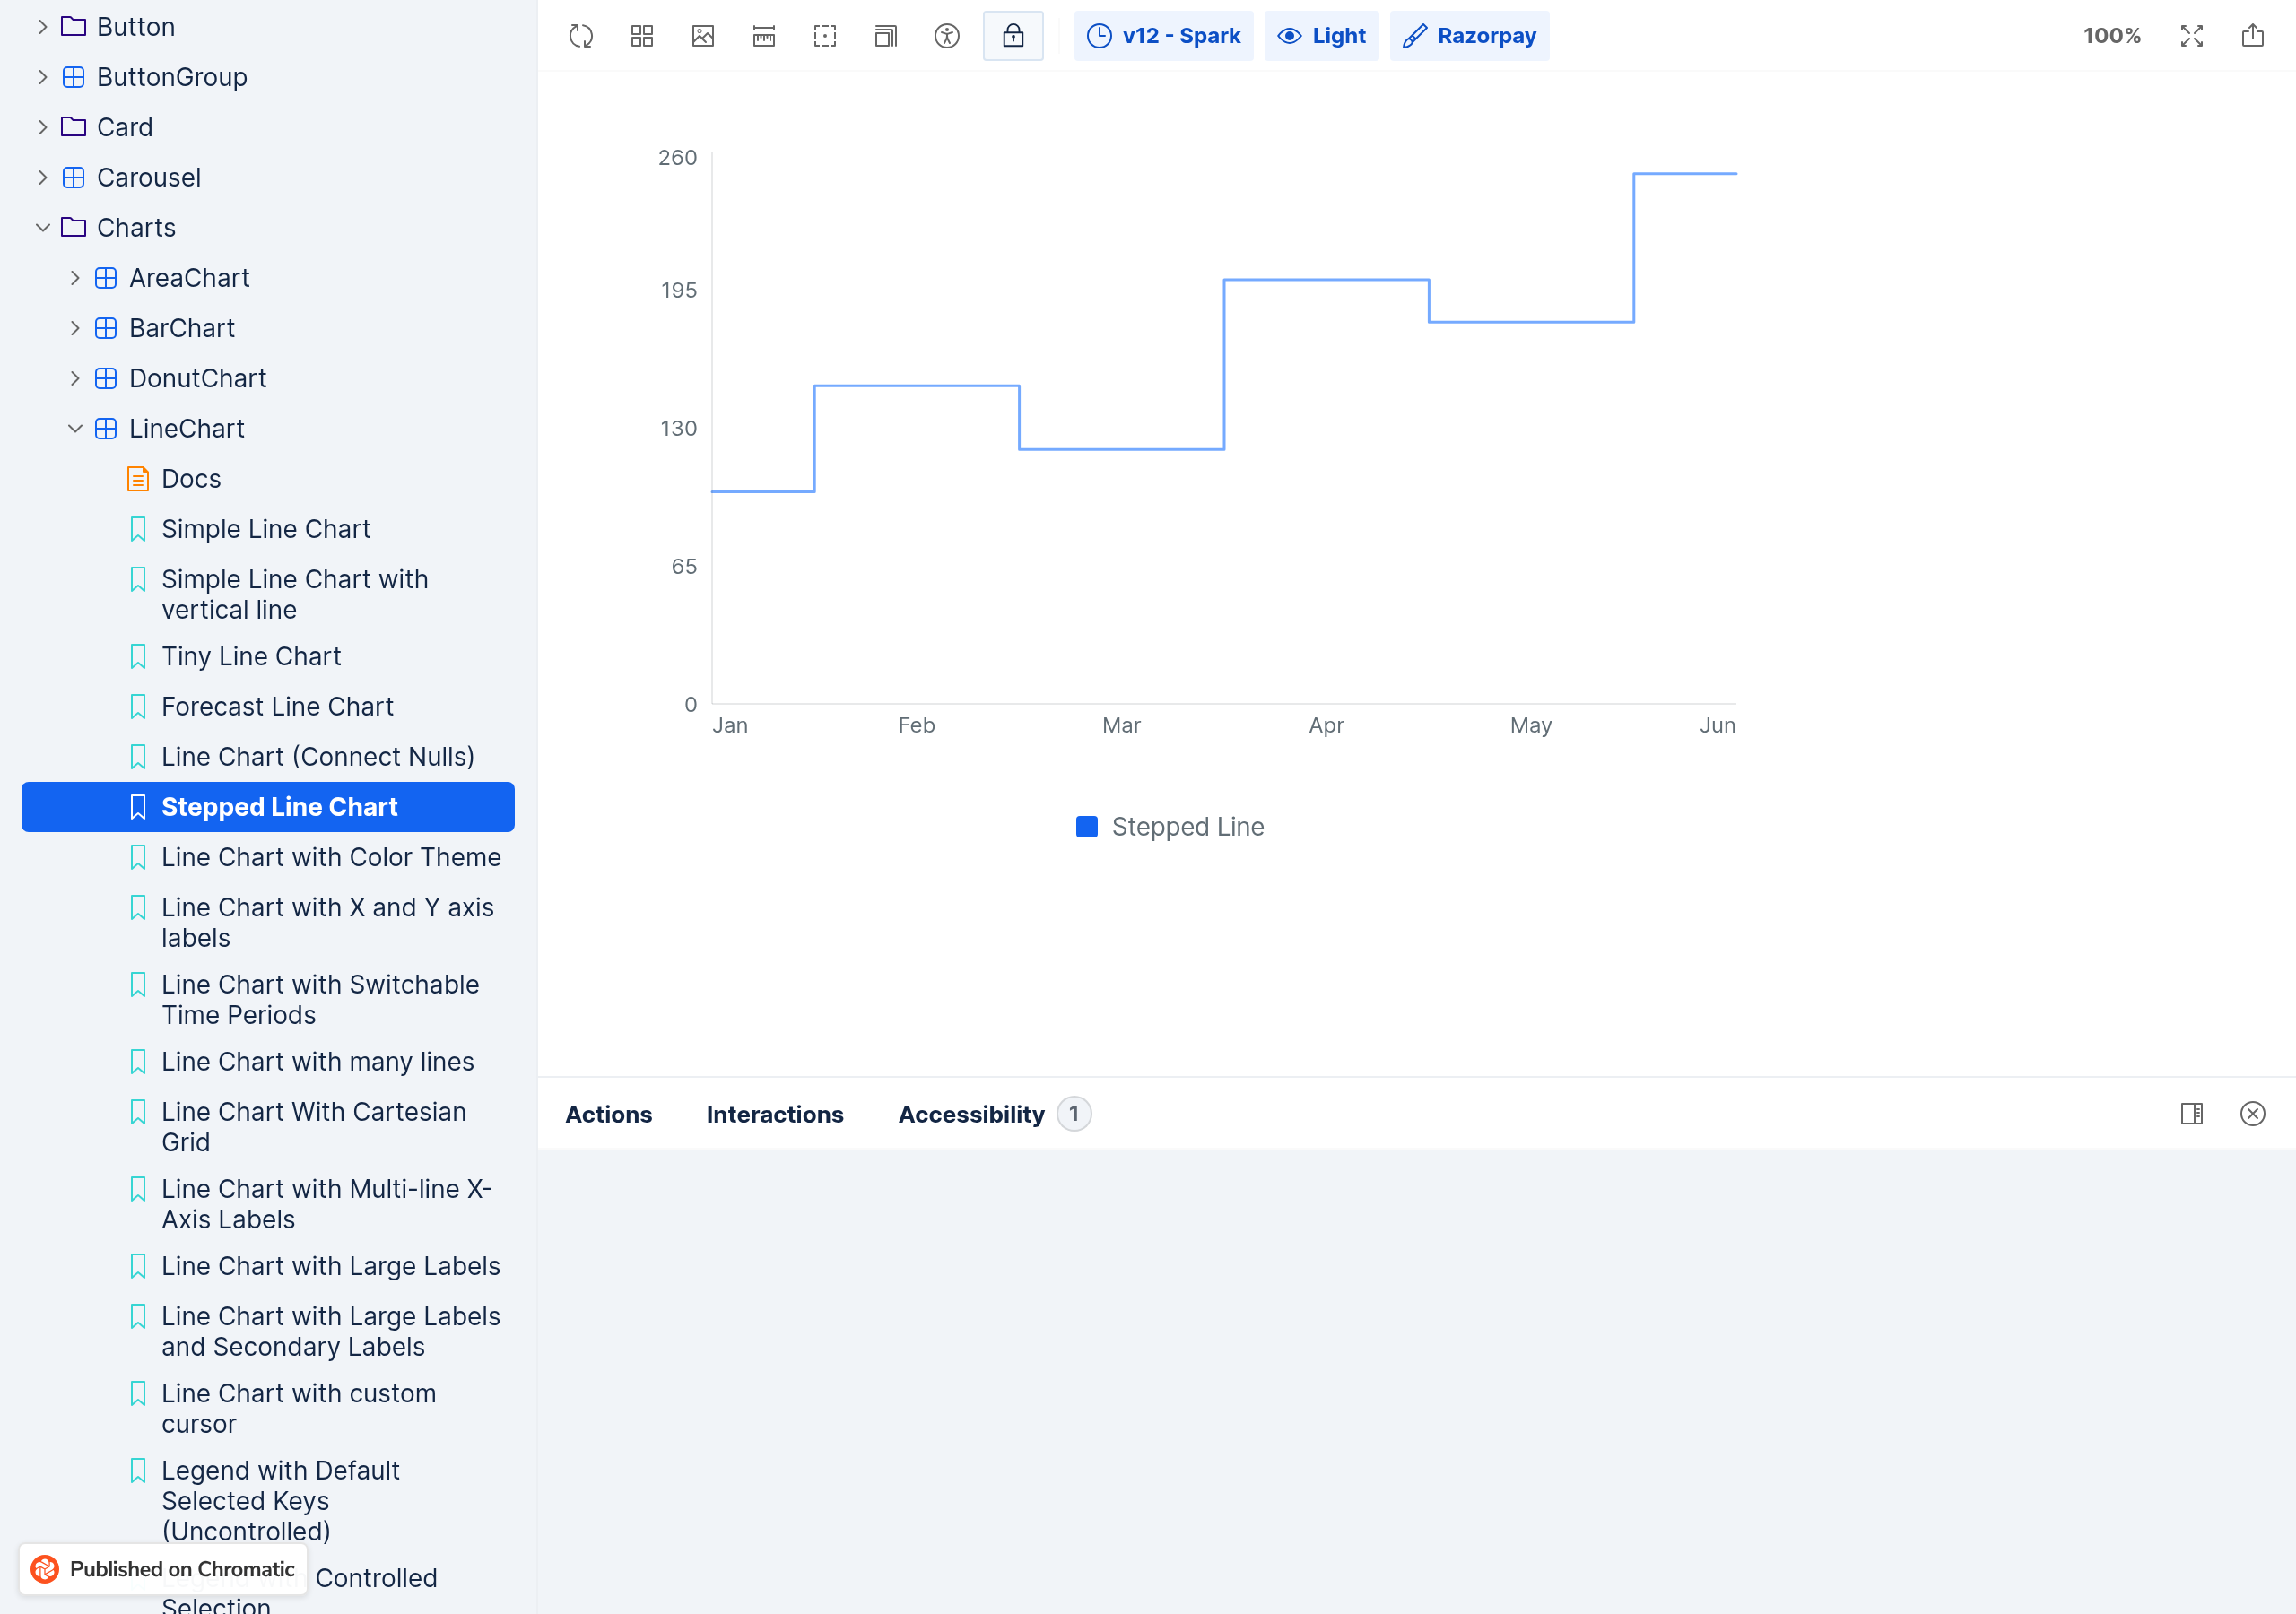
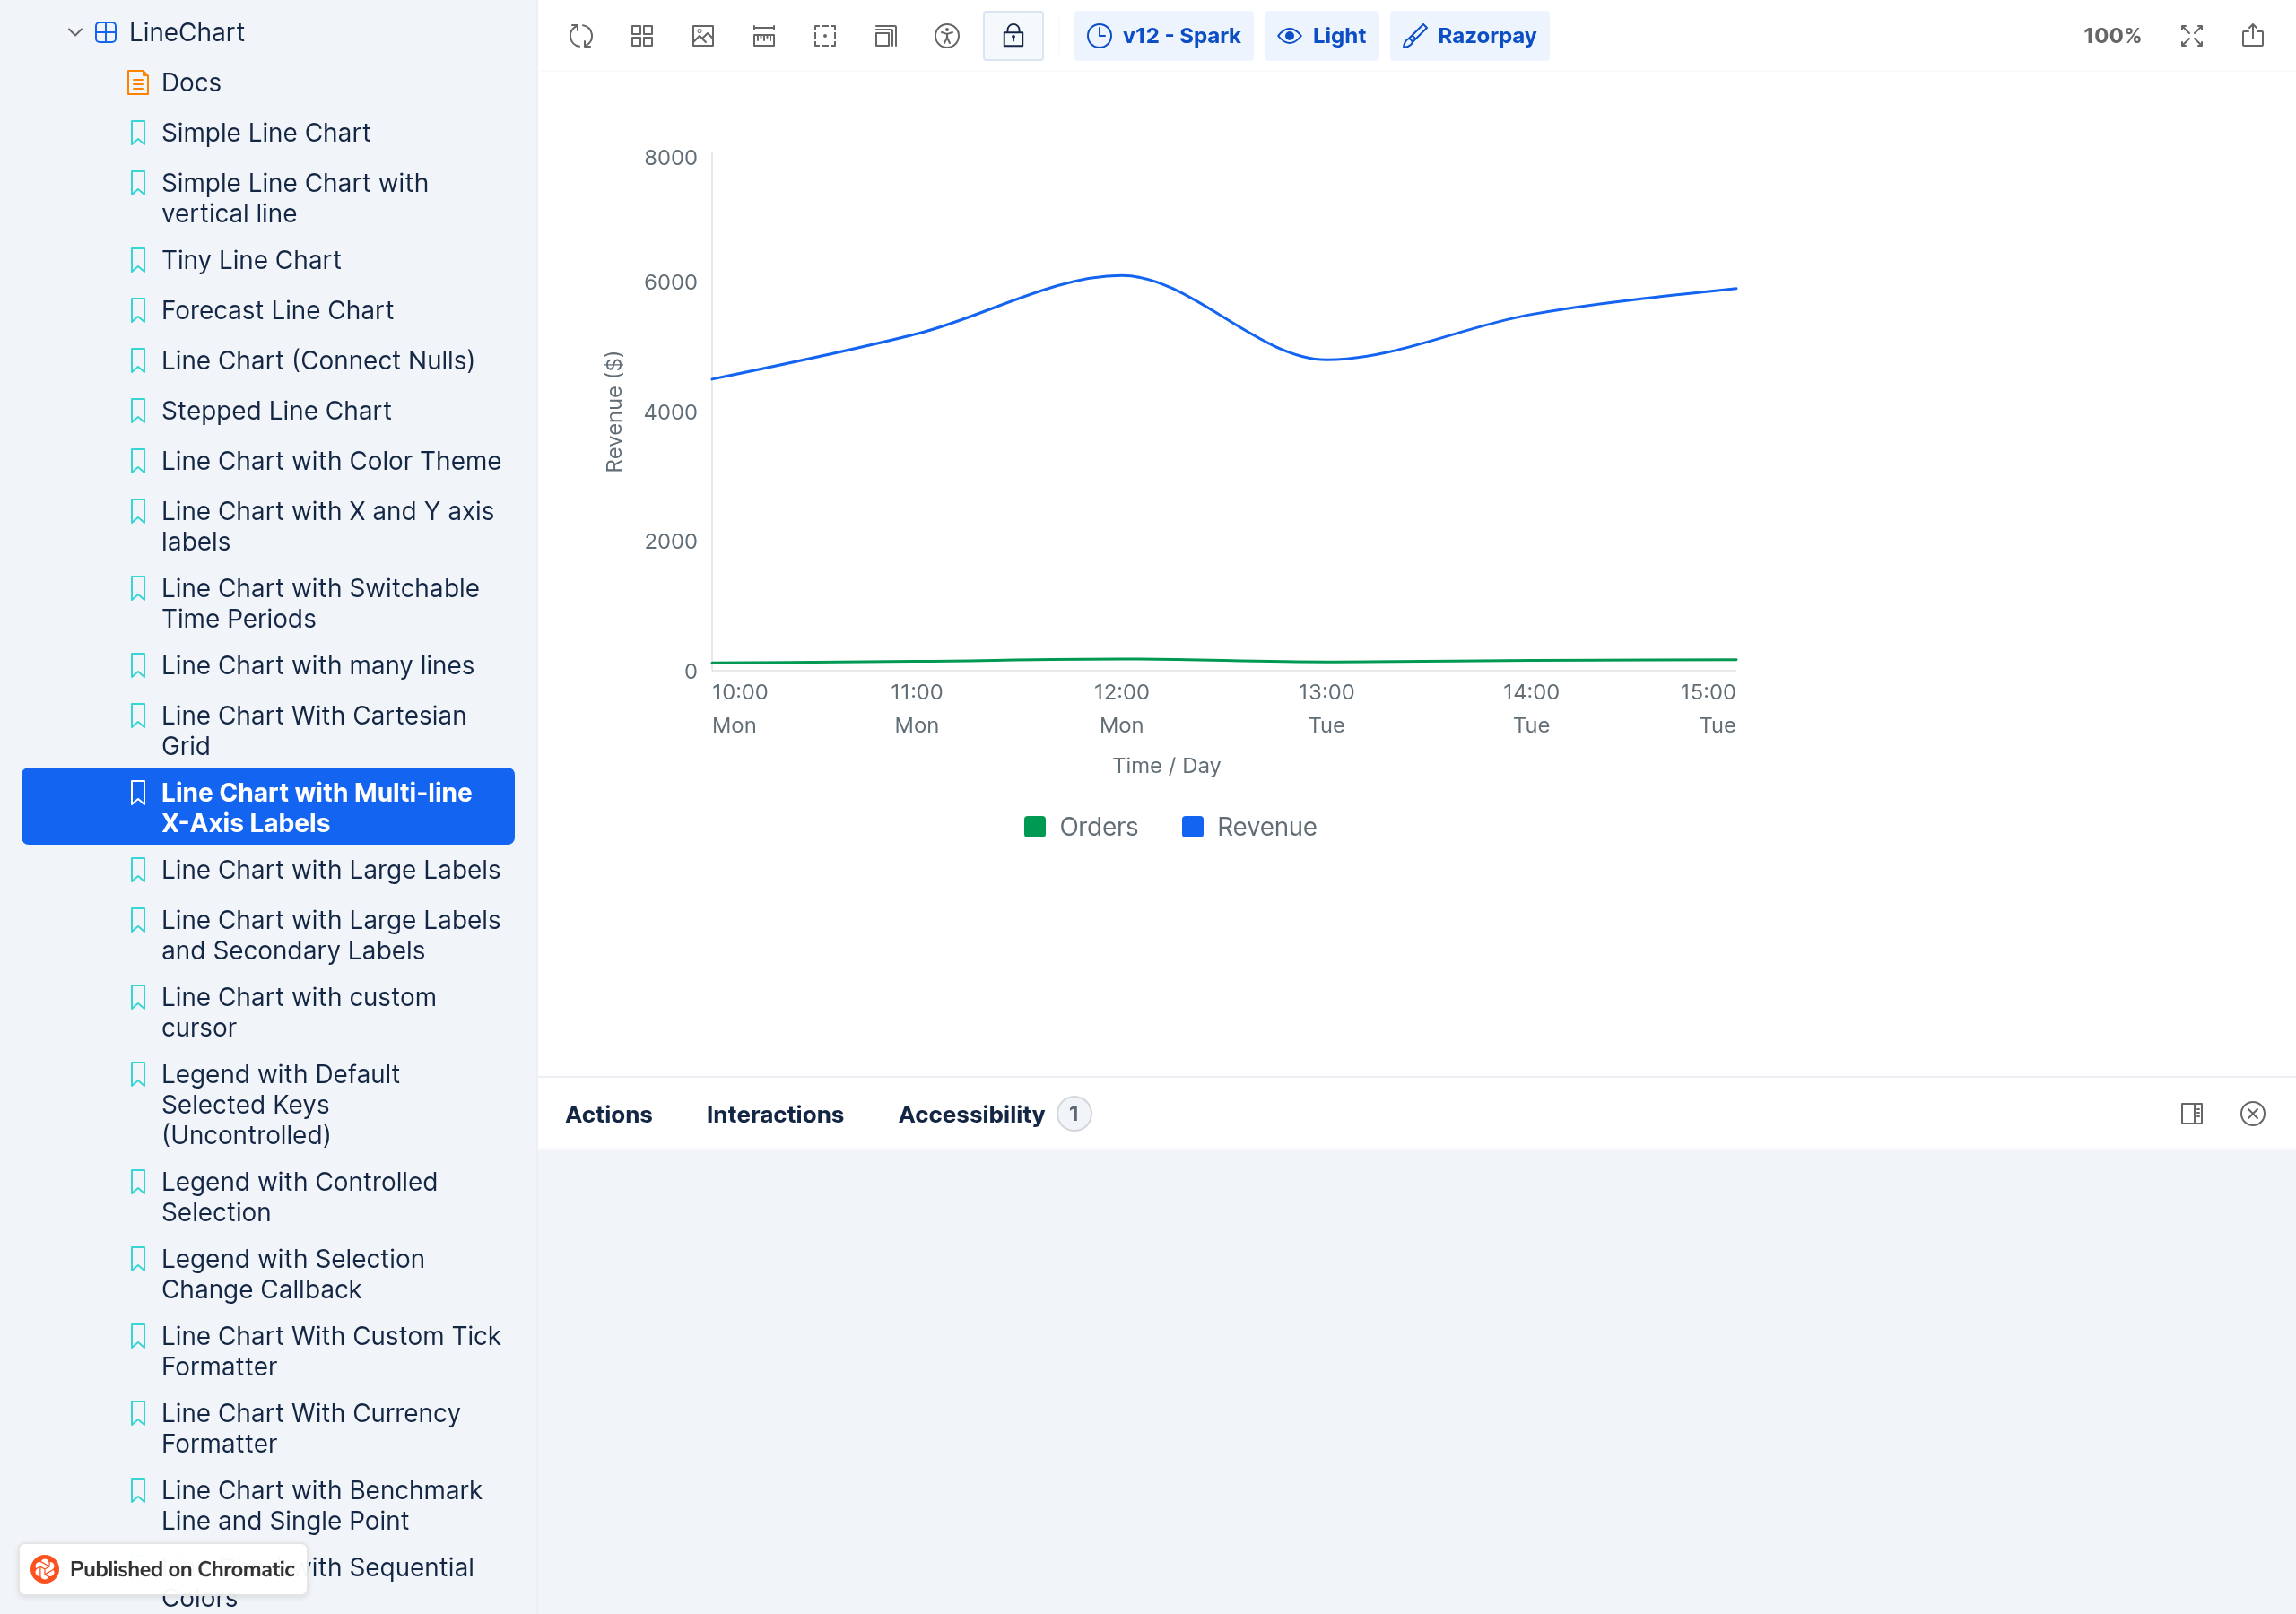
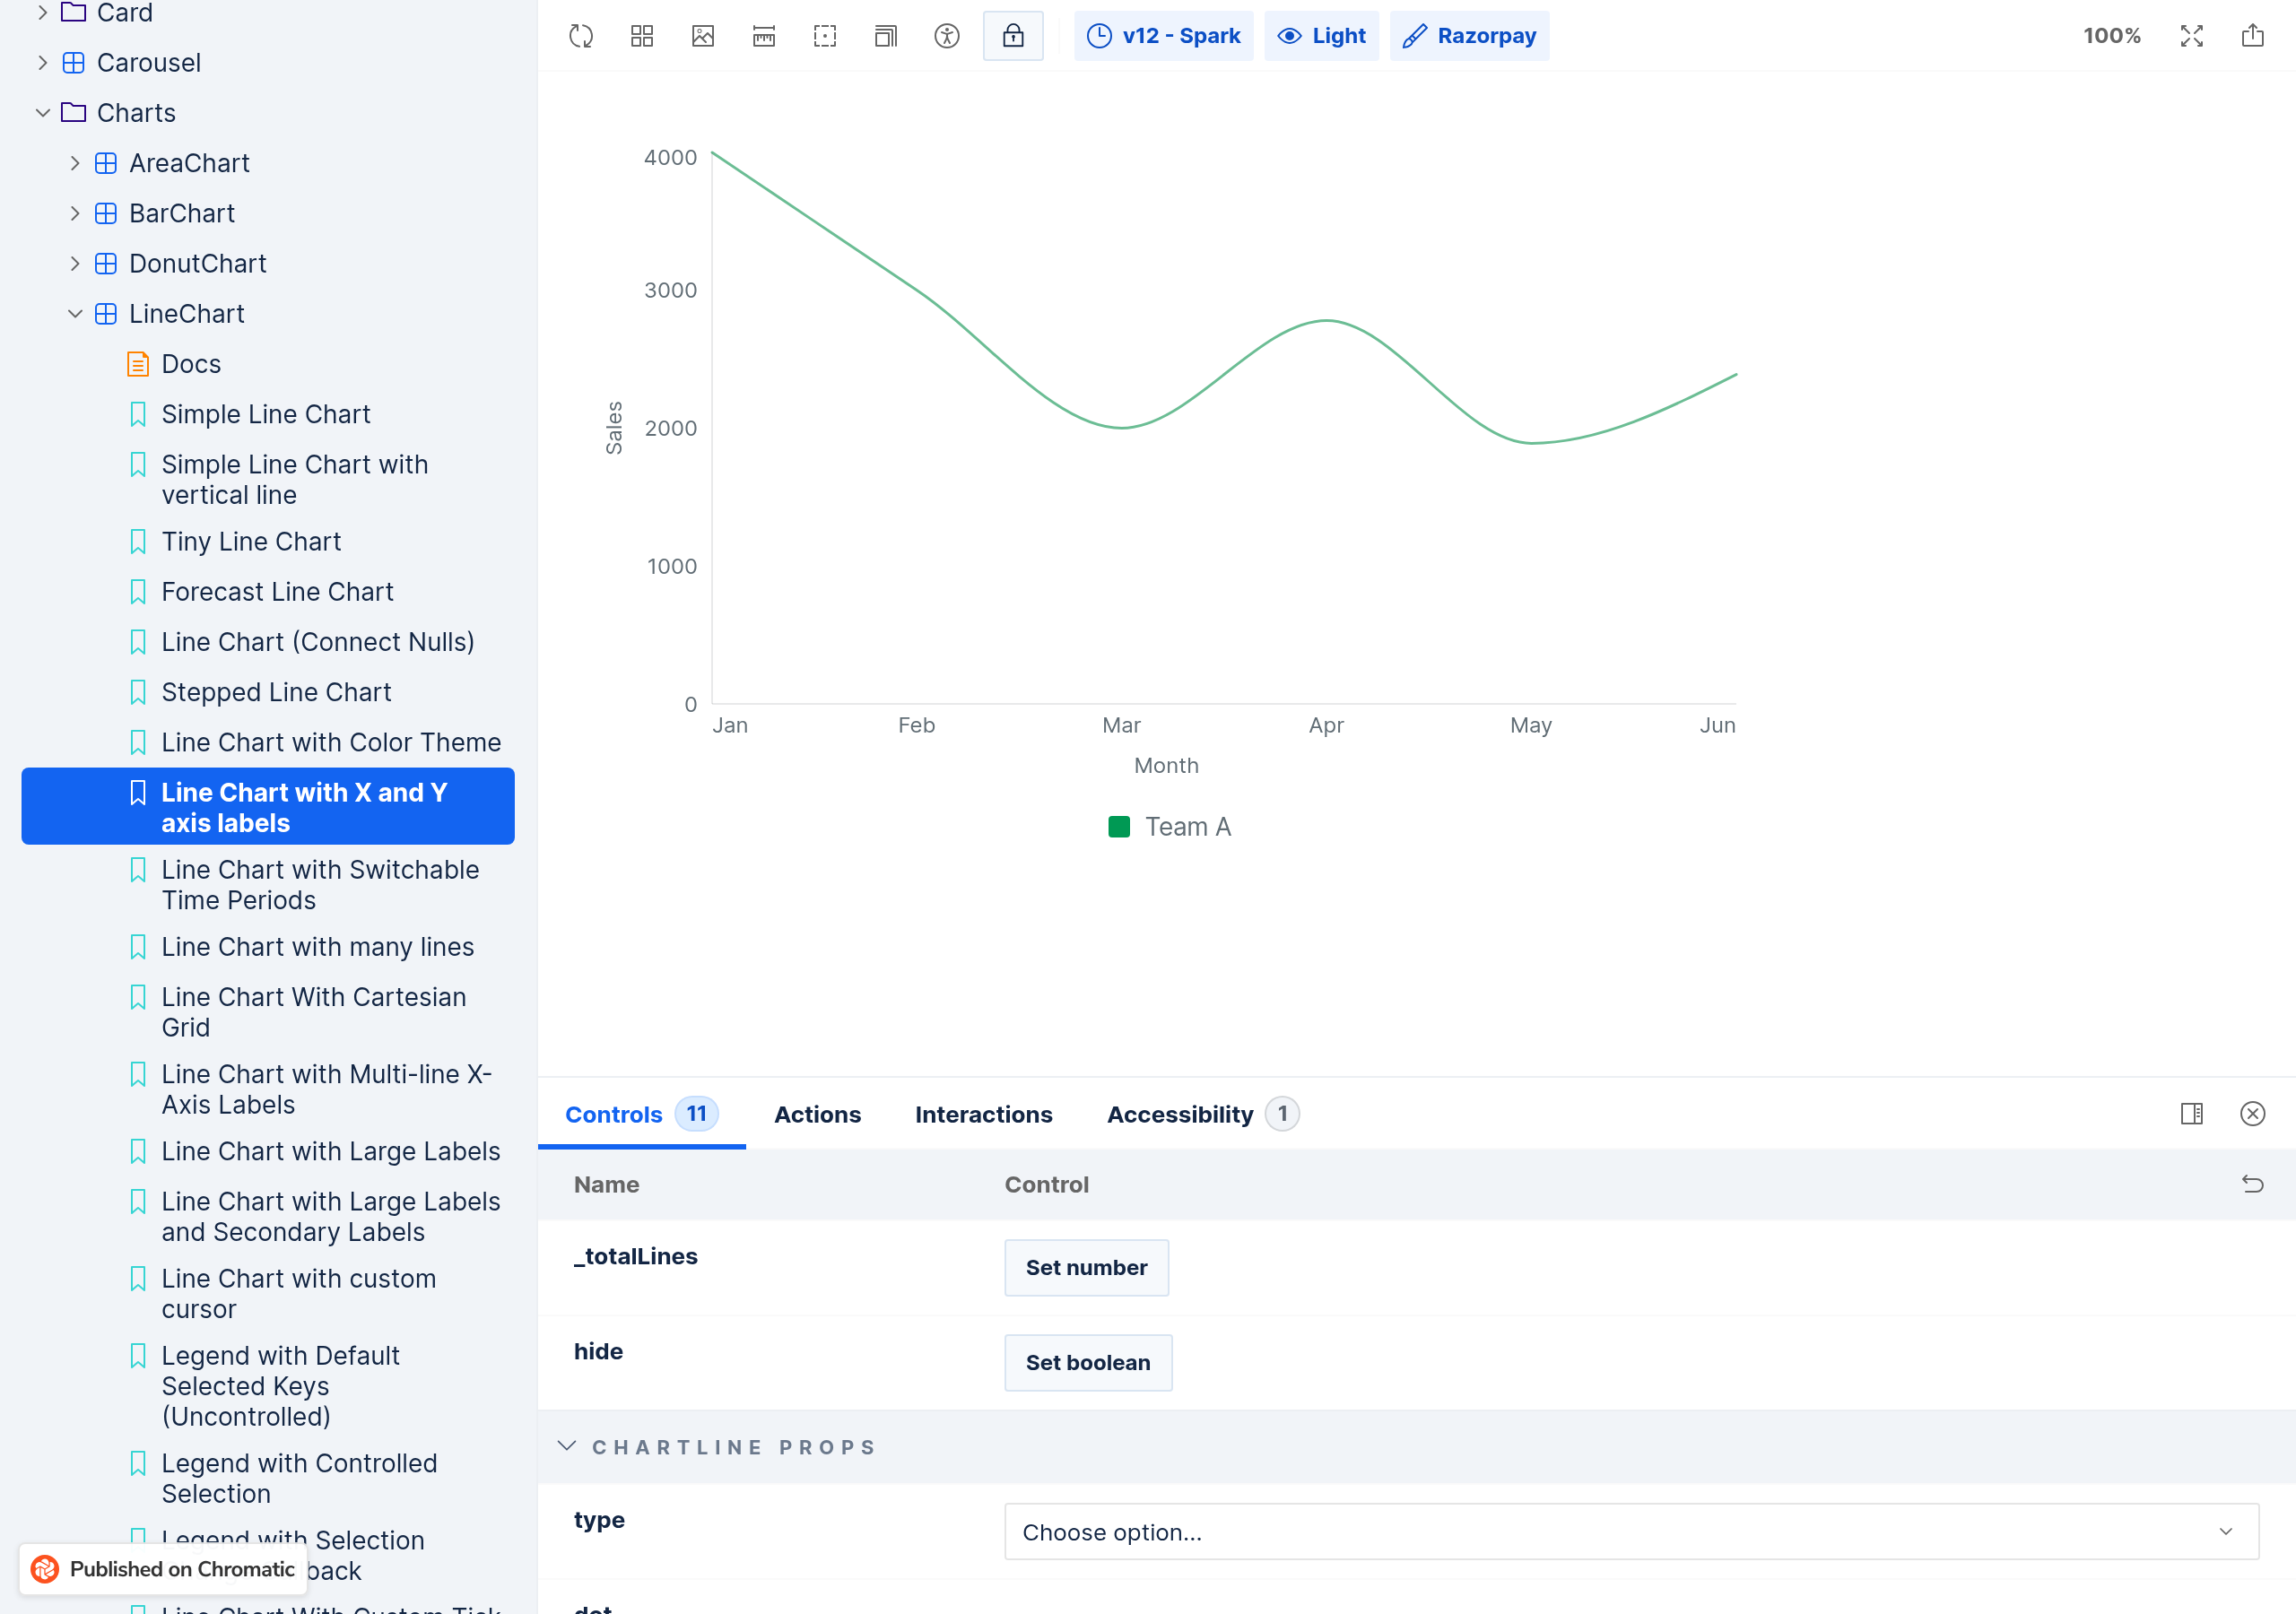
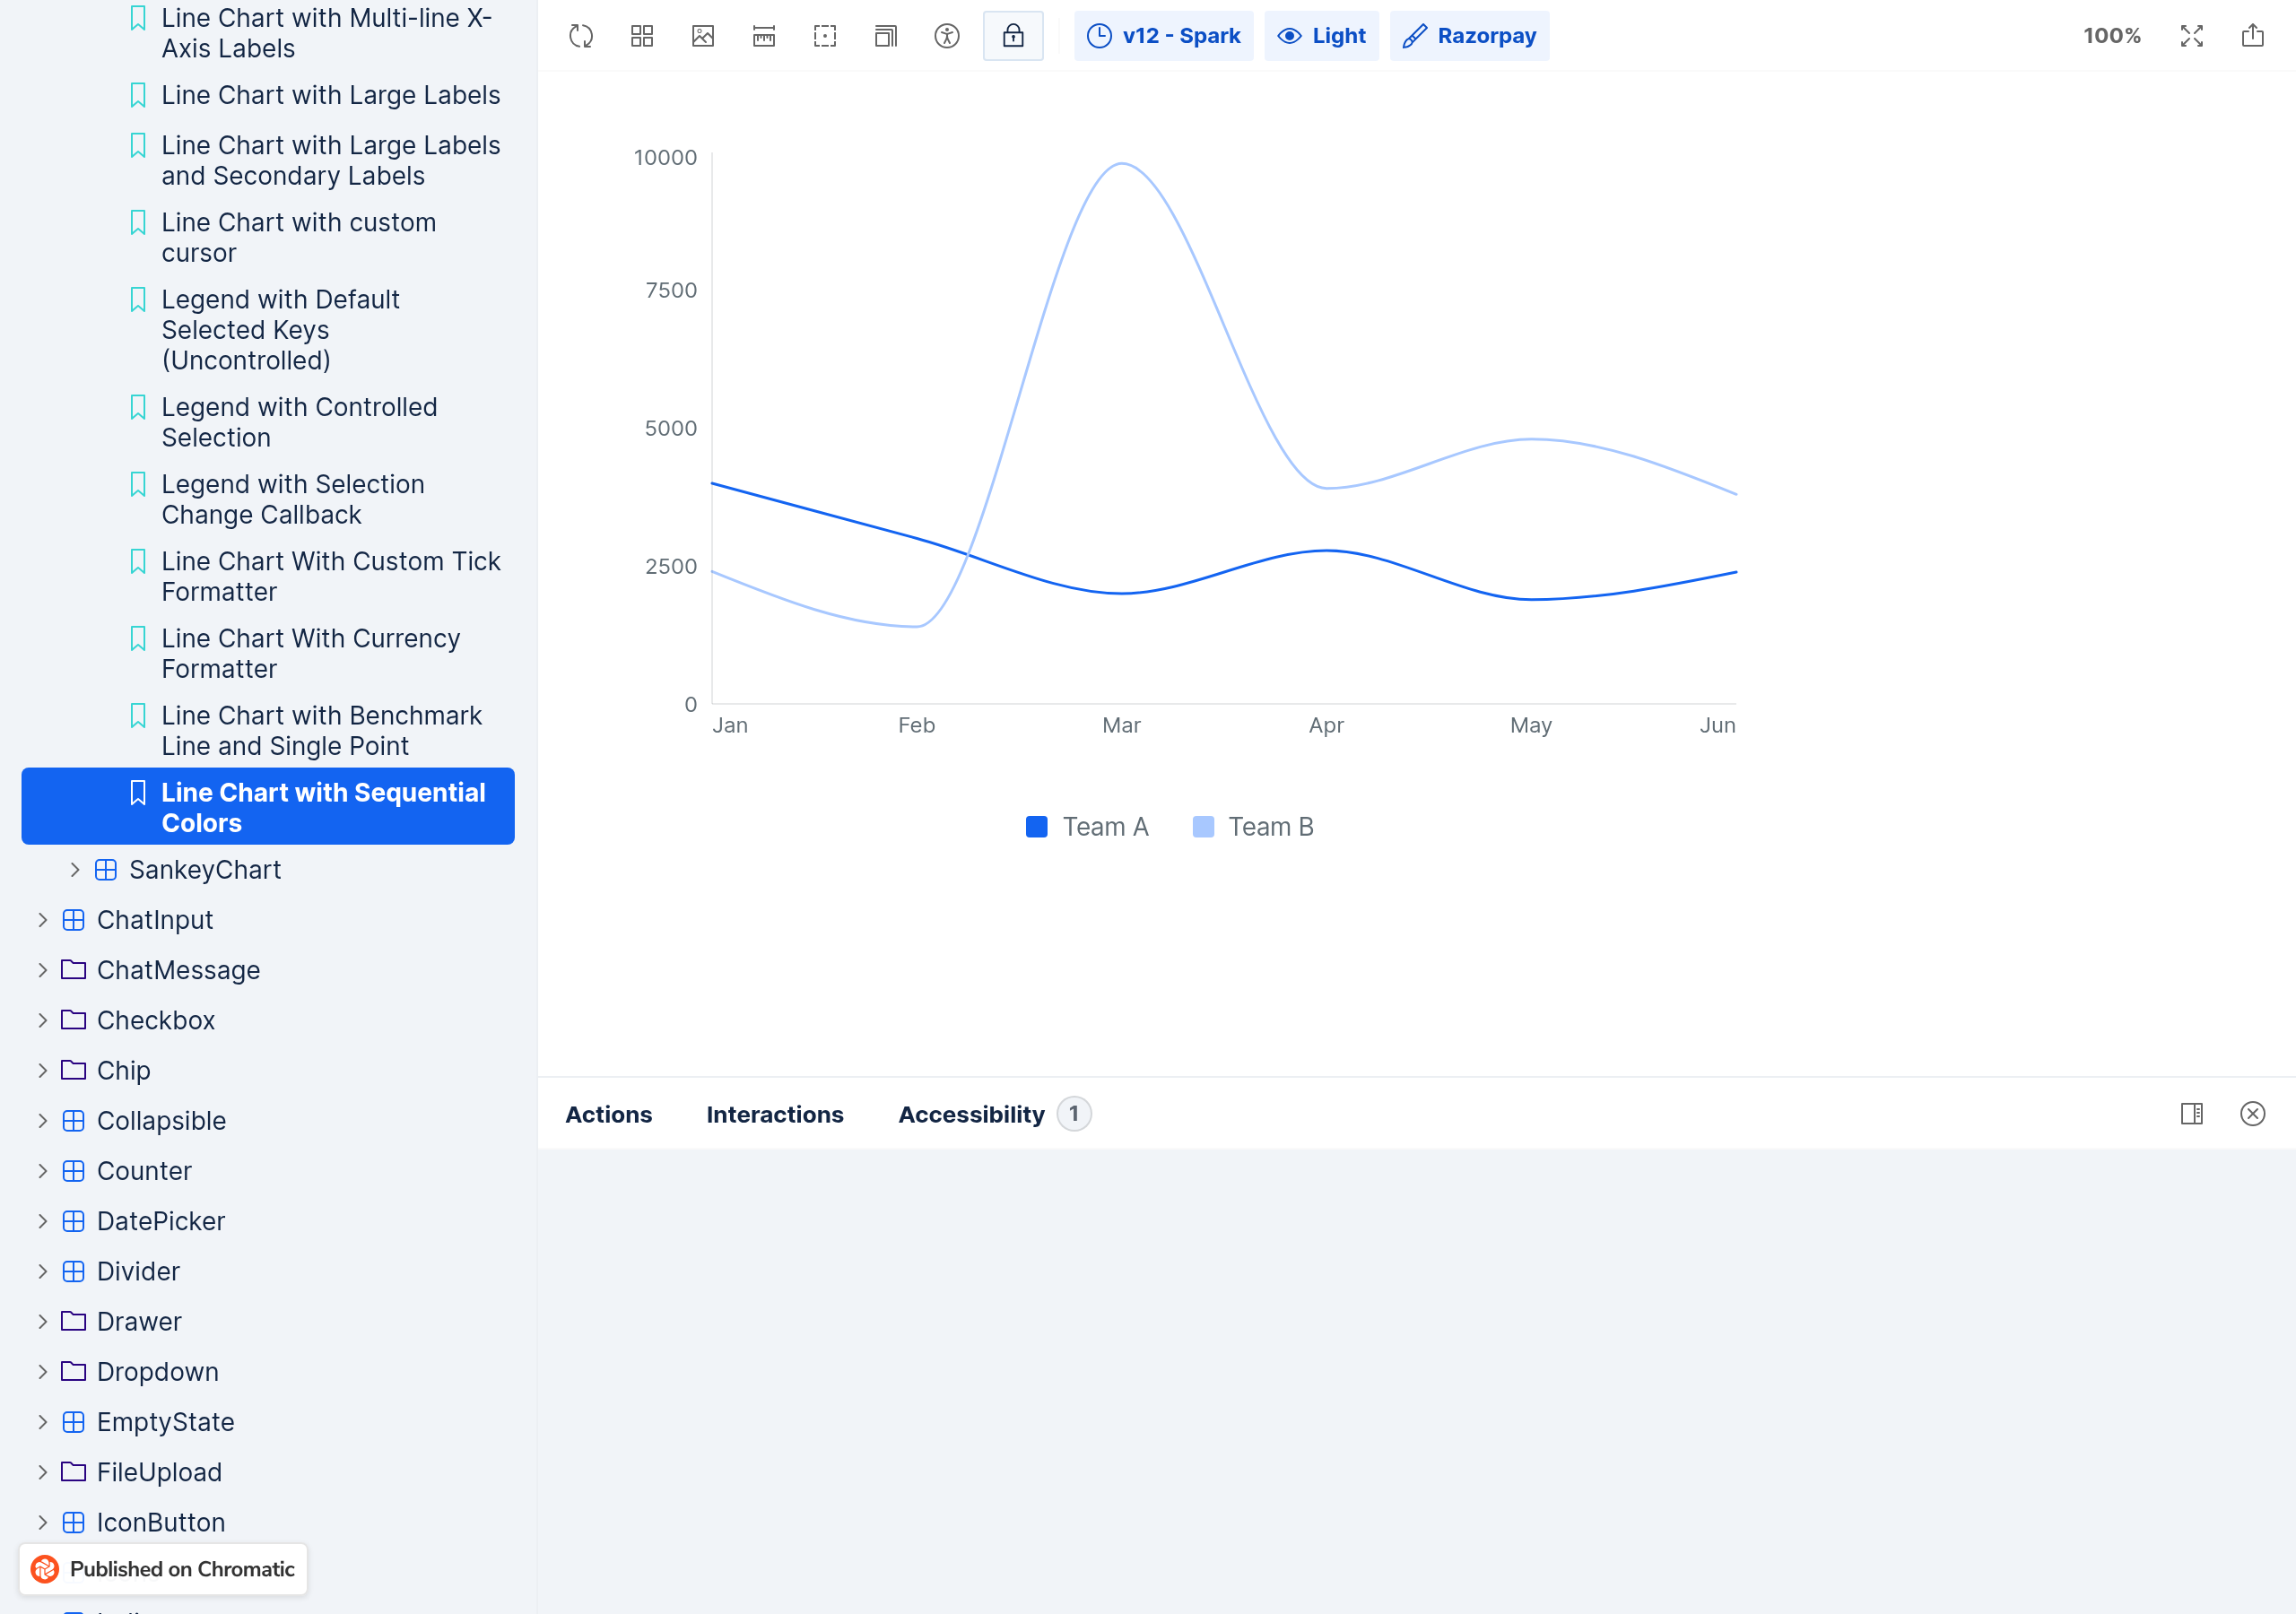
Usage
import {
  ChartLineWrapper,
  ChartLine,
  ChartXAxis,
  ChartYAxis,
  ChartCartesianGrid,
  ChartTooltip,
  ChartLegend,
  ChartReferenceLine,
} from '@razorpay/blade/components';

const data = [
  { name: 'Jan', sales: 4000, profit: 2000 },
  { name: 'Feb', sales: 3000, profit: 1500 },
  { name: 'Mar', sales: 2000, profit: 1000 },
];

<ChartLineWrapper data={data} colorTheme="categorical">
  <ChartCartesianGrid />
  <ChartXAxis dataKey="name" />
  <ChartYAxis />
  <ChartTooltip />
  <ChartLegend />
  <ChartLine dataKey="sales" name="Sales" />
  <ChartLine dataKey="profit" name="Profit" strokeStyle="dashed" />
</ChartLineWrapper>
There was a problem hiding this comment.
✨ Agentic PR Review ✨
UI Review
✅ 8 passed
Passing checks (8)
Usage
import {
  ChartLine,
  ChartLineWrapper,
  ChartXAxis,
  ChartYAxis,
  ChartCartesianGrid,
  ChartTooltip,
  ChartLegend,
  ChartReferenceLine,
} from '@razorpay/blade/components';

<ChartLineWrapper data={data} colorTheme="categorical" testID="my-chart">
  <ChartCartesianGrid />
  <ChartXAxis dataKey="month" secondaryDataKey="year" />
  <ChartYAxis label="Revenue" tickFormatter={formatCurrency} />
  <ChartTooltip filterNull={false} />
  <ChartLegend
    selectedDataKeys={['sales']}
    onSelectedDataKeysChange={({ dataKey, selectedKeysArray }) => {}}
  />
  <ChartLine dataKey="sales" name="Sales" type="monotone" strokeStyle="dashed" dot={true} connectNulls />
  <ChartLine dataKey="profit" name="Profit" color="data.background.categorical.blue.moderate" />
  <ChartReferenceLine y={4000} label="Target" />
  <ChartReferenceLine x="Feb" label="Launch" />
</ChartLineWrapper>… YAxis domain/tickCount, legend align/layout/accessibility, color assertion, shadow token, __DEV__ warning, scrub terminate [resolved by agent] Co-authored-by: admin <admin>
|
🤖 Slash AI Review has been triggered. View execution logs |
|
(Review Cancelled - Superseded by a new run) |
…t native [resolved by agent]

Co-authored-by: admin <admin>
|
🤖 Slash AI Review has been triggered. View execution logs |
|
There was a problem hiding this comment.
✨ Agentic PR Review ✨
UI Review
⏭️ 7 skipped
Usage
import {
  ChartLineWrapper,
  ChartLine,
  ChartXAxis,
  ChartYAxis,
  ChartCartesianGrid,
  ChartTooltip,
  ChartLegend,
  ChartReferenceLine,
} from '@razorpay/blade/components';

const data = [
  { month: 'Jan', sales: 4000, profit: 2000 },
  { month: 'Feb', sales: 3000, profit: 1500 },
  { month: 'Mar', sales: 5000, profit: 2500 },
];

<ChartLineWrapper data={data} colorTheme="categorical" testID="my-line-chart">
  <ChartCartesianGrid />
  <ChartXAxis dataKey="month" />
  <ChartYAxis label="Revenue" />
  <ChartTooltip />
  <ChartLegend />
  <ChartLine dataKey="sales" name="Sales" />
  <ChartLine dataKey="profit" name="Profit" strokeStyle="dashed" />
  <ChartReferenceLine y={4000} label="Target" />
</ChartLineWrapper>| if (!slots.xSecondaryDataKey || !data?.length) return undefined; | ||
| const map: Record<number, string | number | undefined> = {}; | ||
| data.forEach((row, index) => { | ||
| map[index] = getRowValue(row, slots.xSecondaryDataKey!) as string | number | undefined; |
There was a problem hiding this comment.
🟠 [MAJOR] · code-quality-critique · confidence: 9/10
Problem: The yDomain prop from ChartYAxis is parsed into slots.yDomain but never used in the y-scale computation. The code always auto-computes yMin/yMax from data, completely ignoring any user-specified domain. On web, Recharts respects the domain prop. A numeric domain like [0, 100] is silently dropped — the DEV warning only fires for non-numeric domains. This breaks web/native parity for any consumer relying on a fixed y-axis domain.
Suggestion: Use slots.yDomain when provided: const yMin = slots.yDomain ? Number(slots.yDomain[0]) : (hasNegatives ? niceFloor(dataMin) : 0); and const yMax = slots.yDomain ? Number(slots.yDomain[1]) : resolveYMax(dataMax);. Also guard against yRange === 0 when domain min equals domain max.
| if (max === -Infinity) max = 0; | ||
| return { dataMin: min, dataMax: max }; | ||
| }, [data, visibleLines, allLines]); | ||
|
|
There was a problem hiding this comment.
🟠 [MAJOR] · code-quality-critique · confidence: 9/10
Problem: The yTickCount prop from ChartYAxis is parsed into slots.yTickCount but the yTicks useMemo always uses the hardcoded constant Y_TICK_COUNT = 4 instead. Users who pass tickCount on native will not see the expected number of y-axis tick marks, breaking web/native parity. The prop is read but never referenced in any computation.
Suggestion: Use slots.yTickCount ?? Y_TICK_COUNT in the yTicks useMemo: const tickCount = slots.yTickCount ?? Y_TICK_COUNT; and loop for (let i = 0; i <= tickCount; i++). Add slots.yTickCount to the dependency array.
| // and the active/inactive dimming (strokeOpacity). | ||
| const AnimatedPath = Animated.createAnimatedComponent(Path); | ||
| const AnimatedRect = Animated.createAnimatedComponent(Rect); | ||
|
|
There was a problem hiding this comment.
🔵 [MINOR] · code-quality-critique · confidence: 8/10
Problem: The module-level let uniqueChartCounter = 0 is never reset between tests. Each test that renders a ChartLineWrapper increments the counter, so chart IDs embedded in clipPath IDs are order-dependent. Adding, removing, or reordering tests changes all subsequent IDs and breaks snapshot tests.
Suggestion: Export a resetChartIdCounter helper from the module and call it in beforeEach in the test file. Alternatively, use React.useId() with a fallback for the first render.
| }; | ||
|
|
||
| describe('<ChartLineWrapper /> (native)', () => { | ||
| it('should render a single line', () => { |
There was a problem hiding this comment.
🔵 [MINOR] · code-quality-critique · confidence: 7/10
Problem: Multiple snapshot tests do not call fireLayout. Without a layout event, size remains {width: 0, height: 0} and the SVG content (lines, axes, grid, tooltip) is never rendered — the condition size.width > 0 && size.height > 0 is false. These snapshots only capture the empty component shell, providing no actual coverage of the chart rendering logic.
Suggestion: Call fireLayout(getByTestId('...-layout')) in all snapshot tests that expect SVG content. For tests without a testID prop, add one so the layout View can be found and the layout event fired.
| y: value === null ? 0 : plotHeight - ((value - yMin) / yRange) * plotHeight, | ||
| value, | ||
| }; | ||
| }); |
There was a problem hiding this comment.
🔵 [MINOR] · code-quality-critique · confidence: 7/10
Problem: dataSignature is computed as ${data.length}:${allDataKeys.join(',')}. When data values change but the array length and data keys remain the same, dataSignature does not change, so the LineSeries draw-in animation effect does not re-trigger. The line paths update but snap to the new shape without any animation. On web, Recharts animates data value changes smoothly.
Suggestion: Include a data content hash in dataSignature, e.g. JSON.stringify(data) or a shallow value hash, so value-only changes trigger the re-animation. Alternatively, accept this as an intentional native design choice and document it.
| // Web: dashed/dotted lines begin later (LineChart.web.tsx:64-67). | ||
| const beginDelay = line.strokeStyle === 'dashed' ? baseDelay + duration : baseDelay; | ||
| const drawEasing = getIn(theme.motion, 'easing.standard'); | ||
| const dimDuration = getIn(theme.motion, 'duration.gentle'); |
There was a problem hiding this comment.
🔵 [MINOR] · code-quality-critique · confidence: 6/10
Problem: The LineSeries draw animation useEffect sets draw.value = 0 then starts withDelay(withTiming(...)) but has no cleanup function. If the component unmounts mid-animation, the reanimated animation may continue running on the UI thread. The draw.value = 0 assignment on effect re-trigger can also cause a brief flash of the fully-clipped (invisible) state before the delayed animation begins.
Suggestion: Add a cleanup that cancels the animation: return () => { cancelAnimation(draw); }; (import cancelAnimation from react-native-reanimated). Apply the same cleanup to the dim animation effect.
|
|
||
| const getSeriesNumber = (row: Record<string, unknown>, dataKey: string): number | null => | ||
| toNullableNumber(getRowValue(row, dataKey)); | ||
|
|
There was a problem hiding this comment.
🙏🏻 [NEEDS CLARIFICATION] · api-decision-critique · confidence: 5/10
Is only numeric y support on native intentional, or should string y values also be coerced?
| /> | ||
| {yTicks.map((tick, idx) => { | ||
| const y = plotHeight - ((tick - yMin) / yRange) * plotHeight; | ||
| return ( |
There was a problem hiding this comment.
🙏🏻 [NEEDS CLARIFICATION] · api-decision-critique · confidence: 4/10
Is the 'No data to display' empty state on native an intentional UX decision, or should it match web's behavior of rendering an empty chart?
…pshots

Slash auto-resolve widened colorToken to optional and broke native typegen;
mirror AreaChart's cast + typed resolveColor fallback, then refresh legend a11y snapshot.

Co-authored-by: Cursor <cursoragent@cursor.com>
|
🤖 Slash AI Review has been triggered. View execution logs |
Wire yDomain/yTickCount into the native y-scale computation,
matching AreaChart.native behavior.

Co-authored-by: Cursor <cursoragent@cursor.com>
|
🤖 Slash AI Review has been triggered. View execution logs |

There was a problem hiding this comment.
✨ Agentic PR Review ✨
UI Review
✅ 10 passed · ❌ 9 failed
| Check | Problem |
|---|---|
| Missing Cursor Line at Active Index | No vertical cursor line is rendered at the active data point during scrub/tap. Users cannot see which column they are scrubbing without the cursor indicator. Suggestion: Add a cursor line: {activeIndex !== undefined ? <Line x1={xForIndex(activeIndex)} x2={xForIndex(activeIndex)} y1={0} y2={plotHeight} stroke={getIn(theme.colors, 'surface.border.gray.normal')} strokeWidth={1} /> : null} |
| yRange=0 Division by Zero | No guard against yRange=0. Flat data (all same values) produces NaN for all point y-coordinates. Suggestion: Add yRange>0 guard: yRange > 0 ? plotHeight - ((value - yMin) / yRange) * plotHeight : plotHeight / 2 |
| Reference Line Chip Height Inconsistency | 10px height difference between chart types for the same ChartReferenceLine component. Suggestion: Align chipHeight to 30 to match AreaChart.native.tsx. |
| Reference Line Label Missing fontWeight | Reference line labels appear thinner on LineChart than on AreaChart. Suggestion: Add fontWeight={theme.typography.fonts.weight.medium} to reference line label SvgText elements. |
| Reference Line Label Missing Truncation | A very long reference line label will overflow the chip and plot area with no upper bound on chipWidth. Suggestion: Add REF_LABEL_MAX_WIDTH=200 constant, cap chipWidth, and truncate with ellipsis — matching AreaChart.native.tsx. |
| Tooltip Styling Inconsistency with AreaChart | Tooltip styling differs between chart types. 20px width difference may cause label wrapping on LineChart that AreaChart shows on one line. Suggestion: Align tooltip constants to match AreaChart: TOOLTIP_WIDTH=180, spacing[3] padding, stronger shadow. Consider extracting tooltip into shared component. |
| Legend Visual Inconsistency with AreaChart | Legend visual presentation differs between chart types for the same ChartLegend component. Suggestion: Align to AreaChart: swatch 12px, text 'xsmall', opacity 0.4, add textDecorationLine strikethrough for deselected items. |
| Custom dot/activeDot Object Props Silently Ignored | Custom dot/activeDot object configurations (radius, fill, stroke) are silently ignored on native. Web fully supports these via Recharts. Suggestion: Extract dot/activeDot object props in readChildSlots and use them in Circle rendering. At minimum, log a DEV warning when object props with custom properties are used. |
| Story Coverage - Missing dotted strokeStyle | dotted stroke style has no visual verification story on native. Suggestion: Add a story variant with strokeStyle='dotted' alongside dashed and solid lines. |
Passing checks (10)
| Check |
|---|
| ✅ Visual Parity - Colors and Theme Tokens |
| ✅ Visual Parity - Stroke Width and Dash Patterns |
| ✅ Visual Parity - Hover Dim Opacity and Animation |
| ✅ SVG Path Construction - Monotone/Linear/Step |
| ✅ SVG Path Construction - Null Segments |
| ✅ Touch Interaction - Scrub and ScrollView Coexistence |
| ✅ Touch Interaction - Per-Line Hover Dimming |
| ✅ Tooltip Positioning - Edge Overflow |
| ✅ Responsive Layout and Zero-Size Guard |
| ✅ Story Coverage - Core Visual States |
Usage
import { ChartLineWrapper, ChartLine } from '@razorpay/blade/components';
import {
  ChartXAxis,
  ChartYAxis,
  ChartCartesianGrid,
  ChartTooltip,
  ChartLegend,
  ChartReferenceLine,
} from '@razorpay/blade/components';

const data = [
  { month: 'Jan', sales: 4000, profit: 2000 },
  { month: 'Feb', sales: 3000, profit: 1500 },
  { month: 'Mar', sales: 5000, profit: 2500 },
];

<ChartLineWrapper data={data}>
  <ChartXAxis dataKey="month" />
  <ChartYAxis />
  <ChartCartesianGrid />
  <ChartTooltip />
  <ChartLegend />
  <ChartLine dataKey="sales" name="Sales" />
  <ChartLine dataKey="profit" name="Profit" strokeStyle="dashed" />
  <ChartReferenceLine y={4500} label="Target" />
</ChartLineWrapper>
There was a problem hiding this comment.
✨ Agentic PR Review ✨
UI Review
✅ 15 passed · ❌ 16 failed · ⏭️ 2 skipped
| Check | Problem |
|---|---|
| Reference line chip height mismatch | The reference line label pill is 20px tall on native LineChart vs 30px on web and AreaChart native. The label pill looks disproportionately small and cramped. Suggestion: Change chipHeight from 20 to 30 to match web (RECT_HEIGHT=30) and AreaChart native (chipHeight=30). |
| Reference line label missing fontWeight | Reference line label text on native LineChart defaults to regular weight, appearing thinner than intended compared to web and AreaChart native. Suggestion: Add fontWeight={theme.typography.fonts.weight.medium} to the SvgText elements for reference line labels. |
| Reference line label no max-width cap or truncation | A very long reference line label will produce a chip wider than the plot, overflowing the SVG canvas and overlapping other chart elements. Suggestion: Add a max width cap (e.g., Math.min(200, Math.max(40, label.length * 6 + 16))) and truncate the label text with ellipsis. |
| Vertical reference line label not clamped to plot bounds | When a vertical reference line is at or near the first or last data point, the label chip will extend beyond the plot edge. Suggestion: Clamp the chip x position: x={Math.max(0, Math.min(x - chipWidth/2, plotWidth - chipWidth))}. |
| Legend deselected opacity mismatch | Deselected legend items appear at 50% opacity instead of 40%, reducing visual distinction between selected and deselected series. Suggestion: Change the deselected legend opacity from 0.5 to 0.4. |
| Legend missing line-through text decoration | Deselected legend items lack the strikethrough text decoration, removing a secondary visual cue for the deselected state. Suggestion: Add textDecorationLine={selected ? 'none' : 'line-through'} to the legend Text component. |
| Legend swatch size and text size inconsistency | Legend swatch dots and text are different sizes between LineChart and AreaChart native, breaking design consistency when both appear on the same screen. Suggestion: Align legend constants: use LEGEND_SWATCH_SIZE=12 and Text size='xsmall' to match AreaChart native. |
| Legend padding inconsistency with AreaChart | Legend container padding differs between LineChart and AreaChart native, causing visible spacing differences. Suggestion: Align legend container padding with AreaChart native. |
| Missing scrub cursor line | During scrub interaction, there is no visual cursor line indicating the active x position. With multiple lines, the user has no clear indicator of which column is active. Suggestion: Add a vertical cursor line at xForIndex(activeIndex) when activeIndex is defined, matching AreaChart native. |
| Tooltip shadow inconsistency with AreaChart native | The LineChart tooltip has a noticeably lighter and smaller shadow compared to AreaChart native, breaking visual consistency. Suggestion: Align tooltip shadow values with AreaChart native: shadowOpacity=0.24, shadowRadius=12, elevation=8. |
| Tooltip width inconsistency with AreaChart native | The LineChart tooltip is 160px vs AreaChart's 180px, potentially wrapping labels more aggressively. Suggestion: Align TOOLTIP_WIDTH to 180, or extract a shared constant. |
| Y-axis label rotation offset mismatch | The rotated y-axis title is positioned 2px differently compared to AreaChart native, causing subtle misalignment. Suggestion: Align the y-axis label x-offset to match AreaChart native. |
| Single data point with dot=false renders invisible | A LineChart with a single data point and dot=false renders nothing visible. The user sees a blank chart area with axes but no data marker. Suggestion: When pointCount === 1, automatically render a dot at the single point, or show a dev-mode warning. |
| yRange=0 division by zero | When an explicit yDomain with equal min and max is provided, all line points compute y=NaN, rendering the line invisible without any error. Suggestion: Add a guard: use yRange > 0 ? yRange : 1, or default to plotHeight when yRange===0. |
| X-tick label width estimation inconsistency | Primary tick labels are estimated narrower than they should be, potentially causing the thinning algorithm to keep more labels than fit, leading to overlap. Suggestion: Use estimateTickLabelWidth consistently for both primary and secondary labels. |
| Accessibility: chart container lacks accessibility props | Screen reader users cannot understand what the chart represents. The chart is opaque to assistive technology. Suggestion: Add accessibilityRole='image' and a default accessibilityLabel to the chart container. |
Passing checks (15)
| Check |
|---|
| ✅ Visual parity: tooltip background and border |
| ✅ Visual parity: tooltip text styles |
| ✅ Visual parity: line stroke width and dash patterns |
| ✅ Visual parity: dim opacity on hover |
| ✅ Visual parity: animation begin delay for dashed lines |
| ✅ Visual parity: reference line stroke color and dash pattern |
| ✅ Visual parity: reference line chip fill and border colors |
| ✅ Visual parity: empty data state |
| ✅ Visual parity: negative values domain handling |
| ✅ Visual parity: x-axis tick label wrapping and thinning |
| ✅ Visual parity: tooltip edge clamping |
| ✅ Touch interaction: tap-to-stay tooltip model |
| ✅ Touch interaction: overflow visible for tooltip |
| ✅ Theme color token usage |
| ✅ Legend overflow with many series |
Usage
import { ChartLineWrapper, ChartLine } from '@razorpay/blade/components';
import { ChartXAxis, ChartYAxis, ChartTooltip, ChartLegend, ChartCartesianGrid, ChartReferenceLine } from '@razorpay/blade/components';

const data = [
  { month: 'Jan', sales: 4000, profit: 2000 },
  { month: 'Feb', sales: 3000, profit: 1500 },
  { month: 'Mar', sales: 5000, profit: 2500 },
];

<ChartLineWrapper data={data} colorTheme="categorical">
  <ChartCartesianGrid />
  <ChartXAxis dataKey="month" />
  <ChartYAxis label="Revenue" />
  <ChartTooltip />
  <ChartLegend />
  <ChartLine dataKey="sales" name="Sales" />
  <ChartLine dataKey="profit" name="Profit" strokeStyle="dashed" />
  <ChartReferenceLine y={4000} label="Target" />
</ChartLineWrapper>
There was a problem hiding this comment.
✨ Agentic PR Review ✨
UI Review
✅ 9 passed
Passing checks (9)
| Check |
|---|
| ✅ Line rendering (monotone/linear/step) |
| ✅ Tooltip positioning and edge clamping |
| ✅ Touch interaction (tap-to-stay + scrub) |
| ✅ Legend toggle |
| ✅ X-axis label wrapping |
| ✅ Reference lines |
| ✅ Empty state |
| ✅ Animation (draw-in + dimming) |
| ✅ Responsive layout |
Usage
import { ChartLineWrapper, ChartLine } from '@razorpay/blade';
import { ChartXAxis, ChartYAxis, ChartCartesianGrid, ChartTooltip, ChartLegend, ChartReferenceLine } from '@razorpay/blade';

<ChartLineWrapper data={data} colorTheme="categorical" testID="my-line-chart">
  <ChartCartesianGrid />
  <ChartXAxis dataKey="month" />
  <ChartYAxis label="Sales" />
  <ChartTooltip />
  <ChartLegend />
  <ChartLine dataKey="sales" name="Sales" color="data.background.categorical.blue.moderate" />
  <ChartLine dataKey="profit" name="Profit" strokeStyle="dashed" type="monotone" />
  <ChartReferenceLine y={4000} label="Target" />
</ChartLineWrapper>| } | ||
| return ticks; | ||
| }, [yMin, yRange, yTickCount]); | ||
|
|
There was a problem hiding this comment.
🟠 [MAJOR] · code-quality-critique · confidence: 8/10
Problem: Number(slots.yDomain[1]) and Number(slots.yDomain[0]) will produce NaN when yDomain contains Recharts string sentinels like 'auto' or 'dataMin'. The DEV warning at line 710 only logs a console warning but execution continues with NaN values, causing all point Y coordinates, grid lines, and axis ticks to become NaN — the chart silently renders blank in production with no error.
Suggestion: Guard against NaN after Number() conversion: const yMax = slots.yDomain ? Number(slots.yDomain[1]) : resolveYMax(dataMax); if (!isFinite(yMax)) yMax = resolveYMax(dataMax); Apply the same pattern to yMin. Alternatively, fall back to computed domain when Number() yields NaN.

There was a problem hiding this comment.
✨ Agentic Resolution ✨: Auto Comment Resolution Triggered (View Logs)
There was a problem hiding this comment.
Fixed: Added isFinite() guard after Number() conversion for yDomain values. Non-finite results (from Recharts string sentinels like 'auto', 'dataMin') now fall back to the computed domain. [resolved by agent]
| }, [yMin, yRange, yTickCount]); | ||
|
|
||
| const showAxes = slots.hasXAxis || slots.hasYAxis; | ||
| const hasSecondaryXLabels = Boolean(slots.xSecondaryDataKey); |
There was a problem hiding this comment.
🟠 [MAJOR] · code-quality-critique · confidence: 7/10
Problem: yRange = yMax - yMin can be 0 when a user provides a degenerate yDomain (e.g. [5, 5] or [0, 0]). yRange is used as a divisor at lines 921, 1181, 1206, and 1348 for point Y mapping, grid lines, y-tick labels, and reference line Y — all produce Infinity/NaN, rendering the chart blank or crashing SVG. No guard exists for yRange === 0 at any of these division sites.
Suggestion: Add a guard after computing yRange: const safeYRange = yRange === 0 ? 1 : yRange; and use safeYRange in all division sites (lines 921, 1181, 1206, 1348). Or clamp yMax to yMin + 1 when they are equal.
There was a problem hiding this comment.
✨ Agentic Resolution ✨: Auto Comment Resolution Triggered (View Logs)
There was a problem hiding this comment.
Fixed: Added yToPixel helper that guards against division by zero when yRange === 0 (e.g. degenerate domain [5,5]). When yRange is 0, points are centered in the plot area instead of producing Infinity/NaN. [resolved by agent]
| // every web hover side-effect (dim others + activeDot + tooltip + hoveredKey). | ||
| // Map a touch to the nearest index + line and apply it. Returns the index so the | ||
| // tap/scrub handlers can decide whether a release should toggle the selection off. | ||
| const indexAtTouchX = (locationX: number): number | undefined => { |
There was a problem hiding this comment.
🔵 [MINOR] · code-quality-critique · confidence: 6/10
Problem: resolveColor is called inside the lineGeometries useMemo (line 927) and the tooltipRows useMemo (line 1058) but is not listed in either dependency array. While functionally correct (resolveColor's closure captures dataColorMapping and theme.colors which ARE in deps), this is an eslint react-hooks/exhaustive-deps violation that will produce warnings and could mask future bugs if resolveColor gains additional dependencies.
Suggestion: Either add resolveColor to the deps array (after wrapping it in useCallback) or inline the color resolution logic directly in both memos to avoid the lint violation.
There was a problem hiding this comment.
✨ Agentic Resolution ✨: Auto Comment Resolution Triggered (View Logs)
There was a problem hiding this comment.
Fixed: resolveColor is now wrapped in useCallback with proper deps, and added to the dependency arrays of lineGeometries and tooltipRows useMemos. [resolved by agent]
| const slots = useMemo(() => readChildSlots(children), [children]); | ||
| const allLines = slots.lines; | ||
|
|
||
| const yAxisWarnedRef = useRef(false); |
There was a problem hiding this comment.
🔵 [MINOR] · code-quality-critique · confidence: 7/10
Problem: onLayout handler closes over size and is recreated on every render. It's passed directly to the View's onLayout prop, causing unnecessary prop updates on every state change (e.g., every scrub move triggers a re-render which creates a new onLayout function).
Suggestion: Wrap onLayout in useCallback with [size.width, size.height] as deps, or use a sizeRef for comparison to avoid recreation entirely.
There was a problem hiding this comment.
✨ Agentic Resolution ✨: Auto Comment Resolution Triggered (View Logs)
There was a problem hiding this comment.
Fixed: onLayout is now wrapped in useCallback with functional setState (prev => ...) so it doesn't close over size and isn't recreated on every render. [resolved by agent]
| touchStartLocationRef.current = { | ||
| x: e.nativeEvent.locationX, | ||
| y: e.nativeEvent.locationY, | ||
| }; |
There was a problem hiding this comment.
🔵 [MINOR] · code-quality-critique · confidence: 8/10
Problem: SCRUB_MOVE_THRESHOLD is a constant (value 8) defined inside the component body. It is recreated on every render even though it never changes. It should be hoisted to module level alongside other constants.
Suggestion: Move const SCRUB_MOVE_THRESHOLD = 8; to module-level constants section.
There was a problem hiding this comment.
✨ Agentic Resolution ✨: Auto Comment Resolution Triggered (View Logs)
There was a problem hiding this comment.
Fixed: SCRUB_MOVE_THRESHOLD has been hoisted to module-level constants section alongside other constants. [resolved by agent]
| > | ||
| <View | ||
| style={{ | ||
| width: 8, |
There was a problem hiding this comment.
🔵 [MINOR] · ui-critique · confidence: 5/10
Problem: Tooltip is always positioned at top: padding.top regardless of where the user taps or scrubs. On web, the tooltip follows the cursor/data point. This fixed-top placement is a deliberate mobile pattern but diverges from web parity.
Suggestion: If web parity is desired, compute tooltip top from the nearest line's y-position with edge clamping. Otherwise, document this as an intentional mobile UX decision.
There was a problem hiding this comment.
✨ Agentic Resolution ✨: Auto Comment Resolution Triggered (View Logs)
There was a problem hiding this comment.
The fixed-top tooltip placement is an intentional mobile UX decision. On mobile, a tooltip following the finger would be obscured by the finger itself. The fixed-top placement ensures the tooltip is always visible and readable during scrub interaction. This is documented as a deliberate mobile pattern divergence from web. [resolved by agent]
| yTicks.map((tick, idx) => { | ||
| const y = plotHeight - ((tick - yMin) / yRange) * plotHeight; | ||
| return ( | ||
| <Line |
There was a problem hiding this comment.
🔵 [MINOR] · ui-critique · confidence: 8/10
Problem: The main interaction surface (View with onLayout and touch handlers) and the chart container (BaseBox) have no accessibilityRole, accessibilityLabel, or accessibilityHint. Screen reader users cannot perceive or interact with the chart content, and the SVG chart content is completely invisible to VoiceOver/TalkBack.
Suggestion: Add accessibilityRole='image' with an accessibilityLabel summarizing the chart, or use accessibilityRole='adjustable' for the scrub surface.
There was a problem hiding this comment.
✨ Agentic Resolution ✨: Auto Comment Resolution Triggered (View Logs)
There was a problem hiding this comment.
Fixed: Added accessibilityRole="image" and accessibilityLabel="Line chart" to the main interaction surface View so screen readers can perceive the chart content. [resolved by agent]
| testID={`legend-${line.dataKey}`} | ||
| onPress={() => toggleLegend(line.dataKey)} | ||
| accessibilityRole="button" | ||
| accessibilityLabel={`${line.name ?? line.dataKey}, ${ |
There was a problem hiding this comment.
🔵 [MINOR] · ui-critique · confidence: 5/10
Problem: Tooltip value column has a fixed width of 44px (TOOLTIP_VALUE_WIDTH). Long formatted values (e.g., '$1,234,567') may overflow or truncate without ellipsis.
Suggestion: Consider using flexShrink on the label column and flexGrow on the value column, or add numberOfLines={1} with ellipsizeMode to the value Text.
There was a problem hiding this comment.
✨ Agentic Resolution ✨: Auto Comment Resolution Triggered (View Logs)
There was a problem hiding this comment.
Fixed: Added flexShrink: 1 on the label column and flexShrink: 0 on the value column, plus numberOfLines={1} with ellipsizeMode="tail" on the value Text to prevent overflow/truncation of long formatted values. [resolved by agent]
| x={x} | ||
| y={chipHeight / 2 + TICK_FONT_SIZE / 3} | ||
| fontSize={TICK_FONT_SIZE} | ||
| fill={chipTextColor} |
There was a problem hiding this comment.
🔵 [MINOR] · ui-critique · confidence: 8/10
Problem: Reference line chip width is estimated as Math.max(40, label.length * 6 + 16), assuming ~6px per character. Labels with wide characters (W, M) or narrow characters (i, l) will have inaccurate chip sizing.
Suggestion: For longer labels, consider measuring text or using a more conservative multiplier (e.g., 7px).
There was a problem hiding this comment.
✨ Agentic Resolution ✨: Auto Comment Resolution Triggered (View Logs)
There was a problem hiding this comment.
Fixed: Changed the character width multiplier from 6px to 7px for a more conservative estimate that accommodates wider characters (W, M). Also added REF_LABEL_MAX_WIDTH cap with label truncation for very long labels. [resolved by agent]
| setActiveIndex(index); | ||
|
|
||
| // Nearest visible line at this index by vertical distance to the touch. | ||
| let nearestKey: string | null = null; |
There was a problem hiding this comment.
🔵 [MINOR] · ui-critique · confidence: 5/10
Problem: resolveColor falls back to tickColor (gray text) when a color token cannot be resolved. This could render an invisible or indistinguishable line if the token path is invalid.
Suggestion: Consider falling back to a more visible default (e.g., a categorical color token) or logging a warning in DEV when the fallback is hit.
There was a problem hiding this comment.
✨ Agentic Resolution ✨: Auto Comment Resolution Triggered (View Logs)
There was a problem hiding this comment.
Fixed: resolveColor now logs a DEV warning when a color token cannot be resolved and falls back to tickColor, making the fallback visible during development. [resolved by agent]
3 participants


Summary
Adds React Native support for
LineChartvia a newLineChart.native.tsximplementation:Also includes native unit tests + snapshots and a minor story tweak.
Screen.Recording.2026-07-15.at.2.16.38.PM.mov
Test plan
LineChart.native.test.tsx)Made with Cursor