Summary
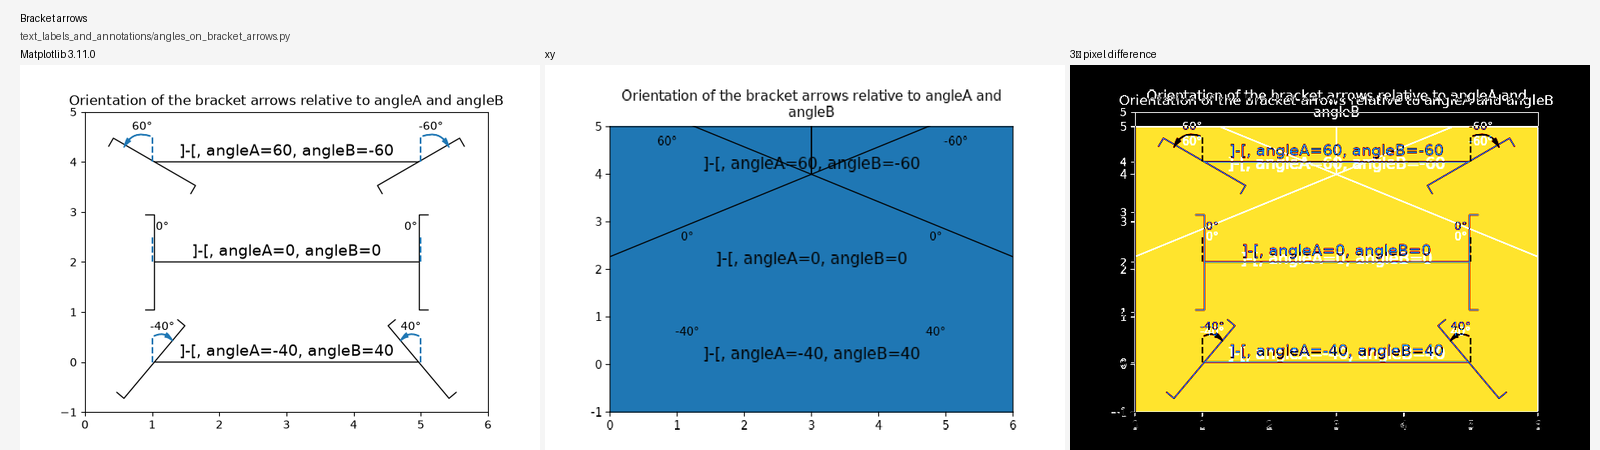
The official Matplotlib text_labels_and_annotations/angles_on_bracket_arrows.py gallery example completes under xy.pyplot, but open FancyArrowPatch bracket arrows are filled as large solid polygons. The fills cover most of the axes and turn curved connectors into diagonal polygon edges.
Environment
xy: d505ef5789d8b18e23fd838300b039932dc399ce- Matplotlib reference:
3.11.0
- Python:
3.14.5
- source:
text_labels_and_annotations/angles_on_bracket_arrows.py from the supplied Matplotlib stable gallery_python.zip
Full Matplotlib example
Verbatim source from the supplied archive:
"""
===================================
Angle annotations on bracket arrows
===================================

This example shows how to add angle annotations to bracket arrow styles
created using `.FancyArrowPatch`. *angleA* and *angleB* are measured from a
vertical line as positive (to the left) or negative (to the right). Blue
`.FancyArrowPatch` arrows indicate the directions of *angleA* and *angleB*
from the vertical and axes text annotate the angle sizes.
"""

import matplotlib.pyplot as plt
import numpy as np

from matplotlib.patches import FancyArrowPatch


def get_point_of_rotated_vertical(origin, line_length, degrees):
    """Return xy coordinates of the vertical line end rotated by degrees."""
    rad = np.deg2rad(-degrees)
    return [origin[0] + line_length * np.sin(rad),
            origin[1] + line_length * np.cos(rad)]


fig, ax = plt.subplots()
ax.set(xlim=(0, 6), ylim=(-1, 5))
ax.set_title("Orientation of the bracket arrows relative to angleA and angleB")

style = ']-['
for i, angle in enumerate([-40, 0, 60]):
    y = 2*i
    arrow_centers = ((1, y), (5, y))
    vlines = ((1, y + 0.5), (5, y + 0.5))
    anglesAB = (angle, -angle)
    bracketstyle = f"{style}, angleA={anglesAB[0]}, angleB={anglesAB[1]}"
    bracket = FancyArrowPatch(*arrow_centers, arrowstyle=bracketstyle,
                              mutation_scale=42)
    ax.add_patch(bracket)
    ax.text(3, y + 0.05, bracketstyle, ha="center", va="bottom", fontsize=14)
    ax.vlines([line[0] for line in vlines], [y, y], [line[1] for line in vlines],
              linestyles="--", color="C0")
    # Get the top coordinates for the drawn patches at A and B
    patch_tops = [get_point_of_rotated_vertical(center, 0.5, angle)
                  for center, angle in zip(arrow_centers, anglesAB)]
    # Define the connection directions for the annotation arrows
    connection_dirs = (1, -1) if angle > 0 else (-1, 1)
    # Add arrows and annotation text
    arrowstyle = "Simple, tail_width=0.5, head_width=4, head_length=8"
    for vline, dir, patch_top, angle in zip(vlines, connection_dirs,
                                            patch_tops, anglesAB):
        kw = dict(connectionstyle=f"arc3,rad={dir * 0.5}",
                  arrowstyle=arrowstyle, color="C0")
        ax.add_patch(FancyArrowPatch(vline, patch_top, **kw))
        ax.text(vline[0] - dir * 0.15, y + 0.7, f'{angle}°', ha="center",
                va="center")

plt.show()

# %%
#
# .. admonition:: References
#
#    The use of the following functions, methods, classes and modules is shown
#    in this example:
#
#    - `matplotlib.patches.ArrowStyle`
Reproduction with xy
Run the complete source above after changing only:
import matplotlib.pyplot as plt
to:
Expected
The open bracket strokes and curved annotation arrows render without a filled interior, matching the Matplotlib geometry.
Actual
Large blue filled polygons cover roughly 60% of the canvas. In the pixel audit, 60.40% of pixels differ from the Matplotlib reference (mean absolute channel error 64.02); both outputs are 640×480.
Screenshot
Matplotlib 3.11.0 / xy / 3×-contrast pixel difference:
Full evidence provenance: https://github.com/reflex-dev/xy/blob/32993475aa208a5b321bd15081848340f7e61bf3/review-evidence/pyplot-gallery-audit-2026-07-30/README.md
Summary
The official Matplotlib
text_labels_and_annotations/angles_on_bracket_arrows.pygallery example completes underxy.pyplot, but openFancyArrowPatchbracket arrows are filled as large solid polygons. The fills cover most of the axes and turn curved connectors into diagonal polygon edges.Environment
xy:d505ef5789d8b18e23fd838300b039932dc399ce3.11.03.14.5text_labels_and_annotations/angles_on_bracket_arrows.pyfrom the supplied Matplotlib stablegallery_python.zipFull Matplotlib example
Verbatim source from the supplied archive:
Reproduction with xy
Run the complete source above after changing only:
to:
Expected
The open bracket strokes and curved annotation arrows render without a filled interior, matching the Matplotlib geometry.
Actual
Large blue filled polygons cover roughly 60% of the canvas. In the pixel audit, 60.40% of pixels differ from the Matplotlib reference (mean absolute channel error 64.02); both outputs are 640×480.
Screenshot
Matplotlib 3.11.0 / xy / 3×-contrast pixel difference:
Full evidence provenance: https://github.com/reflex-dev/xy/blob/32993475aa208a5b321bd15081848340f7e61bf3/review-evidence/pyplot-gallery-audit-2026-07-30/README.md