Problem
A pyplot-compatible browser canvas must do more than display a static screenshot. Matplotlib examples rely on coordinate status text, cursor changes, navigation, resize/close semantics, picking, widgets, timers, and Python callbacks. Missing or incomplete event fields can render the initial chart while silently breaking interaction.
The standard gallery contract currently identifies 71 behavior-required examples. PR #413 adds the live XY canvas/manager bridge and fail-closed behavior evidence.
Comparisons
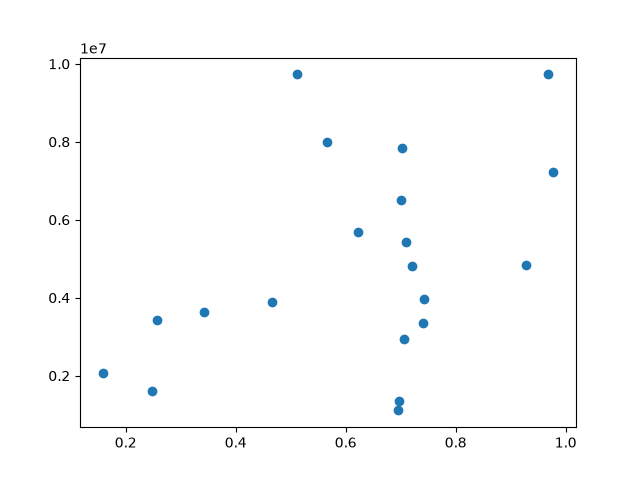
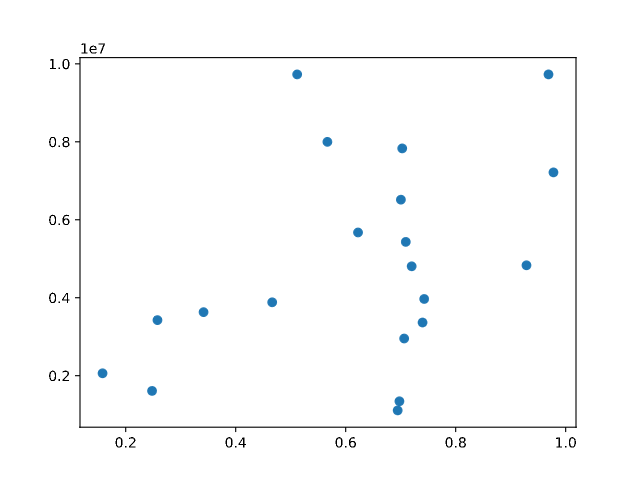
Coordinate status
| Matplotlib |
xy.pyplot |
 |
 |
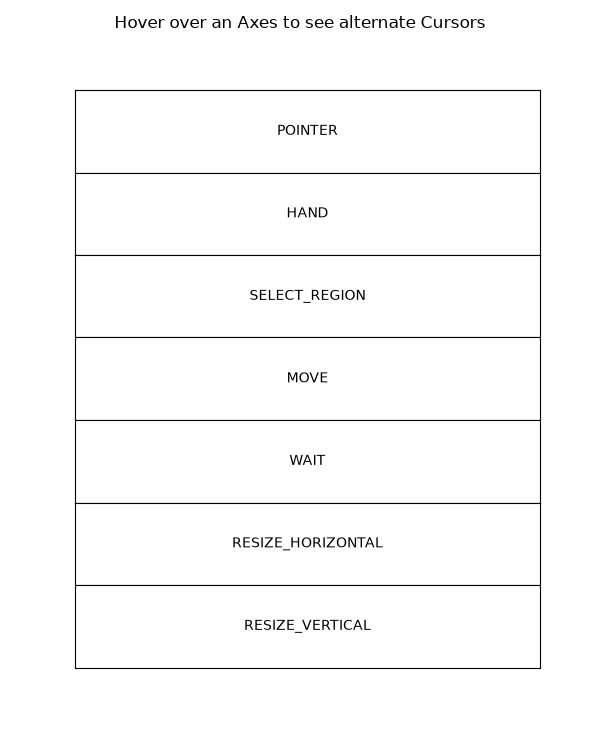
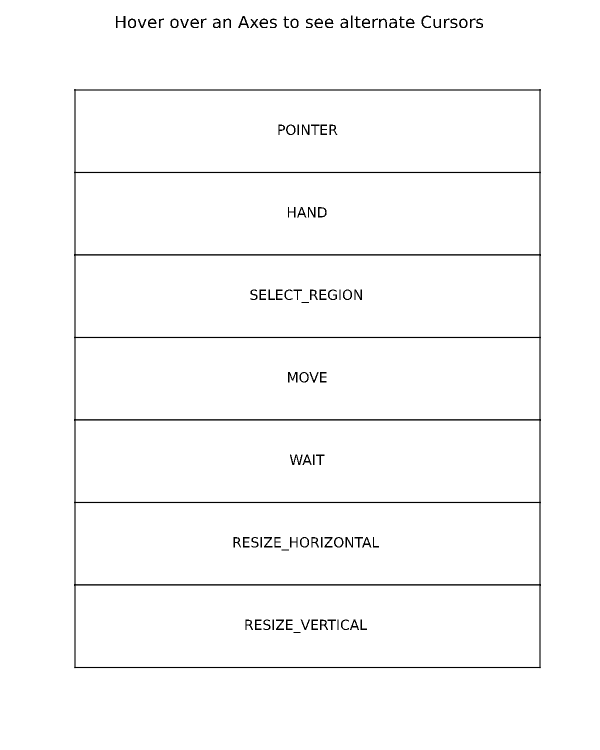
Mouse cursor
| Matplotlib |
xy.pyplot |
 |
 |
Live browser host
| Chart |
Event diagnostics |
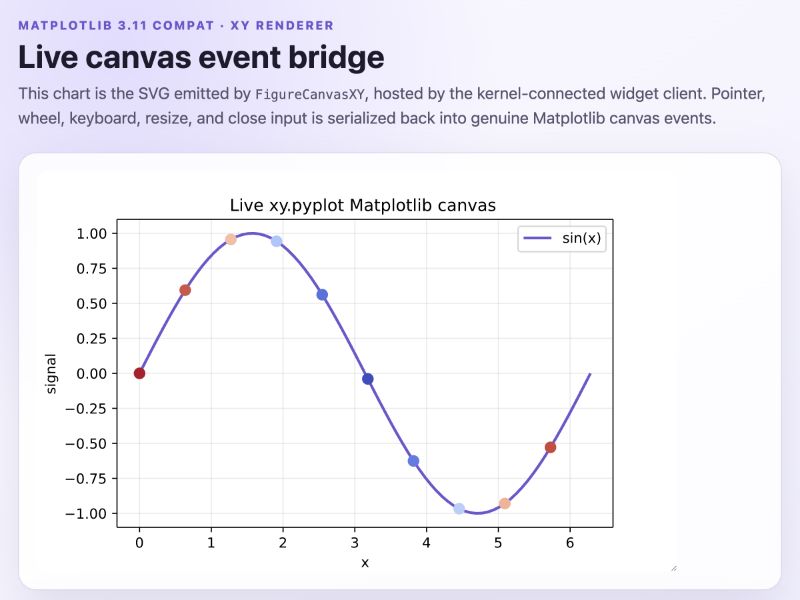 |
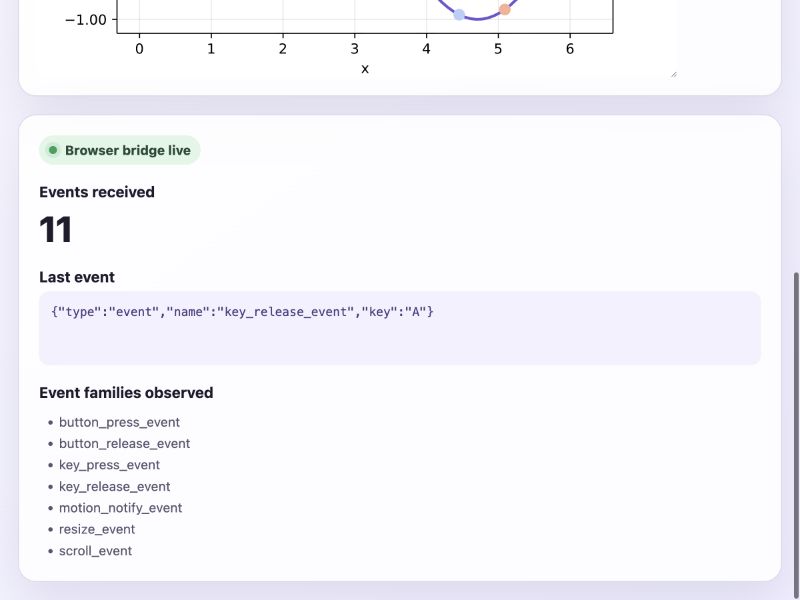 |
Complete upstream Matplotlib examples
misc/coords_report.py
"""
=============
Coords Report
=============

Override the default reporting of coords as the mouse moves over the Axes
in an interactive backend.
"""

import matplotlib.pyplot as plt
import numpy as np


def millions(x):
    return '$%1.1fM' % (x * 1e-6)


# Fixing random state for reproducibility
np.random.seed(19680801)

x = np.random.rand(20)
y = 1e7 * np.random.rand(20)

fig, ax = plt.subplots()
ax.fmt_ydata = millions
plt.plot(x, y, 'o')

plt.show()
widgets/mouse_cursor.py
"""
============
Mouse Cursor
============

This example sets an alternative cursor on a figure canvas.

Note, this is an interactive example, and must be run to see the effect.
"""

import matplotlib.pyplot as plt

from matplotlib.backend_tools import Cursors

fig, axs = plt.subplots(len(Cursors), figsize=(6, len(Cursors) + 0.5),
                        gridspec_kw={'hspace': 0})
fig.suptitle('Hover over an Axes to see alternate Cursors')

for cursor, ax in zip(Cursors, axs):
    ax.cursor_to_use = cursor
    ax.text(0.5, 0.5, cursor.name,
            horizontalalignment='center', verticalalignment='center')
    ax.set(xticks=[], yticks=[])


def hover(event):
    if fig.canvas.widgetlock.locked():
        # Don't do anything if the zoom/pan tools have been enabled.
        return

    fig.canvas.set_cursor(
        event.inaxes.cursor_to_use if event.inaxes else Cursors.POINTER)


fig.canvas.mpl_connect('motion_notify_event', hover)

plt.show()

# %%
#
# .. admonition:: References
#
#    The use of the following functions, methods, classes and modules is shown
#    in this example:
#
#    - `matplotlib.backend_bases.FigureCanvasBase.set_cursor`
Acceptance
mpl_connect and mpl_disconnect work through the browser canvas.- Pointer, keyboard, scroll, resize, close, pick, and navigation events expose Matplotlib-compatible fields and coordinate transforms.
- Status text and cursor changes update from live browser events.
- Widgets, timers,
draw, draw_idle, and full-redraw blit work without swallowed callback exceptions.
- All 71 behavior-required standard examples pass deterministic behavior gates with zero waivers.
Problem
A pyplot-compatible browser canvas must do more than display a static screenshot. Matplotlib examples rely on coordinate status text, cursor changes, navigation, resize/close semantics, picking, widgets, timers, and Python callbacks. Missing or incomplete event fields can render the initial chart while silently breaking interaction.
The standard gallery contract currently identifies 71 behavior-required examples. PR #413 adds the live XY canvas/manager bridge and fail-closed behavior evidence.
Comparisons
Coordinate status
xy.pyplotMouse cursor
xy.pyplotLive browser host
Complete upstream Matplotlib examples
misc/coords_report.pywidgets/mouse_cursor.pyAcceptance
mpl_connectandmpl_disconnectwork through the browser canvas.draw,draw_idle, and full-redrawblitwork without swallowed callback exceptions.