Problem
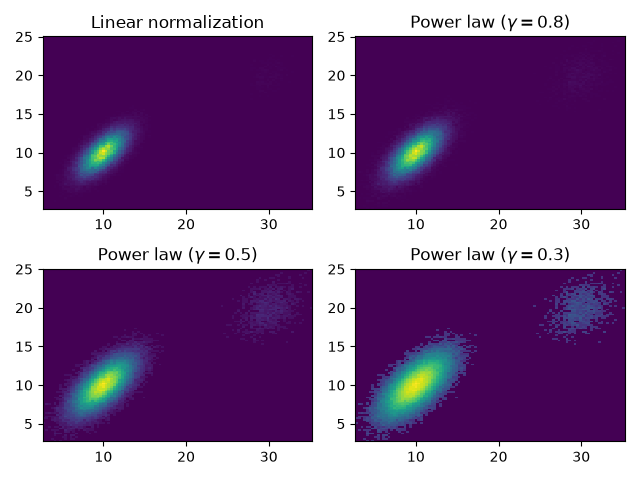
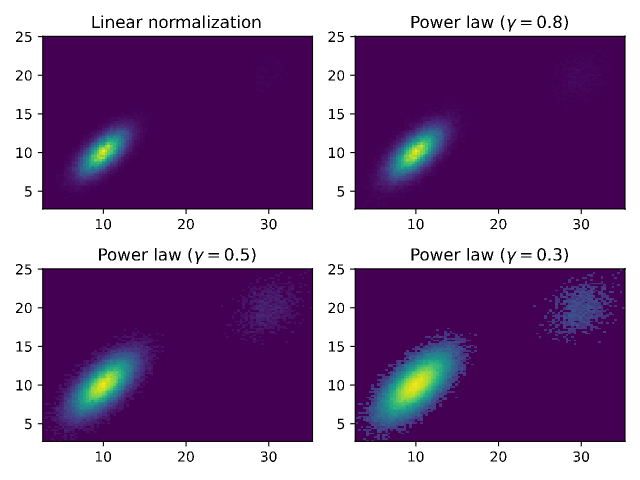
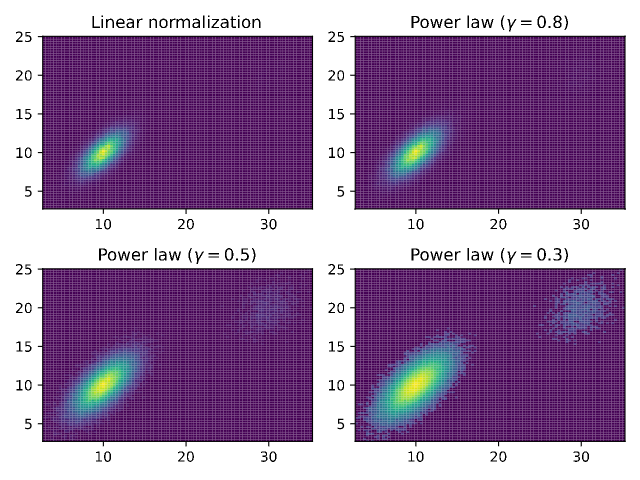
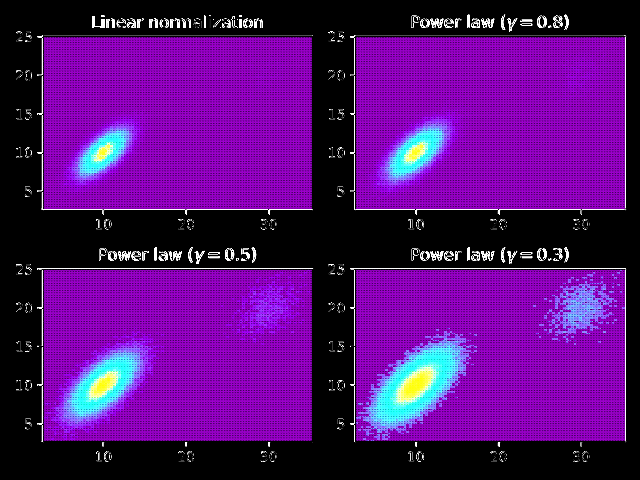
The XY rasterizer used to stroke the shared edges of adjacent mesh cells. That produced visible grid seams in filled pcolormesh and hist2d output even when Matplotlib renders a continuous field.
This root cause directly affects 11 gallery examples using pcolormesh or hist2d, and can affect any downstream QuadMesh rendering.
Comparison
| Matplotlib |
Corrected xy.pyplot |
 |
 |
| Before |
Difference |
 |
 |
The implementation and regression gates are in PR #413.
Complete upstream Matplotlib example
Source: scales/power_norm.py from the supplied Matplotlib 3.11.1 gallery archive.
"""
========================
Exploring normalizations
========================

Various normalization on a multivariate normal distribution.

"""

import matplotlib.pyplot as plt
import numpy as np
from numpy.random import multivariate_normal

import matplotlib.colors as mcolors

# Fixing random state for reproducibility.
np.random.seed(19680801)

data = np.vstack([
    multivariate_normal([10, 10], [[3, 2], [2, 3]], size=100000),
    multivariate_normal([30, 20], [[3, 1], [1, 3]], size=1000)
])

gammas = [0.8, 0.5, 0.3]

fig, axs = plt.subplots(nrows=2, ncols=2)

axs[0, 0].set_title('Linear normalization')
axs[0, 0].hist2d(data[:, 0], data[:, 1], bins=100)

for ax, gamma in zip(axs.flat[1:], gammas):
    ax.set_title(r'Power law $(\gamma=%1.1f)$' % gamma)
    ax.hist2d(data[:, 0], data[:, 1], bins=100, norm=mcolors.PowerNorm(gamma))

fig.tight_layout()

plt.show()

# %%
#
# .. admonition:: References
#
#    The use of the following functions, methods, classes and modules is shown
#    in this example:
#
#    - `matplotlib.colors`
#    - `matplotlib.colors.PowerNorm`
#    - `matplotlib.axes.Axes.hist2d`
#    - `matplotlib.pyplot.hist2d`
Acceptance
- Adjacent mesh cells are filled without unintended boundary strokes.
- Intentional user-specified edges remain supported.
- Mesh geometry, normalization, colorbar, labels, and limits match the Matplotlib structure.
- The filled-vector visual gate passes without a waiver or Matplotlib-renderer fallback.
- All 11 directly affected gallery examples remain ratcheted green.
Problem
The XY rasterizer used to stroke the shared edges of adjacent mesh cells. That produced visible grid seams in filled
pcolormeshandhist2doutput even when Matplotlib renders a continuous field.This root cause directly affects 11 gallery examples using
pcolormeshorhist2d, and can affect any downstream QuadMesh rendering.Comparison
xy.pyplotThe implementation and regression gates are in PR #413.
Complete upstream Matplotlib example
Source:
scales/power_norm.pyfrom the supplied Matplotlib 3.11.1 gallery archive.Acceptance