Problem
Reaching the end of a script is not proof that an interactive Matplotlib example works. A callback can raise after the initial draw, a selector can fail to mutate its artists, or a small patch-version API change can make a reference example fail before XY is evaluated.
The gallery contract in PR #413 now drives required interactions deterministically, records behavioral evidence, fails on callback exceptions or unchanged required state, and confines version adaptation to an exact source/engine/version match.
The supplied 3.11.1 resample.py source needs one audited Matplotlib-3.11.0 reference-only adapter for the FillBetweenPolyCollection.set_data signature. No adapter is applied to XY, other files, or other versions.
Comparisons
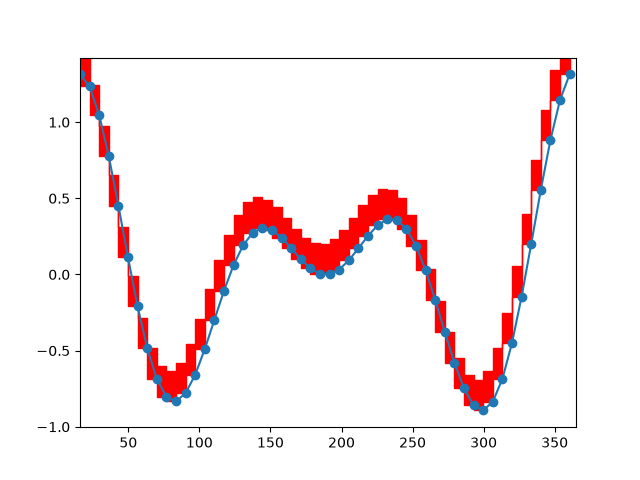
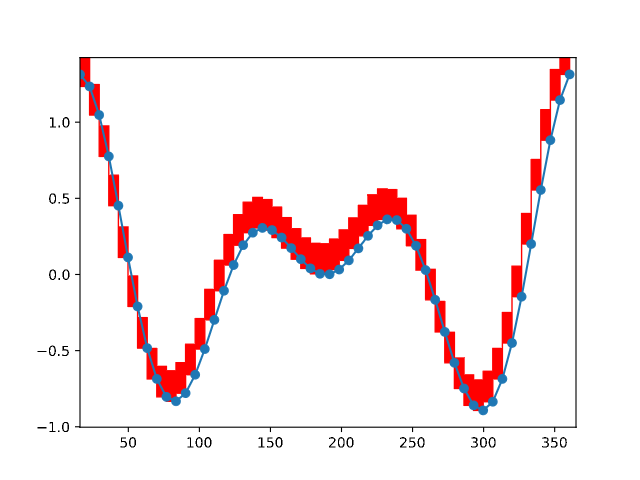
Resample callback
| Matplotlib |
xy.pyplot |
 |
 |
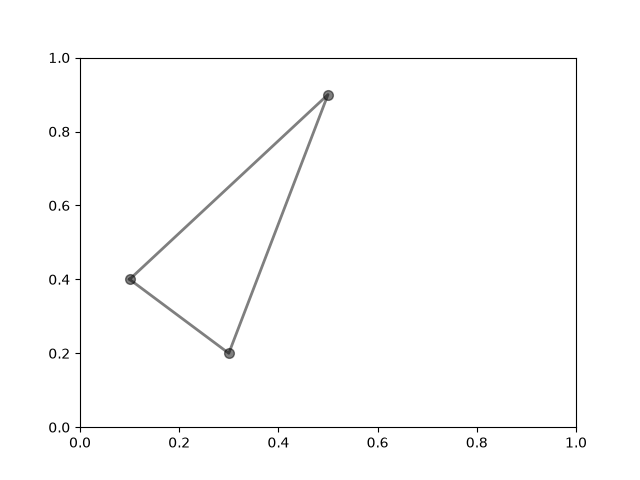
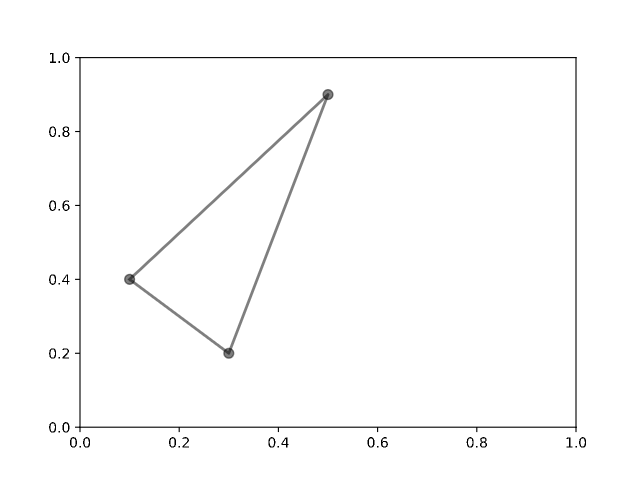
Polygon selector
| Matplotlib |
xy.pyplot |
 |
 |
Complete upstream Matplotlib examples
event_handling/resample.py
"""
===============
Resampling Data
===============

Downsampling lowers the sample rate or sample size of a signal. In
this tutorial, the signal is downsampled when the plot is adjusted
through dragging and zooming.

.. note::
    This example exercises the interactive capabilities of Matplotlib, and this
    will not appear in the static documentation. Please run this code on your
    machine to see the interactivity.

    You can copy and paste individual parts, or download the entire example
    using the link at the bottom of the page.
"""

import matplotlib.pyplot as plt
import numpy as np


# A class that will downsample the data and recompute when zoomed.
class DataDisplayDownsampler:
    def __init__(self, xdata, y1data, y2data):
        self.origY1Data = y1data
        self.origY2Data = y2data
        self.origXData = xdata
        self.max_points = 50
        self.delta = xdata[-1] - xdata[0]

    def plot(self, ax):
        x, y1, y2 = self._downsample(self.origXData.min(), self.origXData.max())
        (self.line,) = ax.plot(x, y1, 'o-')
        self.poly_collection = ax.fill_between(x, y1, y2, step="pre", color="r")

    def _downsample(self, xstart, xend):
        # get the points in the view range
        mask = (self.origXData > xstart) & (self.origXData < xend)
        # dilate the mask by one to catch the points just outside
        # of the view range to not truncate the line
        mask = np.convolve([1, 1, 1], mask, mode='same').astype(bool)
        # sort out how many points to drop
        ratio = max(np.sum(mask) // self.max_points, 1)

        # mask data
        xdata = self.origXData[mask]
        y1data = self.origY1Data[mask]
        y2data = self.origY2Data[mask]

        # downsample data
        xdata = xdata[::ratio]
        y1data = y1data[::ratio]
        y2data = y2data[::ratio]

        print(f"using {len(y1data)} of {np.sum(mask)} visible points")

        return xdata, y1data, y2data

    def update(self, ax):
        # Update the artists
        lims = ax.viewLim
        if abs(lims.width - self.delta) > 1e-8:
            self.delta = lims.width
            xstart, xend = lims.intervalx
            x, y1, y2 = self._downsample(xstart, xend)
            self.line.set_data(x, y1)
            self.poly_collection.set_data(x, y1, y2, step="pre")
            ax.figure.canvas.draw_idle()


# Create a signal
xdata = np.linspace(16, 365, (365-16)*4)
y1data = np.sin(2*np.pi*xdata/153) + np.cos(2*np.pi*xdata/127)
y2data = y1data + .2

d = DataDisplayDownsampler(xdata, y1data, y2data)

fig, ax = plt.subplots()

# Hook up the line
d.plot(ax)
ax.set_autoscale_on(False)  # Otherwise, infinite loop

# Connect for changing the view limits
ax.callbacks.connect('xlim_changed', d.update)
ax.set_xlim(16, 365)
plt.show()

# %%
# .. tags:: interactivity: zoom, interactivity: event-handling
widgets/polygon_selector_simple.py
"""
================
Polygon Selector
================

Shows how to create a polygon programmatically or interactively
"""

import matplotlib.pyplot as plt

from matplotlib.widgets import PolygonSelector

# %%
#
# To create the polygon programmatically
fig, ax = plt.subplots()
fig.show()

selector = PolygonSelector(ax, lambda *args: None)

# Add three vertices
selector.verts = [(0.1, 0.4), (0.5, 0.9), (0.3, 0.2)]


# %%
#
# To create the polygon interactively

fig2, ax2 = plt.subplots()
fig2.show()

selector2 = PolygonSelector(ax2, lambda *args: None)

print("Click on the figure to create a polygon.")
print("Press the 'esc' key to start a new polygon.")
print("Try holding the 'shift' key to move all of the vertices.")
print("Try holding the 'ctrl' key to move a single vertex.")


# %%
# .. tags::
#
#    component: axes,
#    styling: position,
#    plot-type: line,
#    level: intermediate,
#    domain: cartography,
#    domain: geometry,
#    domain: statistics,
#
# .. admonition:: References
#
#    The use of the following functions, methods, classes and modules is shown
#    in this example:
#
#    - `matplotlib.widgets.PolygonSelector`
Acceptance
- Callback exceptions fail the example even if initial rendering succeeded.
- Required widget, event, and animation interactions produce changed semantic or device-space evidence.
- Animation tests drive initial, middle, and final frames plus timer/callback behavior.
- Version adapters are allowlisted by exact source hash, engine, and Matplotlib version and are reported in provenance.
- Acceptance rejects unapproved adapters, fallbacks, and waivers.
- The 71-example standard behavior gate remains fully green.
Problem
Reaching the end of a script is not proof that an interactive Matplotlib example works. A callback can raise after the initial draw, a selector can fail to mutate its artists, or a small patch-version API change can make a reference example fail before XY is evaluated.
The gallery contract in PR #413 now drives required interactions deterministically, records behavioral evidence, fails on callback exceptions or unchanged required state, and confines version adaptation to an exact source/engine/version match.
The supplied 3.11.1
resample.pysource needs one audited Matplotlib-3.11.0 reference-only adapter for theFillBetweenPolyCollection.set_datasignature. No adapter is applied to XY, other files, or other versions.Comparisons
Resample callback
xy.pyplotPolygon selector
xy.pyplotComplete upstream Matplotlib examples
event_handling/resample.pywidgets/polygon_selector_simple.pyAcceptance