Welcome to the Python Software Carpentries training. Please follow these instructions to set up your environment before the workshop.
- Python 3.x installed on your computer
- Internet connection for downloading files
- Terminal (in Linux or MacOS), Powershell (Windows) command Line access
Python is not pre-installed on Windows, so you'll need to install it:
-
Download Python:
- Visit https://www.python.org/downloads/
- Download the latest Python 3.x installer (Python 3.11 or newer recommended)
-
Run the Installer:
- Double-click the downloaded
.exefile - Important: Check the box "Add Python to PATH" at the bottom
- Click "Install Now"
- Double-click the downloaded
-
Verify Installation:
- Open PowerShell or Command Prompt
- Run:
python --version - You should see something like
Python 3.11.x
Python 3 is already pre-installed on most modern macOS and Linux systems. To verify, run following command in your Terminal:
python3 --versionIf Python 3 is not installed or you need a newer version:
- macOS: Download from python.org or use Homebrew:
brew install python@3 - Linux: Use your package manager (e.g.,
sudo apt install python3 python3-pip python3-venvon Ubuntu/Debian)
-
Create a directory called
swc-python, preferably in your Desktop for easier finding. -
Download the data and code files using the following links for code and data.
-
Extract both zip files and move them to
swc-python -
Download the
requirements.txtfrom this repository file into yourswc-pythondirectory. Alternatively, create arequirements.txtfile with the following content:numpy jupyterlab matplotlib -
Open Terminal/Powershell into
swc-pythondirectory. Then, create a Python virtual environment:python -m venv venv
-
Activate the virtual environment:
On macOS/Linux:
source venv/bin/activateOn Windows:
venv\Scripts\activate
You should see
(venv)appear at the beginning of your terminal prompt. -
Install the required Python packages:
pip install -r requirements.txt
-
Launch Jupyter Lab:
jupyter lab
This will open Jupyter Lab in your default web browser. You're now ready to start coding!
To verify your setup is correct, ensure:
- You are in the
swc-pythondirectory - The virtual environment is activated (you see
(venv)in your prompt) - All packages are installed without errors
- Jupyter Lab opens in your browser
If python doesn't work, try python3 instead:
python3 -m venv venvIf you encounter permission errors during installation, ensure your virtual environment is activated.
Make sure you've installed all packages from requirements.txt and your virtual environment is activated.
If you encounter any issues during setup, please contact your instructor before the workshop begins.
When you're done working, you can deactivate the virtual environment:
deactivateOur imaginary colleague "Dr. Maverick" has invented a new miracle drug that promises to cure arthritis inflammation flare-ups after only 3 weeks since initially taking the medication!
Naturally, we wish to see the clinical trial data, and after months of asking for the data they have finally provided us with a CSV spreadsheet containing the clinical trial data.
The CSV file contains the number of inflammation flare-ups per day for the 60 patients in the initial clinical trial, with the trial lasting 40 days.
Each row corresponds to a patient, and each column corresponds to a day in the trial. Once a patient has their first inflammation flare-up they take the medication and wait a few weeks for it to take effect and reduce flare-ups.
To see how effective the treatment is we would like to:
- Calculate the average inflammation per day across all patients.
- Plot the result to discuss and share with colleagues.
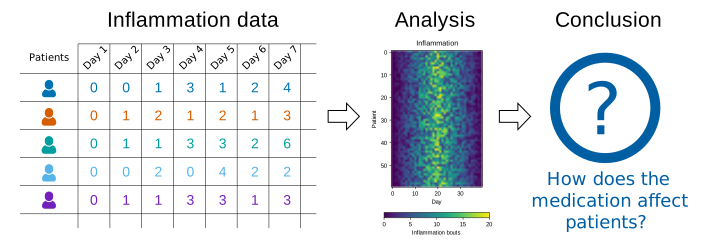
The data sets are stored in comma-separated values (CSV) format:
- each row holds information for a single patient,
- columns represent successive days.
The first three rows of our first file look like this:
0,0,1,3,1,2,4,7,8,3,3,3,10,5,7,4,7,7,12,18,6,13,11,11,7,7,4,6,8,8,4,4,5,7,3,4,2,3,0,0
0,1,2,1,2,1,3,2,2,6,10,11,5,9,4,4,7,16,8,6,18,4,12,5,12,7,11,5,11,3,3,5,4,4,5,5,1,1,0,1
0,1,1,3,3,2,6,2,5,9,5,7,4,5,4,15,5,11,9,10,19,14,12,17,7,12,11,7,4,2,10,5,4,2,2,3,2,2,1,1
- Each number represents the number of inflammation bouts that a particular patient experienced on a given day.
- For example, value
6at row3column7of the data set above means that the third patient was experiencing inflammation six times on the seventh day of the clinical study.