This project focuses on the identification of essential proteins related to cancer using deep learning techniques. The approach combines sequence-based features, entropy metrics, and protein-protein interaction network analysis to classify whether a given protein plays a crucial role in cancer development.
To see a walkthrough of the system and its capabilities in action, watch the project demo video on YouTube:
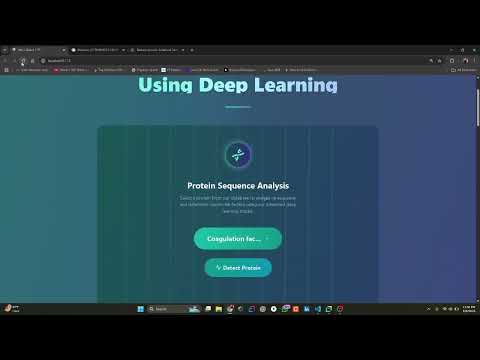
- Input: UniProt ID of a human protein
- Feature Extraction:
- Sequence-based and physicochemical features using Pfeature
- Shannon entropy and residue-wise entropy
- Centrality features from interaction networks
- Modeling: Deep learning classification using TensorFlow/Keras
- Prediction Output:
- Label: Essential (1) or Non-essential (0)
- If essential, retrieves related drugs and supporting web links
This diagram shows the entire pipeline—from the user input, through feature extraction, model inference, and external API integration (UniProt, PubChem, etc.), to the final result presentation.

This illustrates all user interactions, including protein prediction, drug retrieval, and literature or trial lookup.

This shows the step-by-step flow from data submission to final prediction and output visualization, including key branching decisions.

The ERD models key datasets—Proteins, Drugs, Clinical Trials, Prediction Results, and their relationships. It's useful for understanding the underlying database structure.


- Tool Used: Pfeature
- Features Extracted:
- Amino Acid Composition
- Physicochemical Properties
- Shannon Entropy
- Shannon Entropy by Residue
- Network Centrality Measures:
- Degree Centrality
- Betweenness Centrality
- Closeness Centrality
- Eigenvector Centrality
Instead of NetworkX, we used Cytoscape-based tools:
- Cytoscape: Visualization and network management
- CytoNCA: For centrality calculations
- StringApp: To import interaction data from the STRING database
- Framework: TensorFlow/PyTorch
- Optimizer: Adam
- Loss Function: Binary Crossentropy
- Metrics: Accuracy, AUC-ROC
- Confusion Matrix:
- TP (True Positives)
- FP (False Positives)
- TN (True Negatives)
- FN (False Negatives)
- ROC Curve: Receiver Operating Characteristic
- AUC: Area Under Curve
- False Positive Rate
- Precision, Recall, F1 Score


These features were chosen based on biological significance and computational relevance:
- Sequence-based features capture amino acid patterns
- Shannon entropy reflects sequence complexity
- Centrality metrics represent the protein’s role in interaction networks
- These factors are critical in determining protein essentiality in cancer pathways
Shannon entropy measures the randomness in a protein sequence. Proteins with high entropy may have diverse functional regions, suggesting essential biological roles. Residue-wise entropy helps to pinpoint variability at specific positions in the sequence.
- Python
- TensorFlow / Keras
- Pfeature
- Cytoscape + CytoNCA + StringApp
- Pandas, NumPy, Scikit-learn
- Matplotlib / Seaborn (for visualization)
- Expand dataset with more diverse cancer types
- Integrate 3D structural and expression data
- Add interpretability tools to explain model predictions
- Link predictions with clinical drug response data