I'm trying to use an array for the size argument to my umap/scatterplot with the following code
import scanpy.api as sc
import numpy as np
sc.settings.figdir = "testdir"
sc.settings.file_format_figs = "png"
sc.logging.print_versions()
With these libraries
scanpy==1.3.7 anndata==0.6.16 numpy==1.16.1 scipy==1.2.0 pandas==0.23.4 scikit-learn==0.20.2 statsmodels==0.9.0 python-igraph==0.7.1 louvain==0.6.1
Running the following code bit. I use some dummy variable for size.
somedata = sc.datasets.paul15()
sc.pp.pca(somedata)
sc.pp.neighbors(somedata, n_neighbors=4, n_pcs=20)
sc.tl.umap(somedata, spread=1, min_dist=0.1, random_state=42)
sc.tl.leiden(somedata, resolution=0.5, random_state=42)
z = np.abs(somedata.obsm['X_pca'][:,0])**1
sc.pl.umap(somedata, color=['1110007C09Rik'], size=z, cmap='viridis', save='continuous_expr.png')
sc.pl.umap(somedata, color=['leiden'], size=z, cmap='viridis', save='group_value.png')
I get the following two figure as output
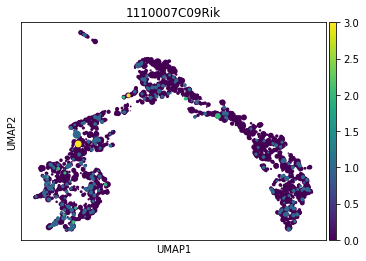
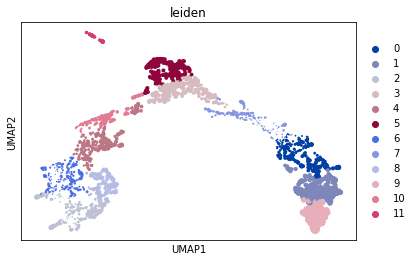
I would expect to see a similar size allocation/distribution but they are very different. I Could not really find a cause for this looking at the scatter plot function so it might be somewhere deeper.
I'm need help with getting some grasp on how to interpret this issue and if possible how to map the size argument to the same data points over different plots.
I'm trying to use an array for the size argument to my umap/scatterplot with the following code
With these libraries
scanpy==1.3.7 anndata==0.6.16 numpy==1.16.1 scipy==1.2.0 pandas==0.23.4 scikit-learn==0.20.2 statsmodels==0.9.0 python-igraph==0.7.1 louvain==0.6.1Running the following code bit. I use some dummy variable for size.
I get the following two figure as output


I would expect to see a similar size allocation/distribution but they are very different. I Could not really find a cause for this looking at the scatter plot function so it might be somewhere deeper.
I'm need help with getting some grasp on how to interpret this issue and if possible how to map the size argument to the same data points over different plots.