


Hydroacoustic echograms using PyPlot.
using EchogramPyPlot
a = rand(100,100)
eg(a)
using SimradEK60
using SimradEK60TestData
using EchogramPyPlot

filename = EK60_SAMPLE
ps = pings(filename)
ps38 = [p for p in ps if p.frequency == 38000]
Sv38 = Sv(ps38)
r38 = R(ps38)

# Traditional echograms

eg(Sv38) # quick echogram
eg(Sv38, vmin=-95,vmax=-50)

# Contemporary echogram

using EchogramColorSchemes
using ColorSchemes
eg(Sv38, vmin=-95, vmax=-50, cmap=addwhite(ColorSchemes.viridis))

# Customise via PyPlot and LaTeXStrings

using PyPlot
using LaTeXStrings
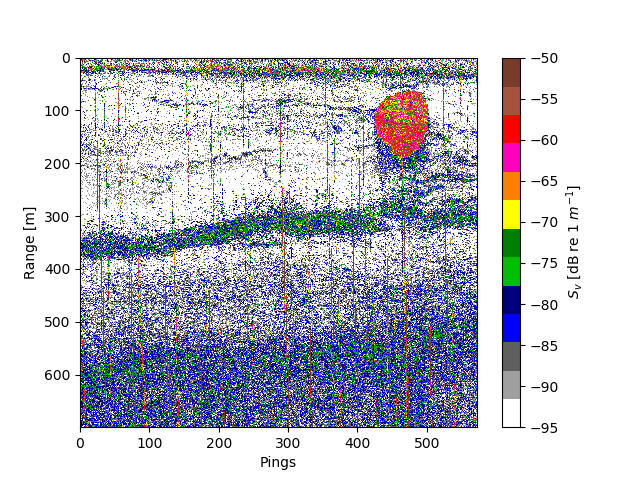
c = addwhite(EchogramColorSchemes.EK500).colors
echogram(Sv38, vmin=-95, vmax=-50, cmap=ColorMap("EK500",c,length(c)), range=maximum(r38))
cbar = PyPlot.colorbar()
cbar[:set_label](L" $S_v$ [dB re 1 $m^{-1}$] ")
xlabel("Pings")
ylabel("Range [m]")