

Using nfl-data-py, we get access to NFL play-by-play data. This codebase details how to analyze this data and use the team logos to visualize relationships.
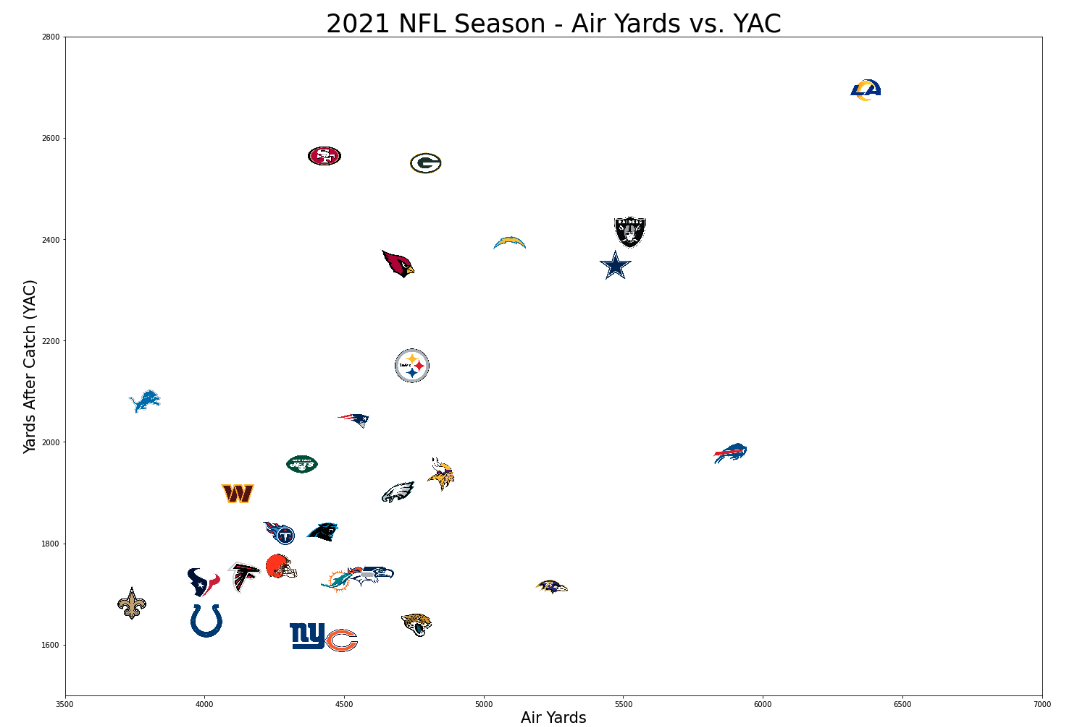
In the 2021 season, teams like the Rams were throwing bombs (high air yards) and getting lots of yards after the catch while teams like the Saints were struggling for YAC and throwing short passes.

EPA stands for expected points added - here's a great article on understanding this concept. We can see the EPA per run and pass plotted above; some teams were efficient running and passing while other offenses were highly specialized.