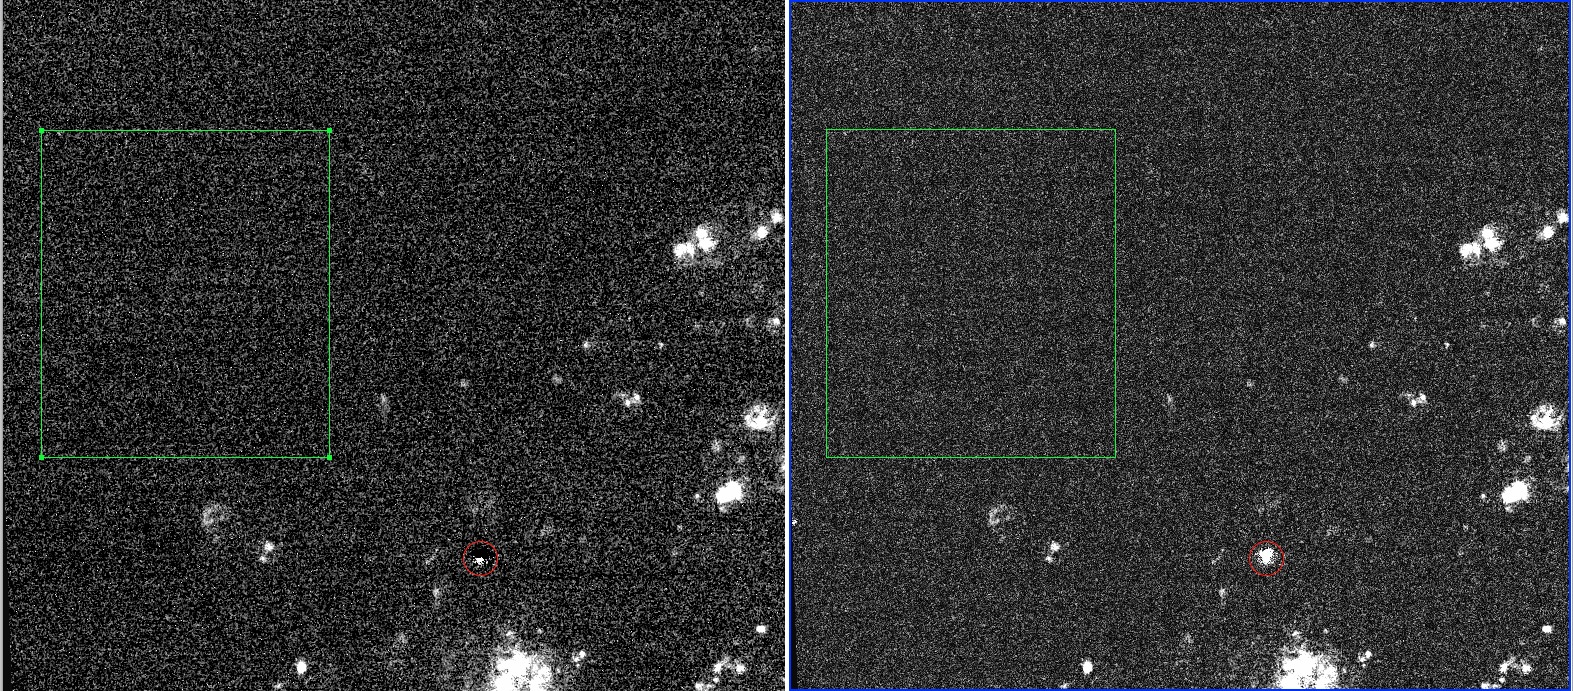
Absolute values of the amplitude are used for the flux calculation. This figure shows the amplitude map (on the left) and the flux map (on the right) for the same region of the galaxy NGC628 [OII]3727 linemaps. The red circles show a star were some negative value are seen on the amplitude map, but only positive values are seen on the flux map. The green boxes show a region of sky (noisy region) where a grid pattern is seen on the flux map and not on the amplitude map.
The level of noise is probably varying following that grid pattern (beeing sometimes lower and higher, maybe due to the dark?).
The absolute value should not be taken for the flux. The measurement of the dispersion of the noise in sky areas is biased toward a lower value.