GrU - Graph Utils for Python
Easily plot all data structures with a unique constructor
from GrU import GrU

gru_list = GrU([0,1,2,3,4])
gru_array = GrU(np.array([0,1,2,3,4]))
gru_2D_array = GrU(np.array([[0,1,2,3,4], [5,6,7,8,9]]), labels=['My first array', 'My second array'])
gru_series = GrU(pd.Series([0,1,2,3,4], index=[10,20,30,40,50]))
gru_dataframe = GrU(pd.DataFrame(np.array([[0,1,2,3,4], [5,6,7,8,9]]).T, columns=['My first column', 'My second column']))
Then, you can plot your GrU object using a compatible method:
gru_object.line()
gru_object.hist()
gru_object.heatmap()
gru_object.image()
There is also a high-level API:
from GrU.io import gru

gru_object = gru(my_object)

#Pandas specific methods
gru_series = my_series.gru()
gru_dataframe = my_dataframe.gru()
As well as high-level plotting functions
from GrU.io import gline, ghist

fig_line = gline(my_object)
fig_hist = ghist(my_object)

# Or, for pandas objects
my_series.gline()

# Which is equivalent to:
GrU(my_series).line()my_array = np.sort(np.random.random((4,50))**2)
gru(my_array).line("Squared uniform distributions")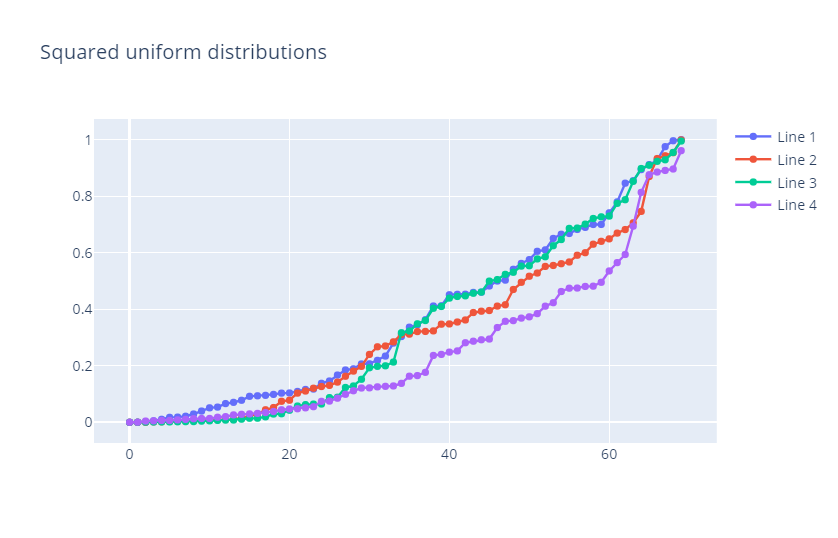
random_walks = pd.DataFrame(np.cumsum(np.random.random((5,1000))*2-1, axis=1).T, index=pd.date_range('08/06/2019', '05/01/2022'))
random_walks.gline(mode='lines', title='Random walk trajectories').show()
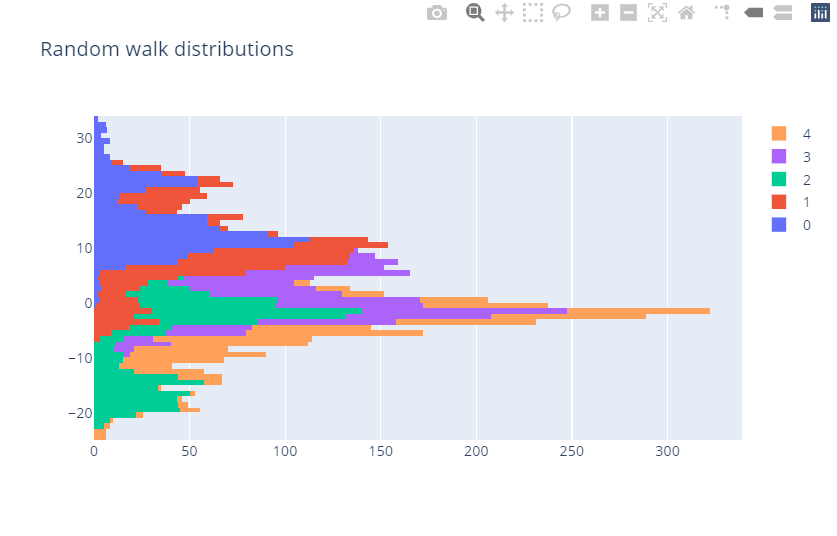
random_walks.ghist(horizontal=True, barmode='stack', title='Random walk distributions').show()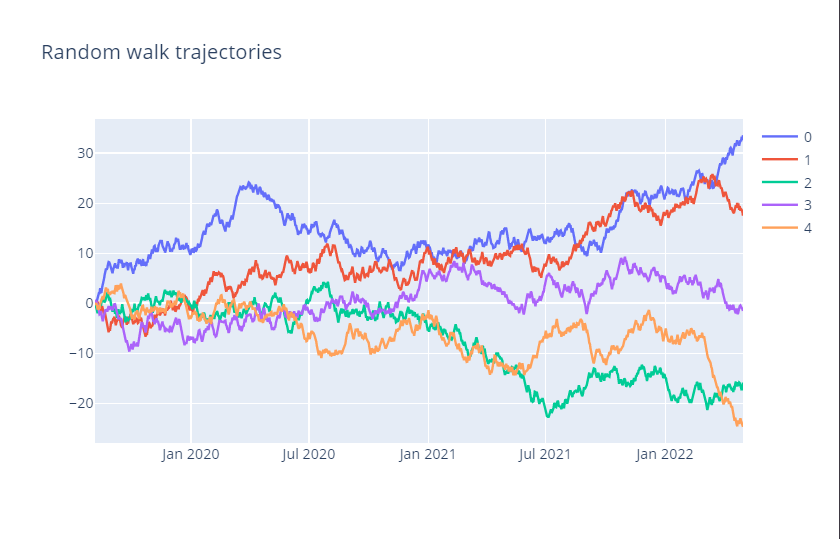
PI = [int(e) for e in """3.1415926535897932384626433832795028841[...]""".replace('.','')]
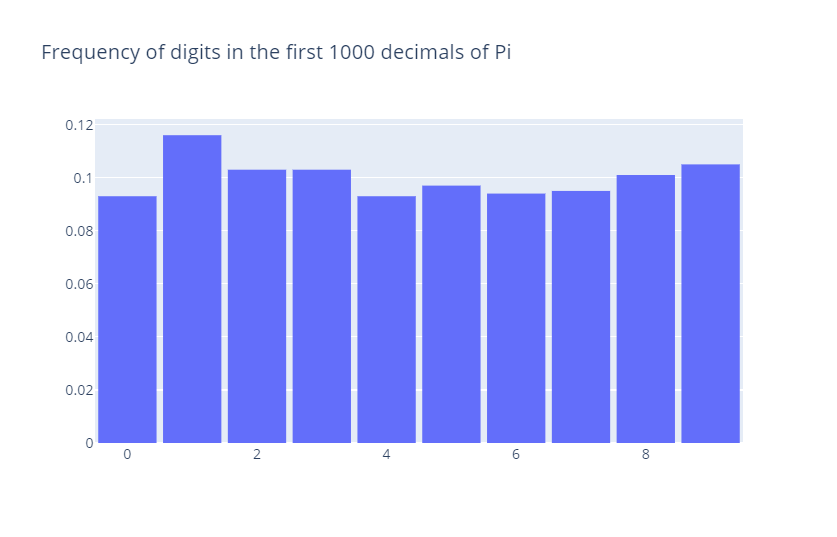
gru(PI).hist(title='Frequency of digits in the first 1000 decimals of Pi', normalized=True)