Y axis svg #1236
Y axis svg #1236
Conversation
|
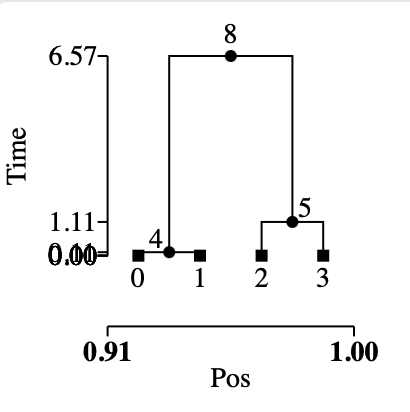
Here's an example:
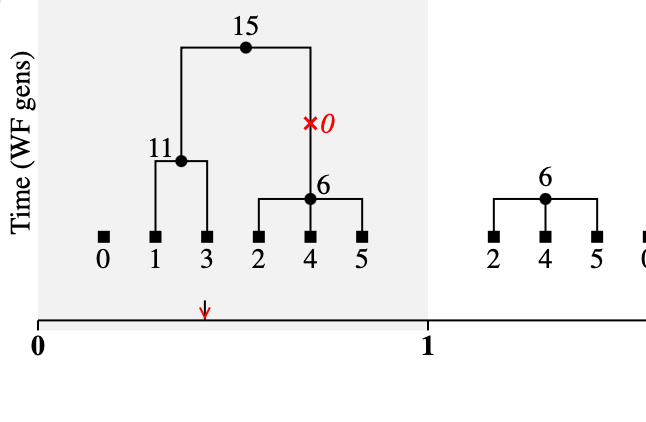
And one with some user-specified ticks and gridlines:
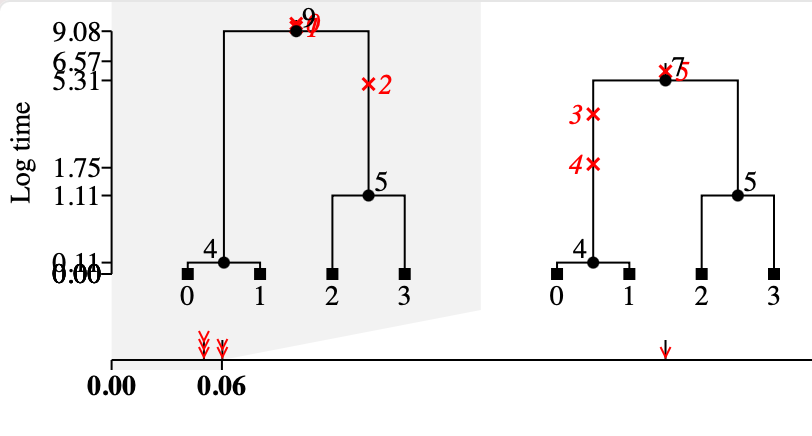
And here's a single tree with both axes:
|

Codecov Report
@@            Coverage Diff             @@
##             main    #1236      +/-   ##
==========================================
+ Coverage   93.70%   93.74%   +0.03%
==========================================
  Files          26       26
  Lines       21599    21781     +182
  Branches      909      963      +54
==========================================
+ Hits        20239    20418     +179
  Misses       1321     1321
- Partials       39       42       +3
Flags with carried forward coverage won't be shown. Click here to find out more.
Continue to review full report at Codecov.
|

f75830a to
2e4ddf2
Compare
 jeromekelleher
left a comment
jeromekelleher
left a comment
There was a problem hiding this comment.
Looks great. I've not gone through the logic in detail, ping me when you'd like some more feedback.
Thanks @jeromekelleher - I think I've covered most of this now, so some more detailed feedback would be good. If you flip through the SVG files in Re interface, I've tried to retain current behaviour. So For a tree sequence, the x axis is on by default (and can't be turned off), so that The other two parameters I've added are Gridlines can be force shown by |
65030bb to
acc4d27
Compare
0734546 to
d729ae1
Compare
|
Looks great Yan, ping me when you want a full review. |
It's ready for review whenever you have time. I think I've covered all the code lines now. |
jeromekelleher
left a comment
There was a problem hiding this comment.
Looks great, but I'm not too keen on the current interface. I think we're trying to do too much with too few parameters. How about
x_axis: bool # Whether to show x axis; None for default
y_axis: bool # Whether to show y axis; None for default.
x_label: str # The x axis label; None for default. If x_axis is shown, default is "Genome", otherwise nothing
y_label: str # The y axis label; None for default. If y_axis is shown, default depends on value of time scale, otherwise nothing.
y_gridlines: bool. Whether to plot gridlines. Default is False. (Overly complex making default depend on y_ticks)
So, we have a set of relatively independent params. For example, you can, if you want, set a Y-axis label without a drawn y-axis (which you might want to do). By overloading too much functionality into label parameters I think we'd be (a) making for code that's hard to read and (b) painting ourselves into a corner in terms of flexibility.
What do you think? We don't have to support x_axis=False for TreeSequence, if that's awkward.
Yep, I'm completely agnostic about the API. Happy to go with your suggestion below. I don't think we should default to a standard axis label text though, as that opens us up to internationalisation issues (and we haven't had it before anyway).
I think it should be relatively easy to support |
I think we can break with the old default here, it's generally handy to know that "genome position" (or something) is what the x axis refers to. Definitely for the Y axis having a good default of "Node rank" or "Time ago" would be really helpful, and is what you want most of the time. Unlabelled axes are one of the biggest mistakes made in data visualisation, so we should do the right thing by default here I think. I wouldn't worry about i8n - we can deal with that if it becomes an issue.
yes, I think that's the right default. |
If we are creating a default label, I would like it to reflect #495. When that's solved, I think the default should change from "Time" to "Time (generations)" or "Time (years)", or "Time (days)" or whatever. That's another reason I was putting off this decision. But I guess we'd be happy for the defaults to change like this in the future? Also, I assume we don't put "Log time" because the actual ticks will be labelled as (untransformed) values.
OK, your call. It just makes me wary. |
 benjeffery
left a comment
benjeffery
left a comment
There was a problem hiding this comment.
Wow, as usual viz code is a ton of work! Just a few comments.
dec55d4 to
e5402b0
Compare
|
OK, it took a fair bit or re-ordering, but I think the new interface with y_axis=True, etc is working now.
As before, have a browse through the files in I think this is ready for a final review? |
jeromekelleher
left a comment
There was a problem hiding this comment.
Looks great! Some minor comments on the code and interface, but basically ready to merge I think.
Looks like you need a few more permutations of x_axis=[True, False], y_axis=[True, False] to bump the test coverage up (looks like the tests are only covering one side of a branch in some bases)
Just committed this combinatorial monster: Is that excessive @jeromekelleher ? It still runs in reasonable time on my machine. |
python/tskit/drawing.py
Outdated
| iter(ticks) | ||
| return ticks | ||
| except TypeError: | ||
| raise NotImplementedError("Autocalculated tick mark locations not implemented.") |
There was a problem hiding this comment.
This is still the wrong error class and message. Just return ticks and let the standard errors do the work.
There was a problem hiding this comment.
Weird. I did change that, and it's not what's now on my branch: https://github.com/hyanwong/tskit/blob/2382583b1f72de16646637aec9255c5bb0c01744/python/tskit/drawing.py#L125. Not sure what's up here @jeromekelleher
... yes. How many tests is this? We don't need the cross product of all these things I think, maybe just a few specific combos where the parameters interact. |
2^5 * 3^2 = 288. Yes, I agree it seems excessive. |
|
I removed the x_axis/label specs and log_time, and now it's only 32 combos, which I deem acceptable. Also the re-push seems to have properly updated the PR, so now the NotImplementedError is gone. Note however, that I think the Python docs say that I guess this can be merged - do you want me to squash the last commit into the previous one @jeromekelleher ? |
Allows X and Y axes on both trees and tree sequences
3dda2de to
da2cfc2
Compare
Description
Adds the possibility to put a Y axis & scale onto SVG plots. The axis-adding code is generalised, so it is available to both plots of single trees and whole tree sequences.
Draft at the moment, to solicit feedbackFixes #580 and #840
PR Checklist: