Release 0.80.0

April 28, 2026
Tip: These notes are also available at https://docs.wandb.ai/release-notes/server-releases#v0-80-0.
W&B 0.80.0 includes new features to help you efficiently observe and analyze your experiments, bug fixes, and security improvements. The updated home page lets you view, search, and filter recent activity across your organization. Automation based on a run metric’s z-score and side-by-side media comparison are generally available. Table panels, parallel coordinate plots, and scatter plots have also been improved. Interacting with sharing artifact lineage graphs is more efficient. To help streamline provisioning for enterprise deployments, SCIM API now supports managing Models seats and Weave roles.
Support and end of life
- W&B Server v0.68 has reached end of life.
See Release policies and processes. For assistance or questions, contact support.
Features
-
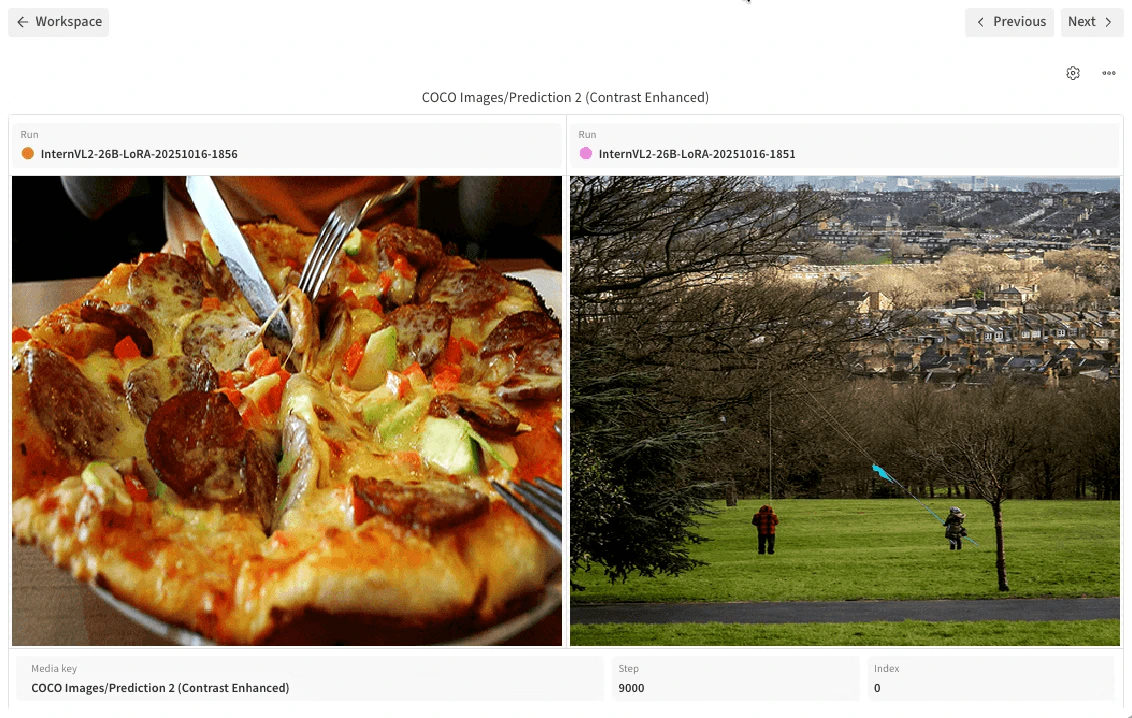
Compare mode for media panels is generally available. Compare mode lets you select 2 to 4 images or videos from any combination of runs, steps, or indices and view them in a single grid, without downloading files or switching tabs.
-
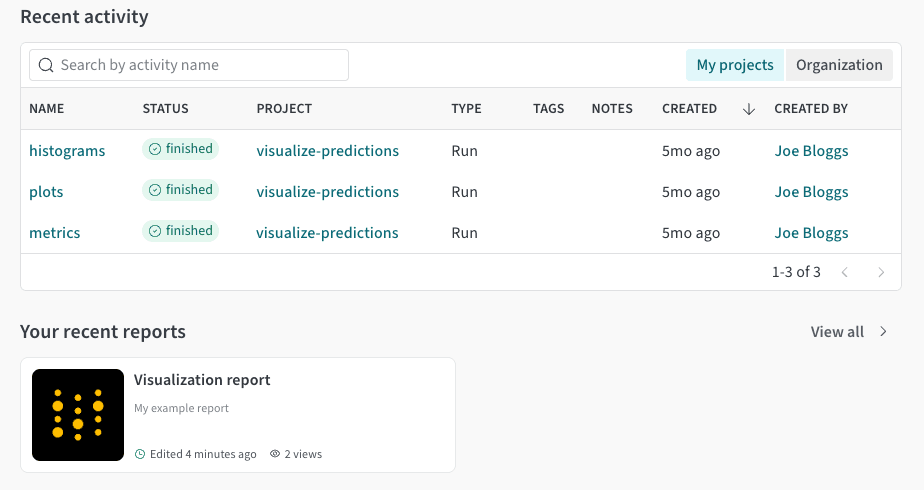
The W&B App’s home page has been improved.
-
View, search, or filter recent activity, both your own and that of your colleagues.
-
Access recent reports directly in the home page.
-
Starred projects are no longer displayed on the home page, but appear at the top of the Projects page and in the left navigation.
-
-
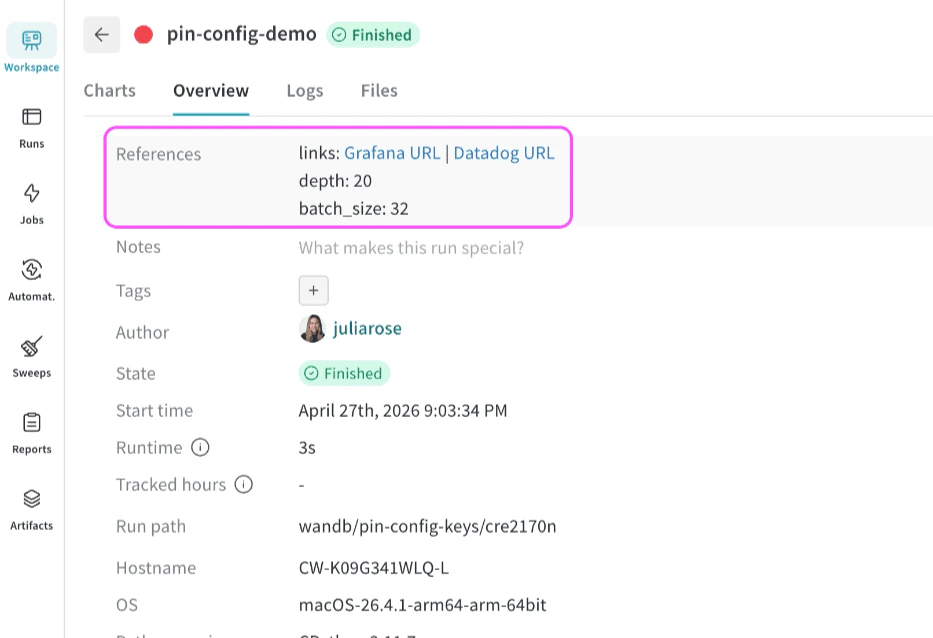
Programmatically pin selected config keys to the top of the run’s Overview tab with the new method
run.pin_config_keys(). Pinned keys appear in a new References section above Notes, where you can see the run’s most important details at a glance, like hyperparameters, external links, or identifiers. Each key you pin appears separately with its value, and links are clickable. Requires W&B SDK v0.26.0+. -
Triggering an automation based on a metric’s z-score is generally available. A z-score measures how many standard deviations the value is from the mean for that metric across a configurable window of runs in the project. See Automation events and scopes.
-
When hovering over a run in the runs list, the relevant line is now highlighted in parallel coordinate plots.
-
Scatter plots support new display options related to the frontier line, which is a line connecting the highest and lowest Y-axis values so far. Configure these options in the Annotations tab of the plot’s settings.
- Show run labels: Optionally display a label with the run name or group name.
- Dim non-frontier points: Optionally reduce the weight of non-frontier points.
-
You can now play audio in a table panel while it is downloading.
-
For manually-added custom panels, position overrides are now preserved across reloads.
-
Access release notes for your deployment’s current version from within the W&B App. In the top navigation, click ? to open the Resources & Help menu, then click Release Notes.
-
Improved Lineage DAG navigation: you can now filter lineage by artifact type and upstream/downstream hops. Filtered or hidden nodes now remain visible as placeholders, which should make it easier to understand graph structure while iterating on filters.
-
When you share an artifact’s lineage view by URL, the recipient now sees the exact same graph configuration, including filters, hidden nodes, manual positions, viewports, and zoom levels.
Weave
- A new Scorer dashboard view in Project overview pages shows pass/fail rates and histogram distributions per scorer, a filterable list of examples, and per-example detail with trial scores.
- Time-binned Feedback and Score charts on the Monitors page show numeric trends boolean counts, filtered by monitor.
- Playground now supports streaming evaluation results. When you run an evaluation from the Evaluation Playground, the compare view appears immediately with one column per model. Each column shows real data when that model’s evaluation has completed successfully, a skeleton when it’s still running, or shows that an evaluation failed. Results stream in as each evaluation completes instead of waiting for all of them. A progress bar updates with per-call status polling.
- Create and manage classifier monitors from the Monitors page with suggested classifier cards.
- Edit signal prompts in place in the Monitors page. Click the gear icon, then click a signal's pencil icon.
- In the Calls table, user IDs now resolve to usernames.
Security
- Assign Models seats or Weave roles using SCIM.
- When fetching audit logs, the
startDateparameter controls the newest logs to fetch. - Organization admins can disable GraphQL introspection with the
graphql-disable-introspectionconfig option or the environment variableGORILLA_GRAPHQL_DISABLE_INTROSPECTION. Requires W&B SDK v0.26.0+. - Fixed a bug where certain structured run filters were not consistently escaped when building SQL, which could allow a malicious filter shape to interfere with query generation beyond what an authorized client should be able to express. Filter handling now applies the same column escaping used elsewhere so filter keys cannot alter query structure.
- Fixed a bug where run-queue operations tied to sweeps and direct queue deletes could, in specific cases, act on queues or queue items outside the caller’s intended scope. Authorization now verifies queue access and item ownership before enqueueing from sweeps or deleting queue entries.
- Fixed a bug where run metadata key suggestions could incorporate unsanitized user input into database queries. Key paths are now constrained so only safe, expected column references feed the suggestion path.
- Fixed a bug where the service-account creation API could accept an organization identifier that did not match the team the caller administers, allowing a mismatched org association. The server now rejects inconsistent organization input and derives organization membership from the entity’s actual organization.
- Fixed a bug where dequeueing from a queue could treat a queue as an internal “public” launch queue based on naming alone, while enqueueing used stricter checks, and where a caller-supplied job author could be honored on push. Dequeue now uses the same public-queue validation as enqueue, and job author is aligned with the authenticated user so internal credential injection cannot be triggered for spoofed queues or forged authors.
- Fixed a bug where custom LLM provider settings could target disallowed hosts or include unsafe HTTP headers when the trace server loads provider configuration. Base URLs and headers are now validated so providers cannot be pointed at sensitive metadata-style endpoints or carry blocked header patterns.
- Fixed a bug where file paths supplied for in-memory trace artifacts could escape the intended temporary workspace during deserialization. Paths are now sanitized so artifact files are confined to the expected directory layout.
- Fixed a bug where the evaluate-model worker could process unsafe custom serialized payloads during evaluation jobs. Those payloads are now rejected before deserialization, consistent with hardened paths elsewhere in the evaluation stack.
Fixes
- Table panels now default to being rendered as summary tables, with a button to switch to a stepper view if the table was logged across steps. This improves load times for workspaces with table panels and mitigates an incompatibility when viewing run history for a resumed run.
- Fixed a bug that prevented the sweeps table from loading more than 500 sweeps.
- The column editor now includes a dedicated Show/Hide button when you hover over a column.
- The run ID (the value of
run.name) is now included in fuzzy search when searching for runs. - Improved performance of loading audio in table panels.