
First public release of MEDS — a ground-up Fortran 2018 reimplementation of the Ecosystem
Demography model (ED2), running a coupled demography + land-surface
biophysics simulation end to end from a TOML configuration.
Read this first: the science is implemented and internally verified, but MEDS has not been
benchmarked against ED2 or against flux-tower observations. Treat the numbers as a working model's
numbers, not as validated ones.
Coming from ED2? Start with docs/ed2_comparison.md — what carried
over, what changed, what is missing, keyed to the ED2IN options you already know.
One run, three views
All three figures below come from a single hourly output stream — the same 744 records of one July
in year 50 of an Ithaca NY simulation, written by the new diagnostic subsystem with nothing recomputed
offline. Reproduce them from examples/example_biophysics/.
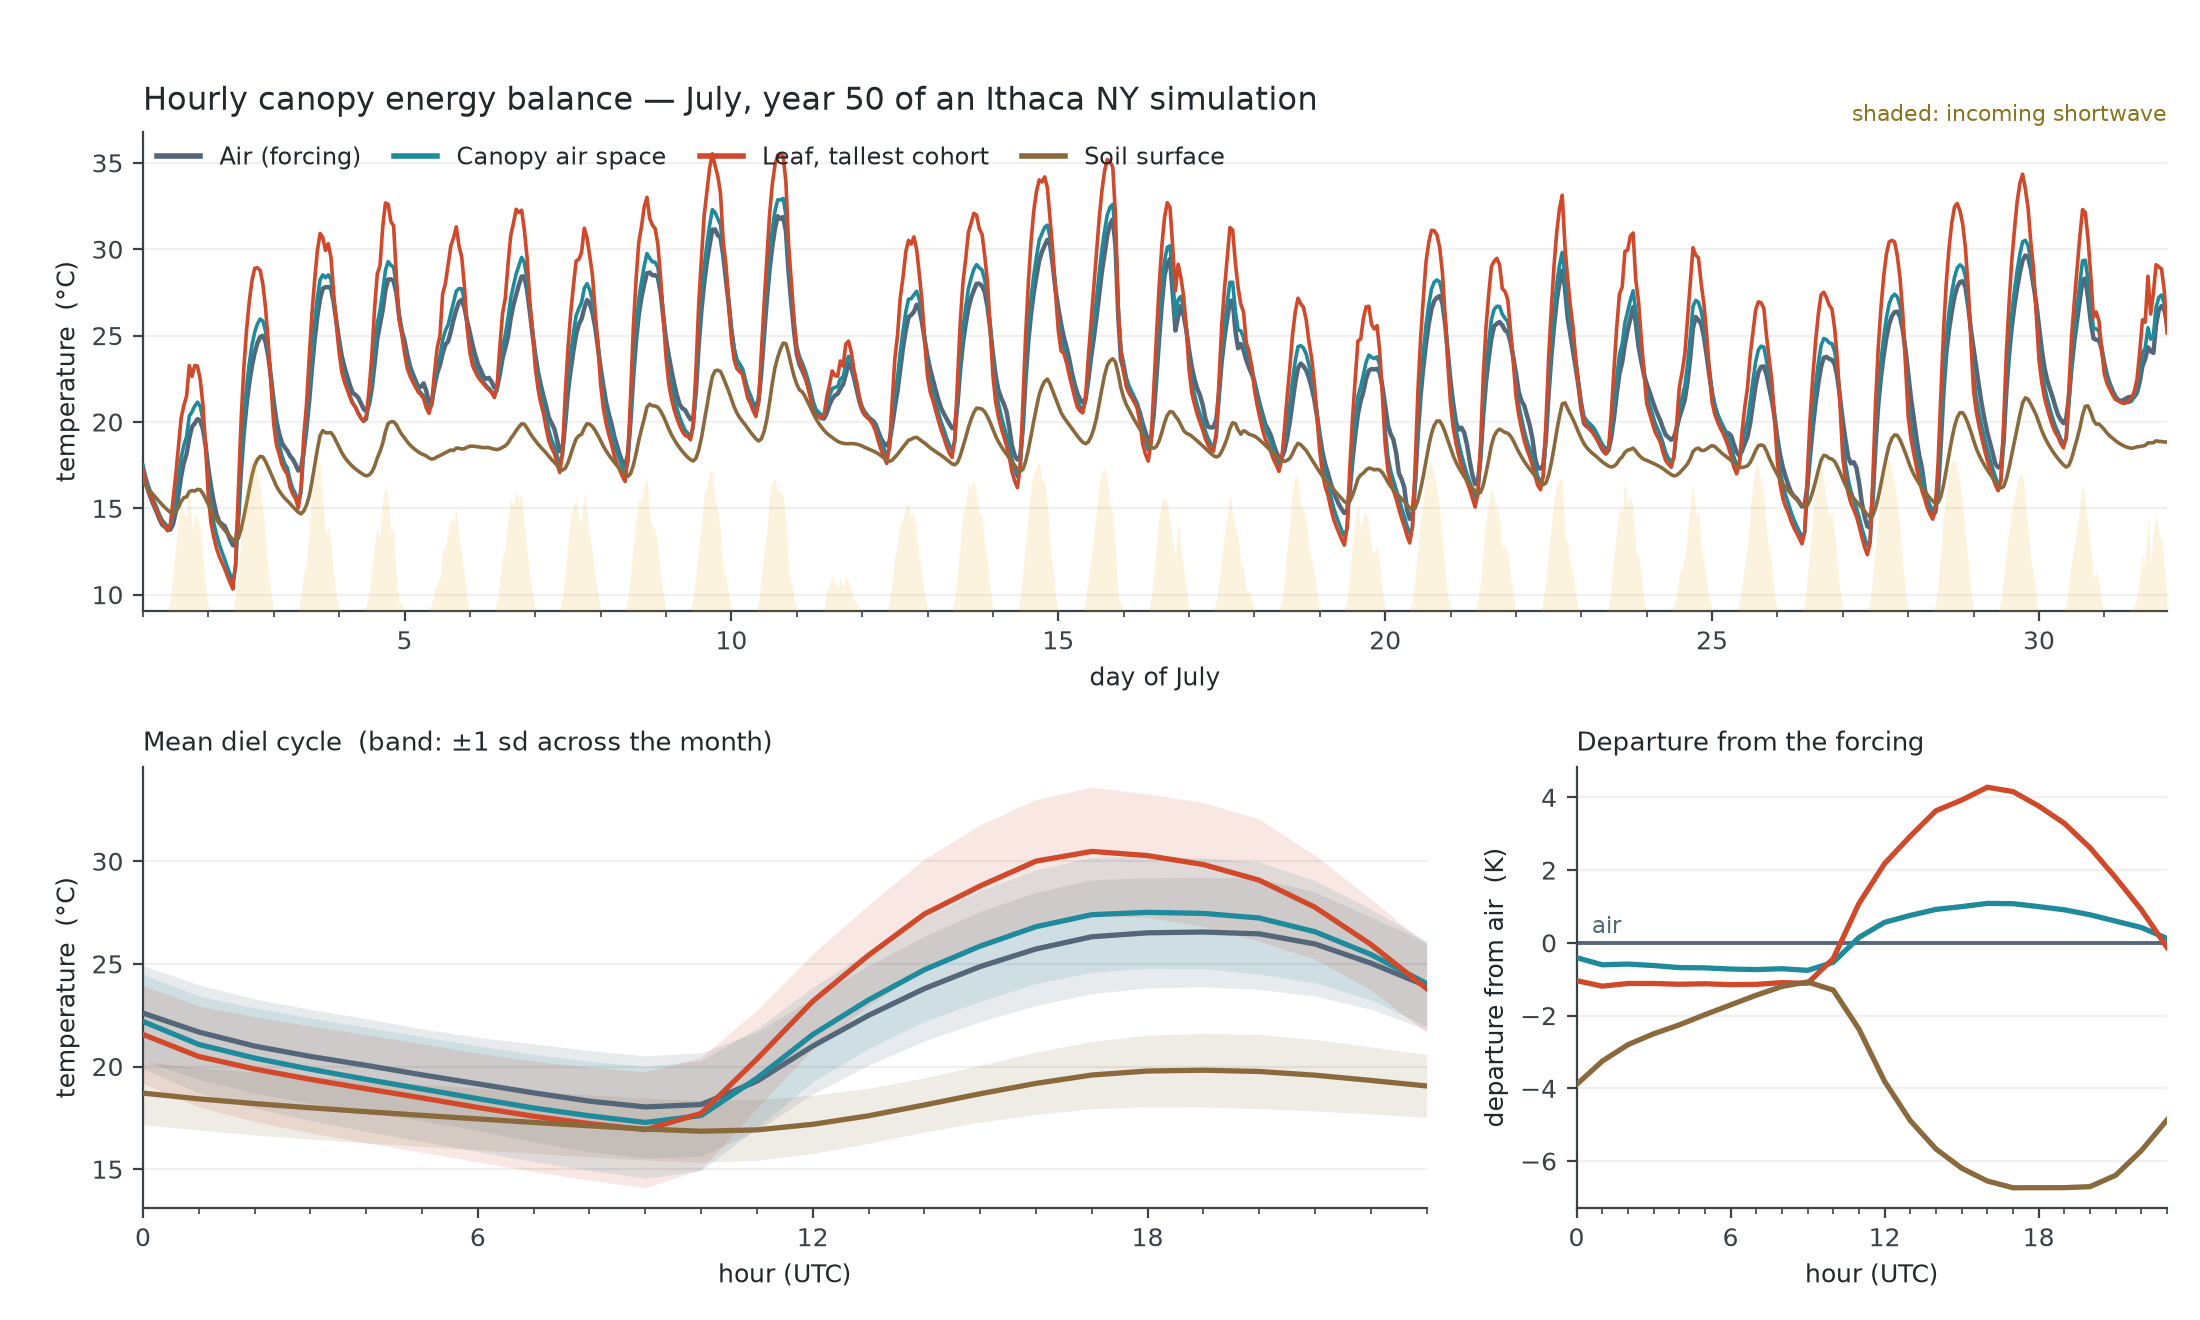
Energy. Only the grey curve is an input — above-canopy air temperature from ERA5-Land. The canopy air
space, the tallest cohort's leaf temperature and the soil surface are all solved, and they separate
from the forcing in different directions and with different phase: diel amplitudes of 8.5 K for the
forcing air, 10.2 K for the canopy air, 13.6 K for the leaf, 3.0 K for the soil surface.
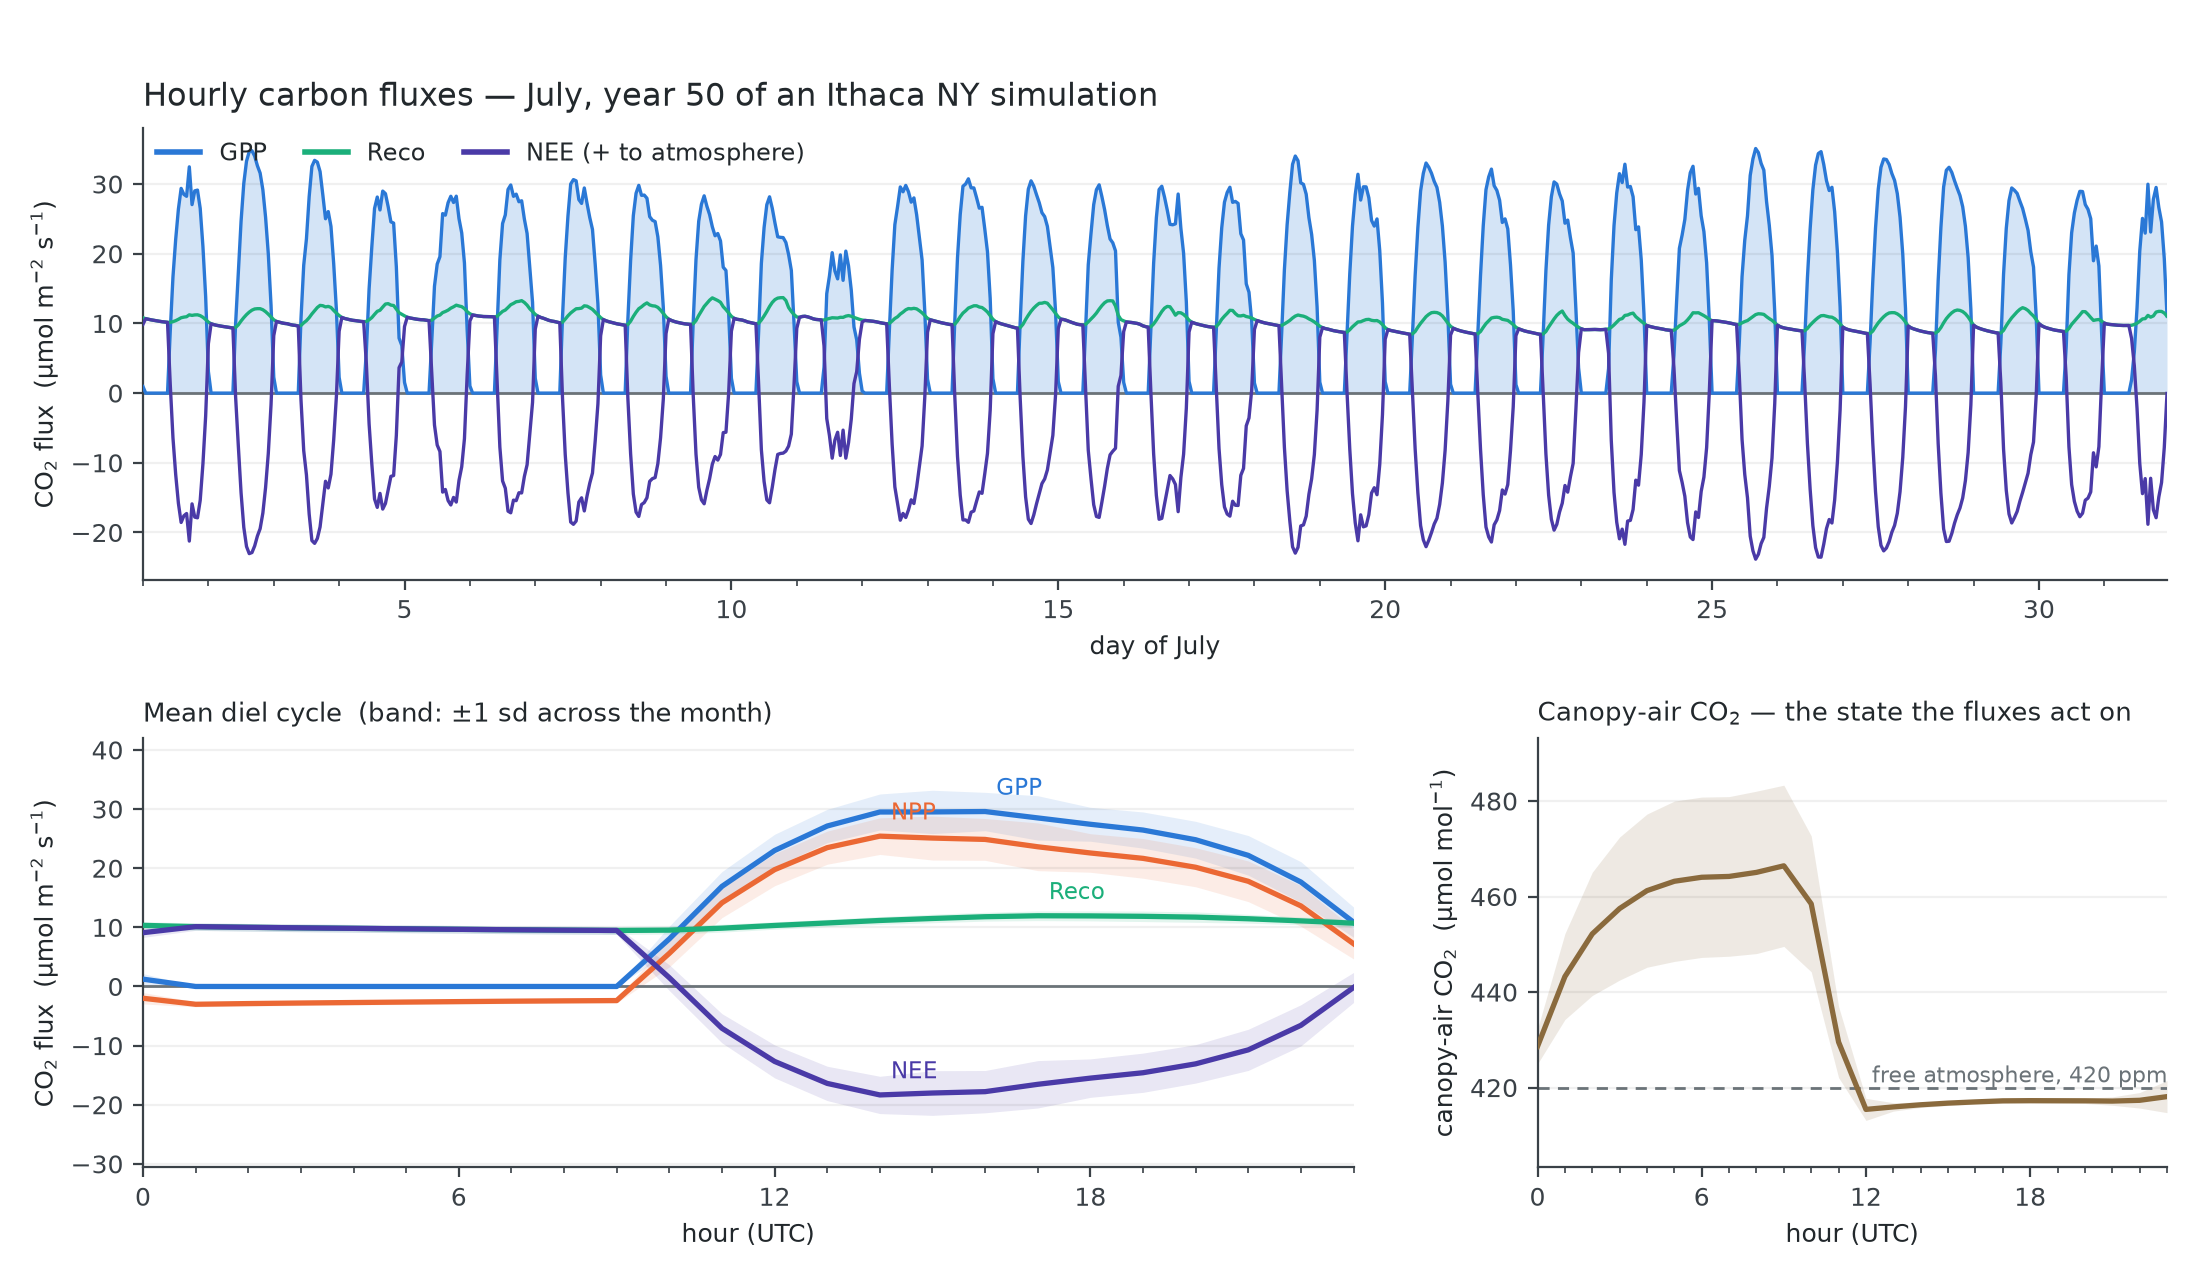
Carbon. GPP peaks at 29.6 µmol m⁻² s⁻¹ and goes to zero at night while respiration runs continuously
at 10.6, so the stand is a net sink in only 396 of 744 hours (53%) yet still clears 92.5 gC m⁻² over
the month. Canopy-air CO₂ is prognostic, not diagnostic: drawn 9.8 ppm below ambient at peak
assimilation, +38.5 ppm under a stable night.
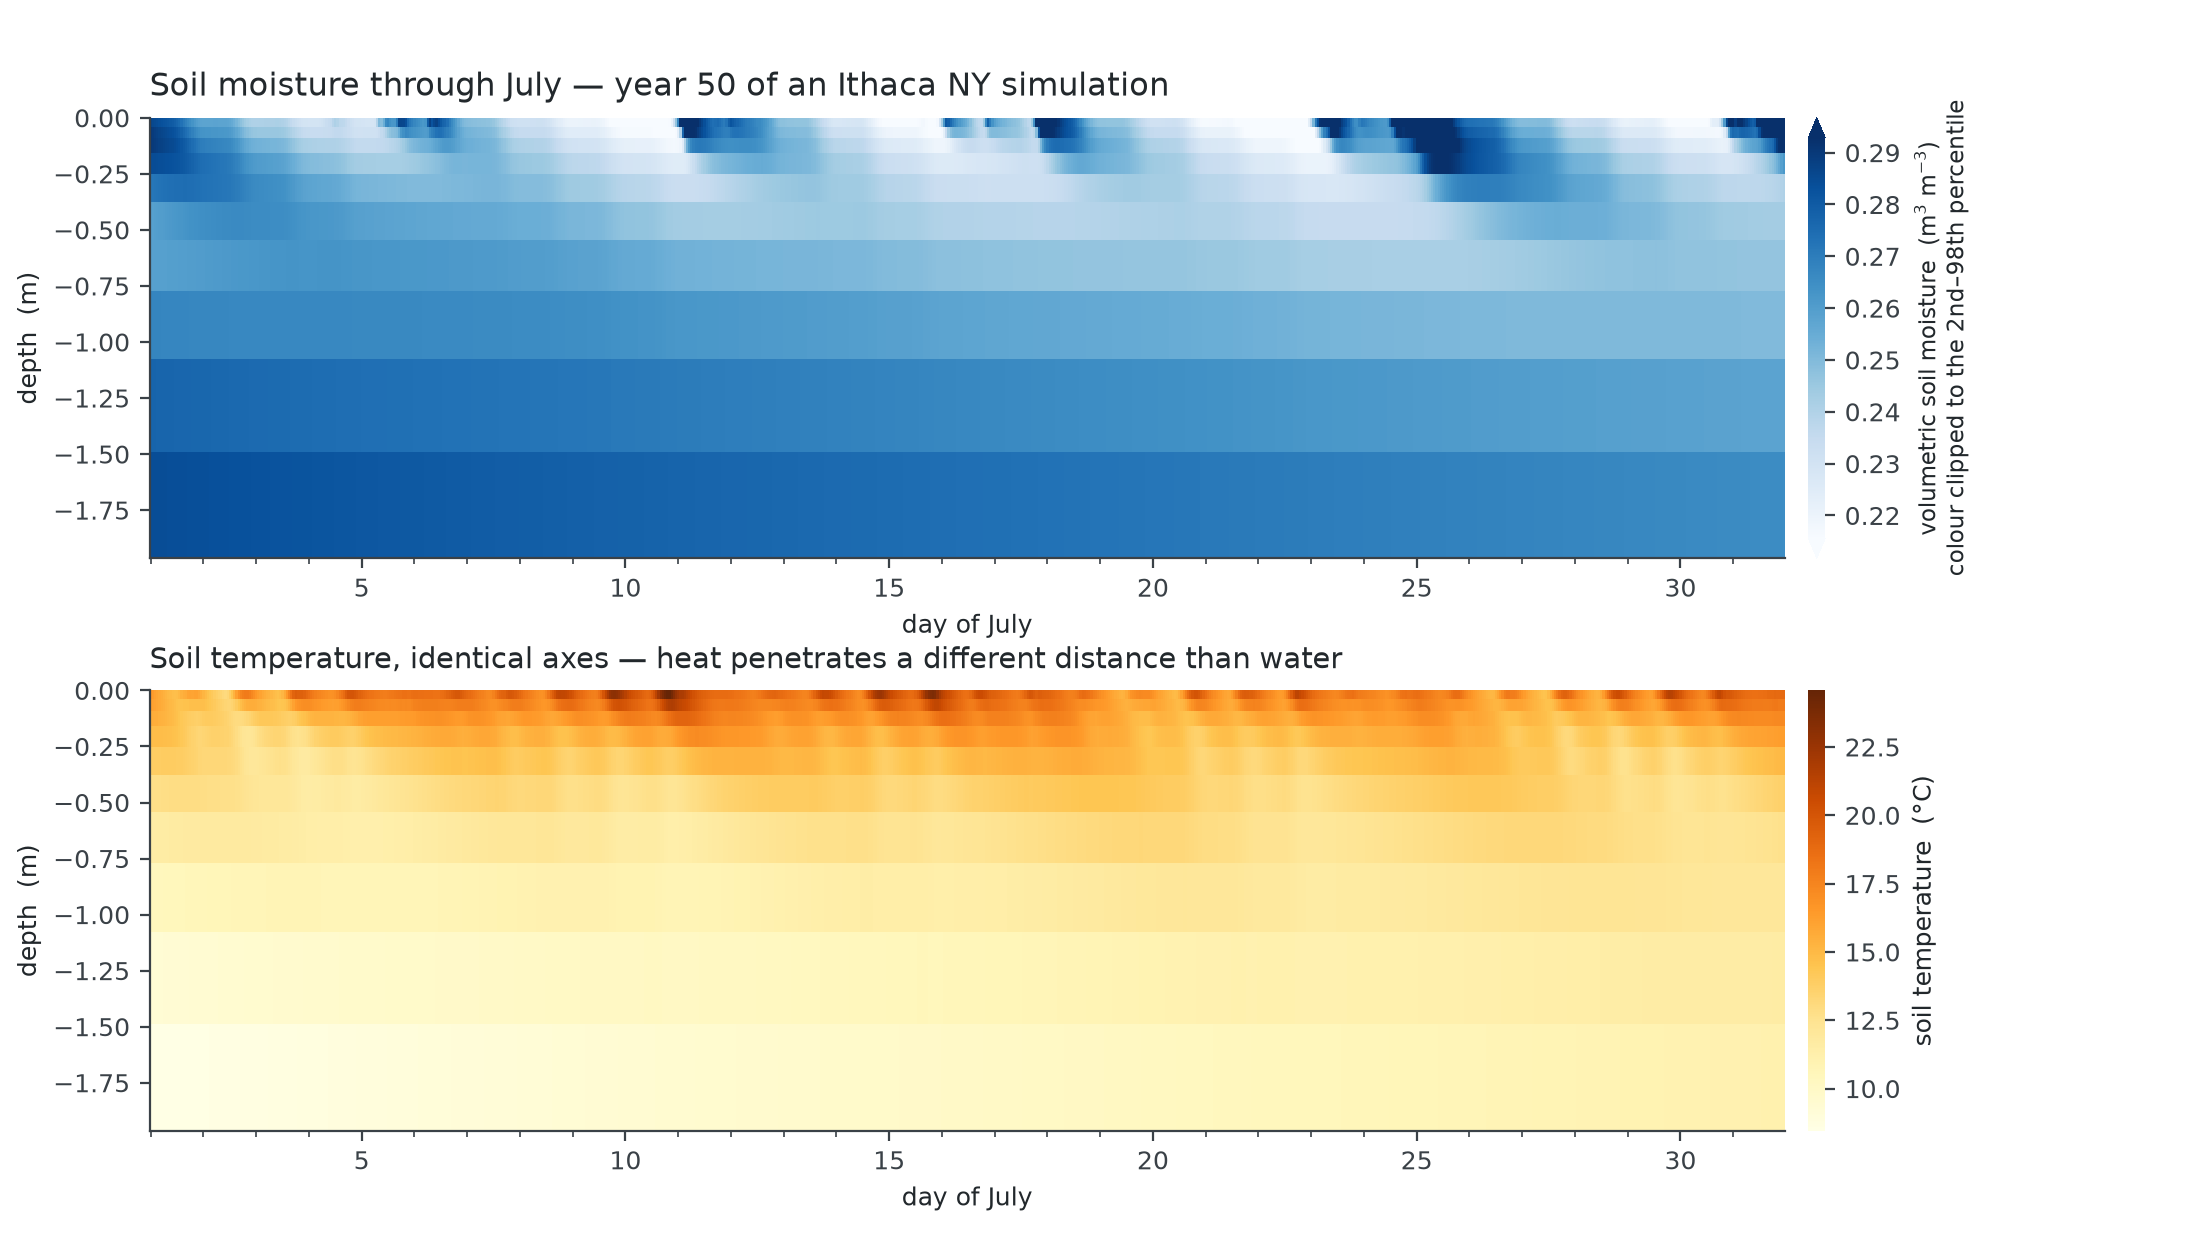
Soil, from the 2-D (patch × soil layer) output axis. Water and heat enter through the same surface and
travel very different distances: surface moisture moves 0.162 m³ m⁻³ over the month against 0.019 at
1.73 m; surface temperature swings 11.5 K against 2.7 K at depth.
What runs
Demography. Size- and age-structured cohorts and patches: growth, mortality, recruitment,
cohort fusion/fission, and treefall patch disturbance opening age-0 gaps. Pan-tropical
(ED2 iallom==3) allometry; wood density as the PFT axis for the mortality hazard and AGB;
patch fusion on an ED2-style cumulative-LAI light profile. A leap-year-aware Gregorian calendar,
so output and restarts carry the simulated date.
The fast loop, always on. Sub-daily land-surface biophysics at a configurable dt_fast
(900 s production default): ED2-style two-stream canopy radiative transfer, a prognostic canopy air
space (temperature, humidity, CO₂), Monin–Obukhov aerodynamics, leaf gas exchange with two-limb
water stress, plant hydraulics, and soil/snow columns carried as internal energy — so freeze/thaw
falls out of the enthalpy inversion rather than needing a special case. Two interchangeable
integrators: an L-stable 2-stage ESDIRK2 (ark, the default) and an adaptive explicit Cash–Karp
RK45 kept as the accuracy baseline. Every fast step closes CAS, soil and whole-column energy and
water budgets to machine precision, asserted in the suite.
The slow loop. Daily carbon allocation with wood_carbon as the prognostic size anchor,
phenology, and CENTURY-style soil biogeochemistry, driven by what the fast loop actually produced.
Empirical structure-only vital rates remain available through the Python C-API path.
Output (new in this release). ~200 variables across cohort, patch, site, soil, PFT and
DBH-size-class axes, switchable individually per timescale (sub-daily / daily / monthly / annual)
from TOML. Extensive quantities carry their own aggregation weight as data, so one registry line
emits a field's patch, site, PFT and size-class rollups. meds_main --dump-io-config prints the
resolved set; an unrecognized variable name is a hard error, so the config doubles as a typo guard.
netCDF is written through the C library directly — no netCDF-Fortran dependency.
Parallelism. The hot kernels are OpenMP target regions over plain arrays; the patch axis is
threaded. nvfortran offloads to multicore CPU (-DMEDS_GPU=multicore) or GPU (-DMEDS_GPU=gpu).
Verification in this release
- 38 CTest tests pass under both ifx and nvfortran, Release and Debug.
- Output is byte-identical at 1 vs 4 threads across all 75 files of the example run — the check
that caught a real defect this cycle (a diagnostic sourced from a deliberately non-lockstep-ordered
array, which only agreed at one thread because thread count perturbs which cohorts fuse). - Conservation is asserted per step, not spot-checked: CAS, soil and whole-column energy and water.
Known limitations
- No ED2 or observational benchmarking yet — there is no EDTS equivalent. This is the largest gap
in the release and the obvious next piece of work. - Single site only. The multi-site axis is not wired. No fire, land use, or nitrogen cycle.
- The soil column is 2.0 m against a ~2.5 m annual damping depth, so the annual thermal wave reflects
off a zero-flux base. Soil freeze/thaw is opt-in ([energy].phase_change), and snow is a single
bulk layer. - Leaf water potential does not converge in
dt_fast; a study keyed to it wantsdt_fast≤ 150 s. - Long spin-ups can exceed the default stack under automatic arrays —
ulimit -s unlimited. - See
docs/science/numerical_scheme.md§7 anddocs/ed2_comparison.md§5 for the full lists.
Getting started
cmake -S . -B build -DCMAKE_Fortran_COMPILER=ifx -DCMAKE_BUILD_TYPE=Release \
      -DCMAKE_PREFIX_PATH=$CONDA_PREFIX
cmake --build build -j
ctest --test-dir build --output-on-failure
netCDF (C library) is a hard build dependency; scripts/install_netcdf.sh will install it and print
the prefix. Then work through examples/ — example_biophysics runs one July at hourly
resolution and produces the energy, carbon and soil figures. Physics documentation lives in
docs/science/.