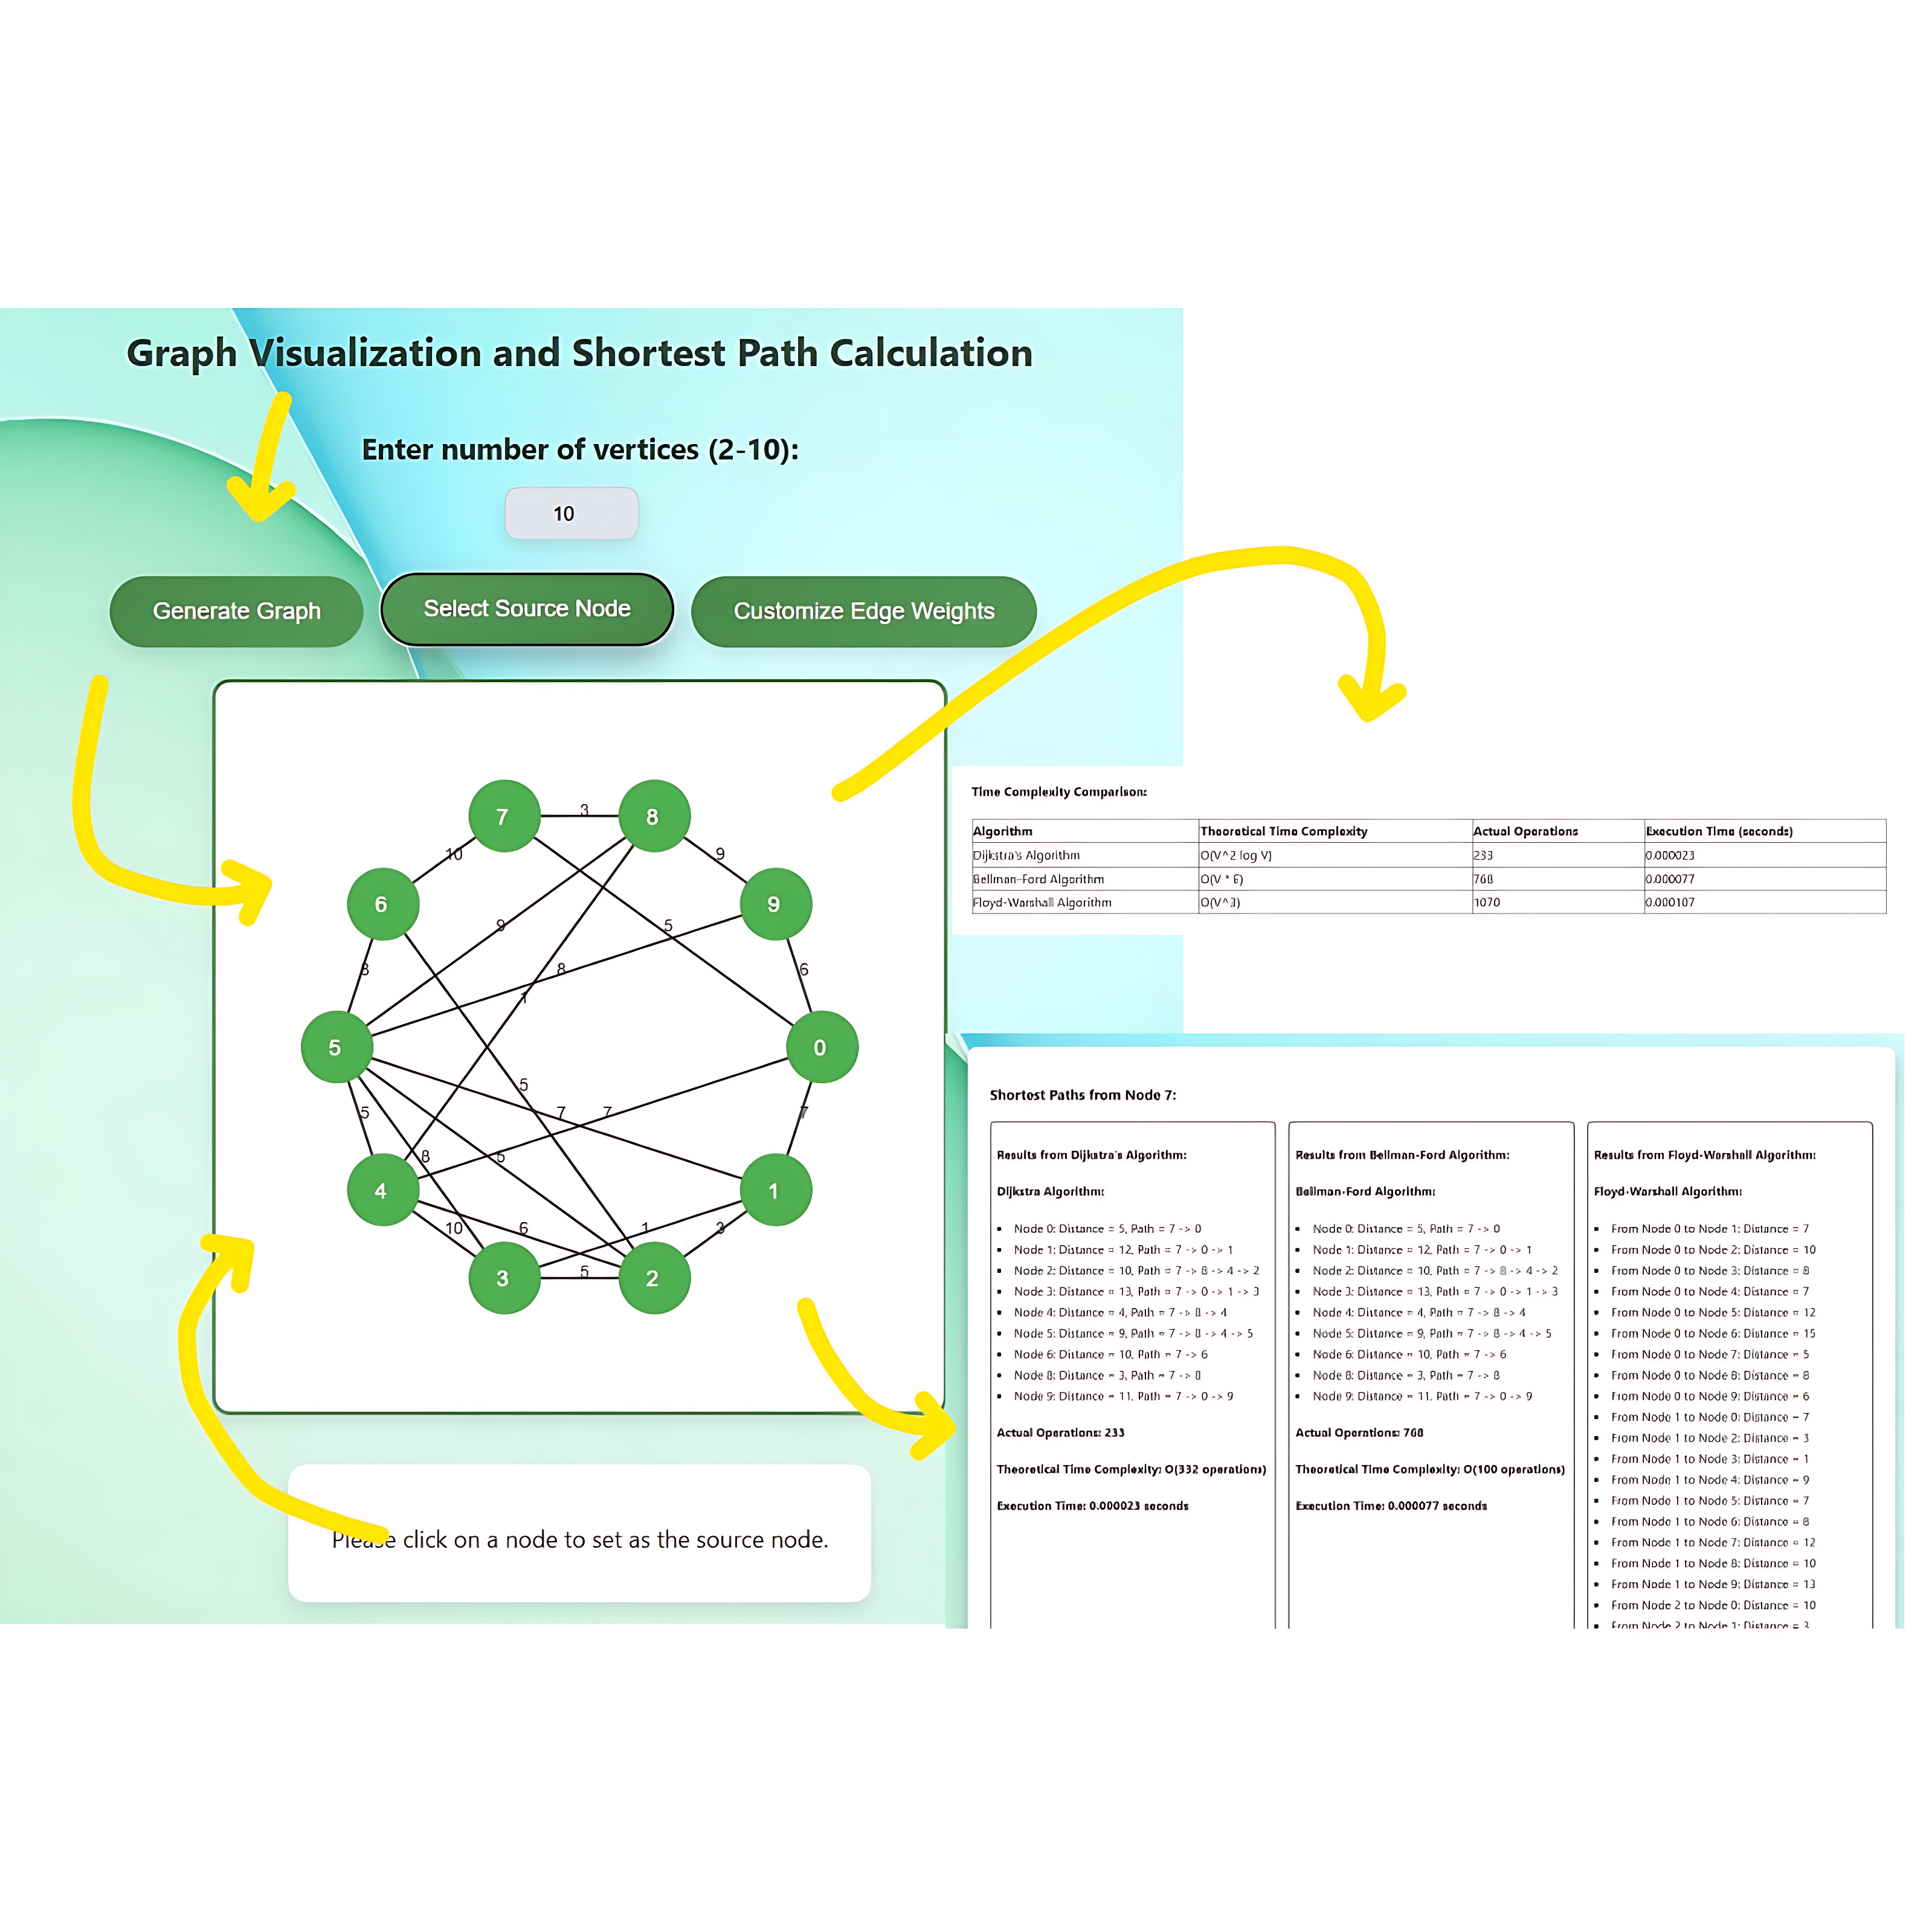
An interactive graph visualization tool that allows users to create graphs with re-adjustable number of nodes and their positions, select a source node, customize edge weights, and compute shortest paths using Dijkstra's, Bellman-Ford, and Floyd-Warshall algorithms. The project includes an intuitive drag-and-drop interface and a visual representation of graph traversal.
- Graph Creation: Add, remove, and connect nodes with weighted edges.
- Interactive Visualization: Drag nodes and dynamically adjust edge weights.
- Shortest Path Calculation:
- ✅ Dijkstra's Algorithm
- ✅ Bellman-Ford Algorithm
- ✅ Floyd-Warshall Algorithm
- Algorithm Comparison: View time complexities and step-by-step execution.
- User-Friendly UI: Built using HTML, CSS, and JavaScript with a canvas-based visualization.
- Frontend: HTML, CSS, JavaScript
- Graph Rendering: Canvas API
- Algorithms: JavaScript implementations of Dijkstra's, Bellman-Ford, and Floyd-Warshall
-
Clone the repository:
git clone <repository-url>
cd graph-visualization
-
Open the project:
- Simply open
index.htmlin your browser to run the visualization.
- Simply open
- ✅ More Graph Algorithms (Prim's, Kruskal's, A)*
- ✅ Enhanced UI with Animations
- ✅ Export Graph as JSON