Add host metrics grafana dashboard#2334
Conversation


 t-bast
left a comment
t-bast
left a comment
t-bast
left a comment
There was a problem hiding this comment.
Please be more thorough when you open a PR, it really looks like you haven't reviewed it yourself before submitting it.
Can you:
- fix the following comments
- include a screenshot of that dashboard in the PR description
- rename the
dashboard.jsonfile: we will obviously have other dashboards, so it should have a more specific name that describes what this specific dashboard contains, likehost-metrics.json


Co-authored-by: Bastien Teinturier <31281497+t-bast@users.noreply.github.com>
There was a problem hiding this comment.
This is missing steps, if someone tries this it won't work because they need to first add a data source in Grafana to connect it to Prometheus. You should explain how to do this in Monitoring.md.
I think we should put the json files in monitoring/grafana instead of just monitoring, since these are really grafana-specific files.
Also, how did you choose the host metrics to display in that graph? Did you spend time thinking about whether it makes sense? For example, the network data read/write is a rate over 1h: this really doesn't make any sense, we want a rate over a much small duration to be useful, for example 1 minute. Please spend time thinking about the metrics you're displaying and how they're best useful for node operators.
I'm also surprised by the very high memory usage: are you sure you are plotting the correct thing? How did you verify that the numbers are correct? You should for example compare it to what you see in your OS's task manager to make sure you're not displaying completely wrong data.
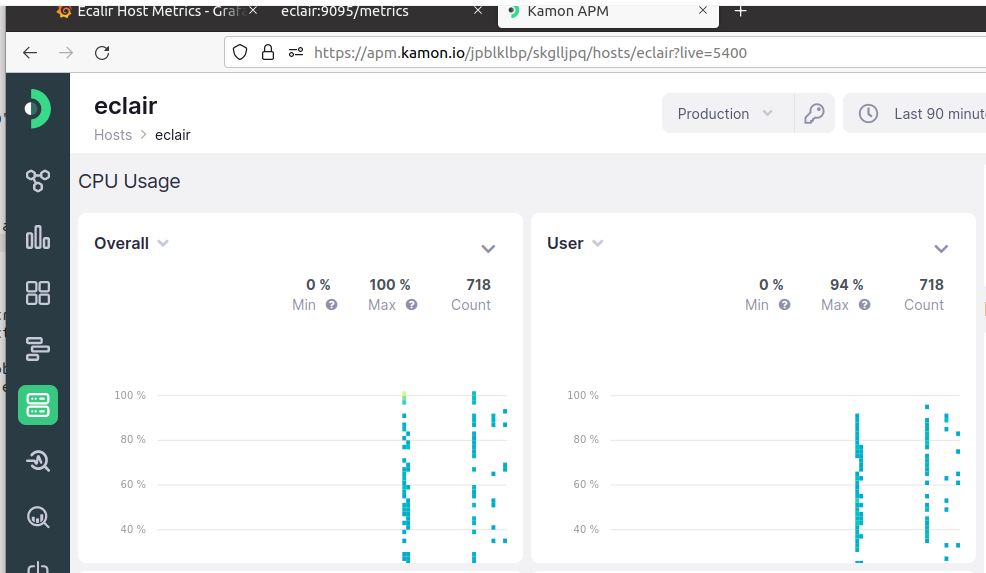
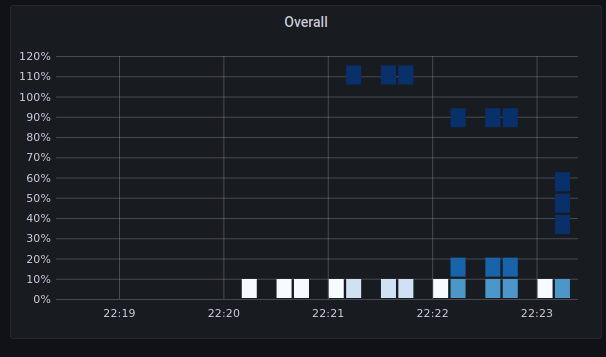
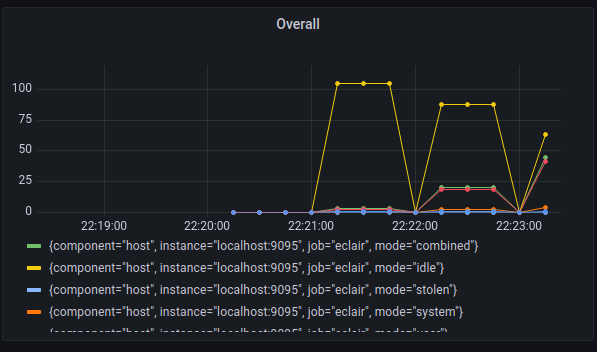
As for CPU, why did you choose this type of heatmap display? It's not very readable, is that a best practice? Where did you find the recommendations to use this type of display?

Yes, the steps for adding data source are missing in current doc, It is good to add some information regards of this along with official doc?
I have taken a reference from current
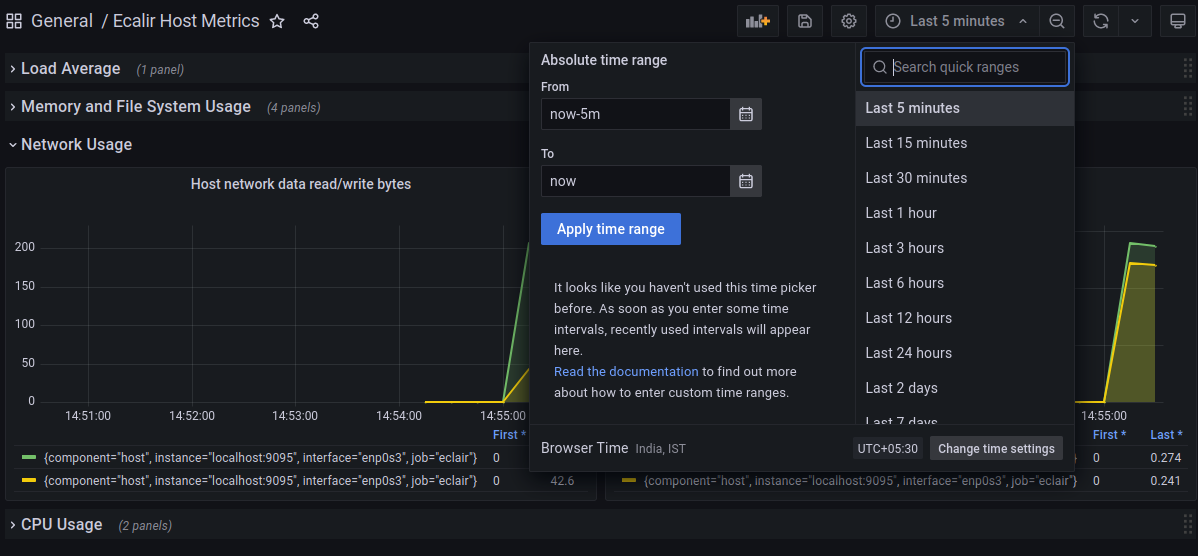
I didn't define a time interval for monitoring and by default it is 6 hours for all panels, But I think it is good to monitor last 5 minute because under that time interval user will be able to understand complete scenario. Can we define some default time intervals for monitoring? But on the other hand, Grafana allows users to change time intervals while monitoring. In below snapshot we can see that Grafana provide option to select time interval.
I have checked my OS task manager, and the metrics are correct, although it shows a high rate because of low memory resources in virtual machine.
At initial point, I was taken a reference from our working
|

As with all software, we want to provide good default values. You simply need to change it to: Let me know when you've fixed all the comments and the PR is ready for review, we really need to integrate this before the end of the week. |
I am confused, What to use for Output of timeseries looks like: I done with the almost all stuffs expect |
|
What do you think makes more sense? You should think about what a node operator will find easier to look at. In my opinion, a heatmap doesn't make any sense at all here, every task manager that I know of displays a timeseries... |
|
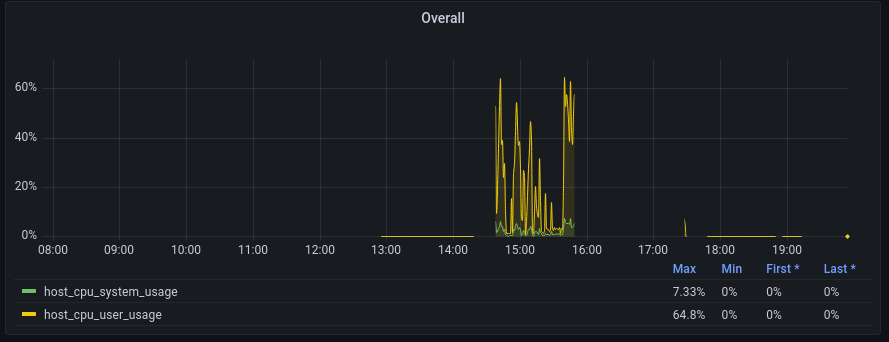
Mentor, I have tried the possible ways with timeseries display and it really looks more clear then heatmap. It will also contains max, min, first and last received values in %. Here are outcomes: CPU System Usage I think we should move ahead with this panels! |
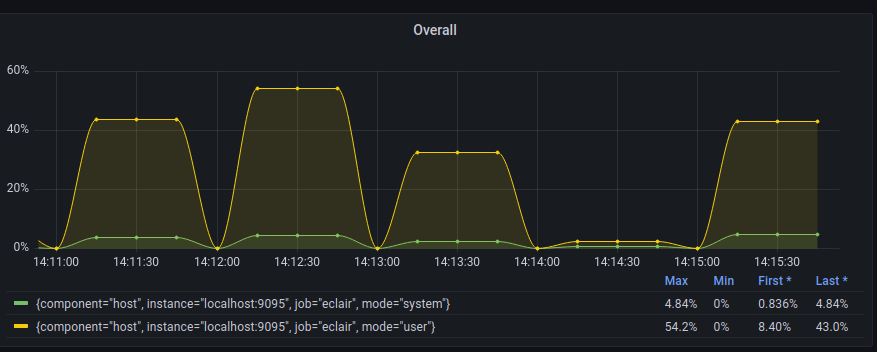
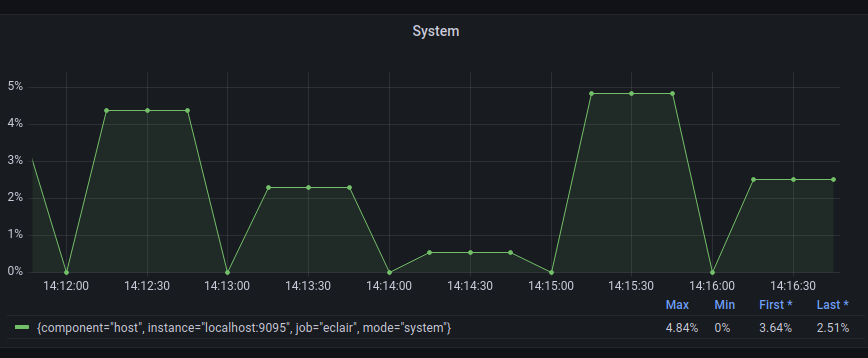
Then please update the PR accordingly so we can make progress. |
| "targets": [ | ||
| { | ||
| "datasource": { | ||
| "type": "prometheus", | ||
| "uid": "${DS_PROMETHEUS}" | ||
| }, | ||
| "editorMode": "builder", | ||
| "expr": "rate(host_network_data_read_bytes_total[1m])", | ||
| "legendFormat": "__auto", | ||
| "range": true, | ||
| "refId": "A" | ||
| }, | ||
| { | ||
| "datasource": { | ||
| "type": "prometheus", | ||
| "uid": "${DS_PROMETHEUS}" | ||
| }, | ||
| "editorMode": "builder", | ||
| "expr": "rate(host_network_data_write_bytes_total[1m])", | ||
| "hide": false, | ||
| "legendFormat": "__auto", | ||
| "range": true, | ||
| "refId": "B" | ||
| } | ||
| ], |
There was a problem hiding this comment.
When we look at the graph, we don't know which one is read and which one is write, the legend only says {component="host", instance="localhost:9095", interface="wlp2s0", job="eclair"} for both curves. Can you make sure the legend mentions the name of the metric?
You have the same issue for every of the graphs, the legend doesn't tell what is displayed, please fix it everywhere.
There was a problem hiding this comment.
I got an answer of this problem and replaced the metrics name with readable name(updated snapshot in description of PR).
Co-authored-by: Bastien Teinturier <31281497+t-bast@users.noreply.github.com>
Co-authored-by: Bastien Teinturier <31281497+t-bast@users.noreply.github.com>

Codecov Report
@@            Coverage Diff             @@
##           master    #2334      +/-   ##
==========================================
- Coverage   84.71%   84.70%   -0.01%
==========================================
  Files         194      194
  Lines       14632    14649      +17
  Branches      621      619       -2
==========================================
+ Hits        12395    12408      +13
- Misses       2237     2241       +4
|
t-bast
left a comment
t-bast
left a comment
There was a problem hiding this comment.
The mounted data metrics are still not correctly named but let's merge this and fix it later to make progress.
3 participants


In this PR I have added following:
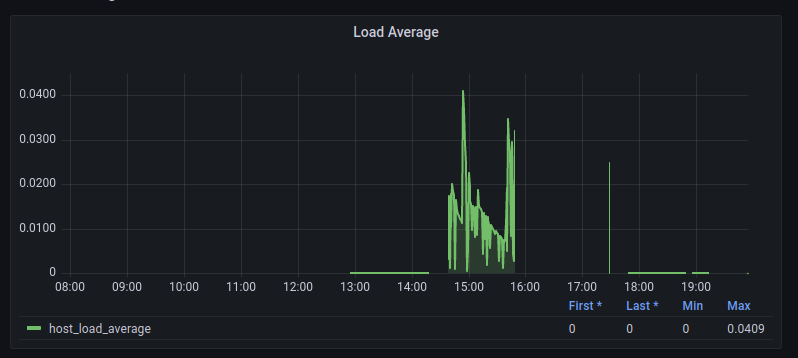
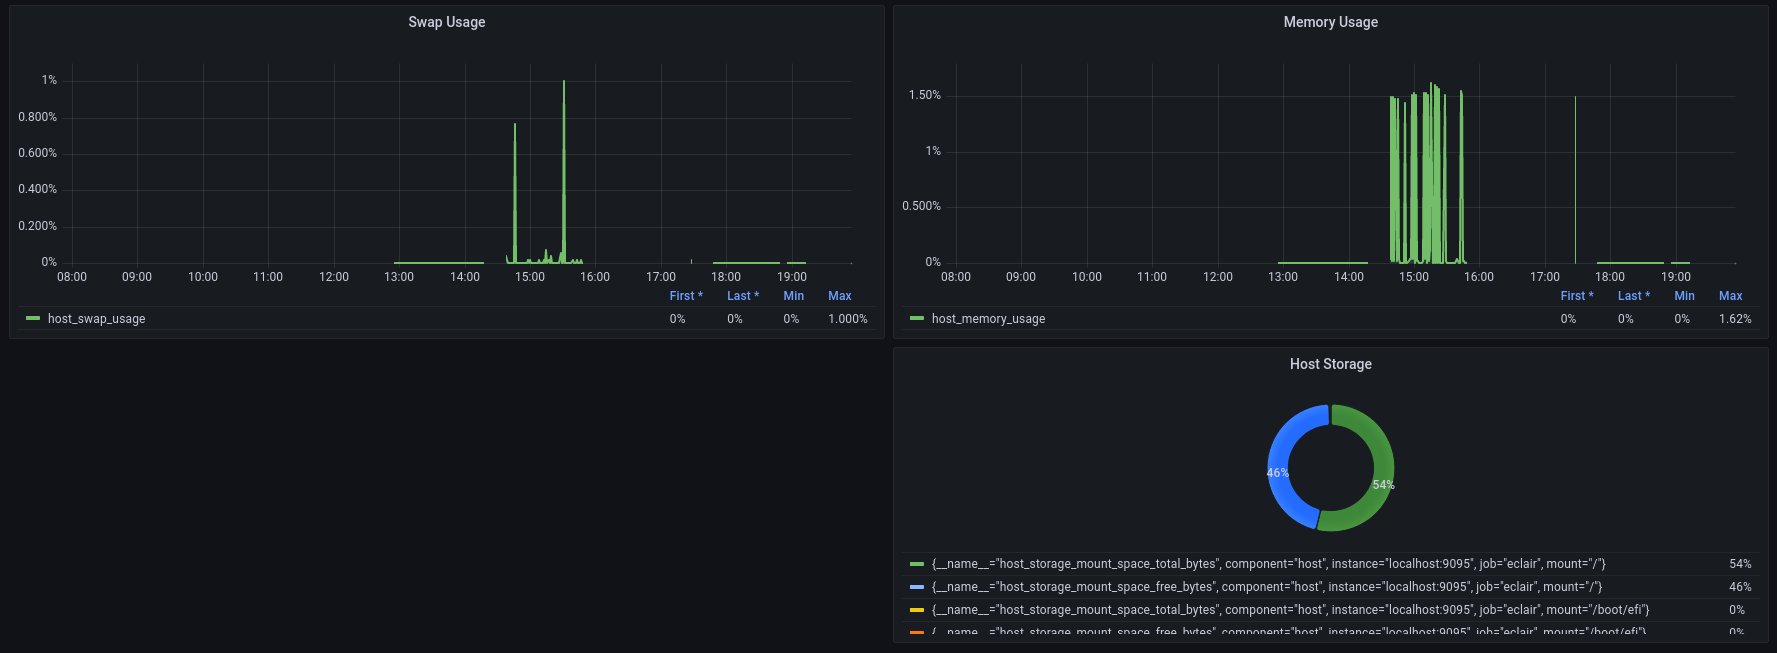
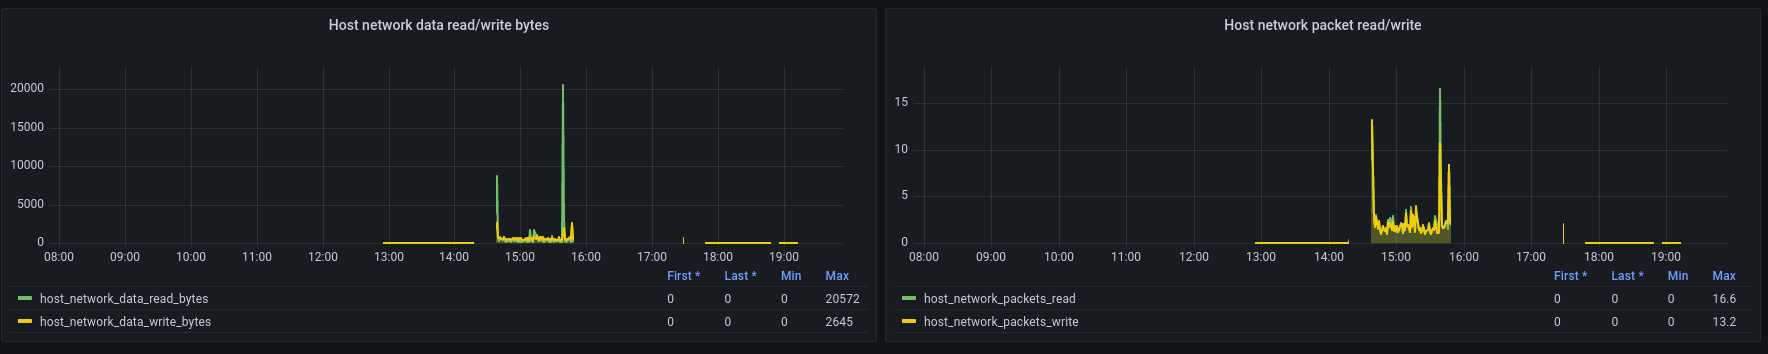
The JSON file contain fours rows with various panels. That helps users to monitor their
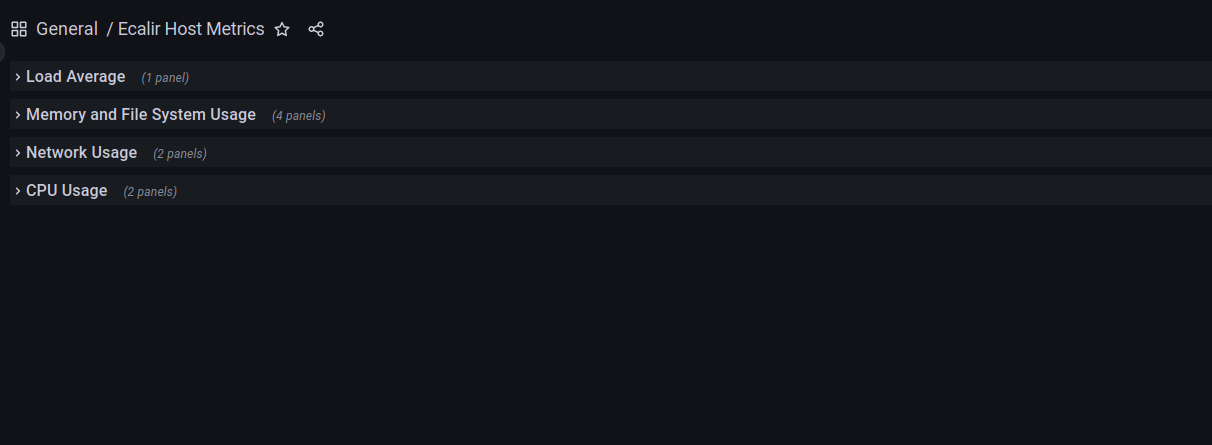
eclair host metrics.Load Average (1 panel).
Memory and File System Usage (3 panels).
Network Usage (2 panels).
CPU Usage (1 panels).