Repository navigation
Diagrams and Charts
Ask the index a question, get a chart back. A chart question turns one
formal question about one selected symbol into a clickable diagram: who calls
this, what breaks if I change it, which tests reach it, what does this form
wire, where does this protocol command travel. In RAD Studio, ask from
drag-lint > Reports with the caret on the symbol. Outside the IDE the
questions are answered in-process by the engine (drag-lint ask); no PowerShell is needed (see Charts and the IDE).
The engine verb drag-lint ask ships; the full call design is below.
drag-lint is not a model, and these charts are not drawn from prose. Every diagram comes from a FORMAL CALL -- a question id, a selection and parameters -- and every row in it is a fact from the index with a file and a line.
drag-lint ask --list --at <file.pas>:<line>:<col> --db <project.sqlite> --json
drag-lint ask --question <id> --at <file.pas>:<line>:<col> --db <project.sqlite>
              [--depth N] [--format svg|mermaid|json]
-
--listresolves the selection and returns ONLY the questions valid for its kind -- a method getsbutterfly,who-calls,effects...; a unit getsdepsandcycles; a form class getslifecycleandevent-wiring. An editor never hard-codes the menu; it asks and renders what comes back. -
--atis a caret position, resolved exactly as Type at Cursor (typeat) resolves one. -
--dbis the project index, as everywhere else -- and the platform library index after it when an RTL/VCL ancestor or type should resolve.
What runs TODAY -- the same questions by NAME, through the chart pipeline:
drag-lint ask <id> --target <Unit.TType.Member | Unit | project> --db <project.sqlite>
               [--depth N] [--cap N] [--out-root <dir>] [--open]
| Question | You select | The chart shows |
|---|---|---|
butterfly |
method | callers and callees in one chart |
who-calls |
method | N-deep caller tree, cycle-guarded |
what-it-calls |
method | N-deep callee tree |
path |
method A + method B (-To) |
every shortest call path A -> B, each call with its site and grade |
who-writes |
field / property | every routine that assigns it |
who-reads |
field / property | every routine that reads it |
change-impact |
method / type | everything a change here could break, by zone and hop |
tested-by |
any symbol | the DUnitX tests whose call trees reach it |
effects |
method | what it mutates, and whether it is Effect-free (proven) |
touches-tables |
method | which database tables it reads and writes |
class-surface |
type | members by visibility |
hierarchy |
type | ancestors above, descendants below |
deps |
unit | used-by and uses, grouped by source directory |
cycles |
unit / project | circular dependencies, every edge drawn |
wiring |
interface | Spring4D registrations and resolve sites |
lifecycle |
form class | create -> show -> destroy: wired / implemented-not-wired / absent |
event-wiring |
form class | which handler runs on which control event |
architecture |
project | units as source-directory zones, back-edges in red |
protocol-trace |
command constant / method | where a protocol command travels |
crosses-boundary |
method | whether and where the work leaves the process |
shown-where |
database column | which forms and controls display it |
exception-paths |
method | what it raises, what it handles, and where each exception is caught up the caller chain |
consumers |
table / column | the routines that read and write it, plus its triggers, procedures and indexes |
feeds-from |
form control | the chain that feeds it: control -> datasource -> dataset -> view-model -> table.column |
lands-where |
ORM property / field / form control | where its value lands: TABLE.COLUMN, the server code that writes and reads it, and the triggers that use it |
Every answer is a bundle written to one folder named after the question and the selection:
| File | What it is |
|---|---|
graph.svg |
The chart. Every row is a real link (see Click to source) |
graph.png, graph.pdf
|
Raster and document exports of the SAME layout |
graph.dot, graph.plain
|
The Graphviz input and the layout geometry. One dot run writes all four outputs, so the picture and its hit-test geometry cannot drift |
index.html |
A browser shell around the chart, with the counts in its header |
meta.json |
The index fingerprint (path, size, mtime), every count the question produced, and the exact command that regenerates the bundle -- so a stale chart is DETECTABLE, not merely suspected |
xref.txt |
A DocInsight <remarks> block to paste into the unit, pointing at the chart |
These are not autodocumentation. A chart is large, slow to produce and stable over time, so nothing generates one on a build. You ask deliberately and paste the REFERENCE; the volatility lives in the file (a stable path plus a regenerated artifact), never in the comment.
- Rows, not nodes. Symbols are clickable text rows inside one rounded box per unit (or per source directory), so 30 routines read as 6 boxes and every row keeps its own file and line.
-
Nothing is dropped silently. When a cap hides rows the chart says
+N more ... not shown; the header always carries the totals. - Certain vs inferred. A row reached by a resolved edge is certain; a row reached only by NAME (another routine that happens to share the name) is marked, and an inferred edge is drawn dashed.
-
A refusal is an answer.
touches-tableson an index that owns no database connection, orwiringon a class, refuses with the reason instead of drawing an empty chart that would read as "nothing".
Each row in graph.svg links to draglint://open?file=<path>&line=<n>. With
the protocol registered (one HKCU key, no elevation:
drag-lint protocol register; drag-lint protocol unregister undoes it), a
click opens the line in RAD Studio through the drag-lint IDE plugin's
open-source pipe (\\.\pipe\drag-lint-open-source), or in Notepad when no IDE
is listening. See the handler.
- A project index (
<project folder>\_D-RAG\<project>.sqlite), fresh -- a stale index draws a stale chart, andmeta.jsonrecords which one was used. - Graphviz
dot(layout engine) on the machine. -
protocol-traceandcrosses-boundaryneed an index resolved at resolver 1.6.0-alpha or later (enum-value binding); runindex --all --resolve-onlyonce on an older index.
All three were produced by the chart pipeline against a COPY of drag-lint's
self-index (src\cli\_D-RAG\drag-lint.sqlite, engine 1.17.0-alpha, resolver
1.6.0-alpha). The SVG files are in the repository under
docs/Images/charts/; their rows link back to the source.
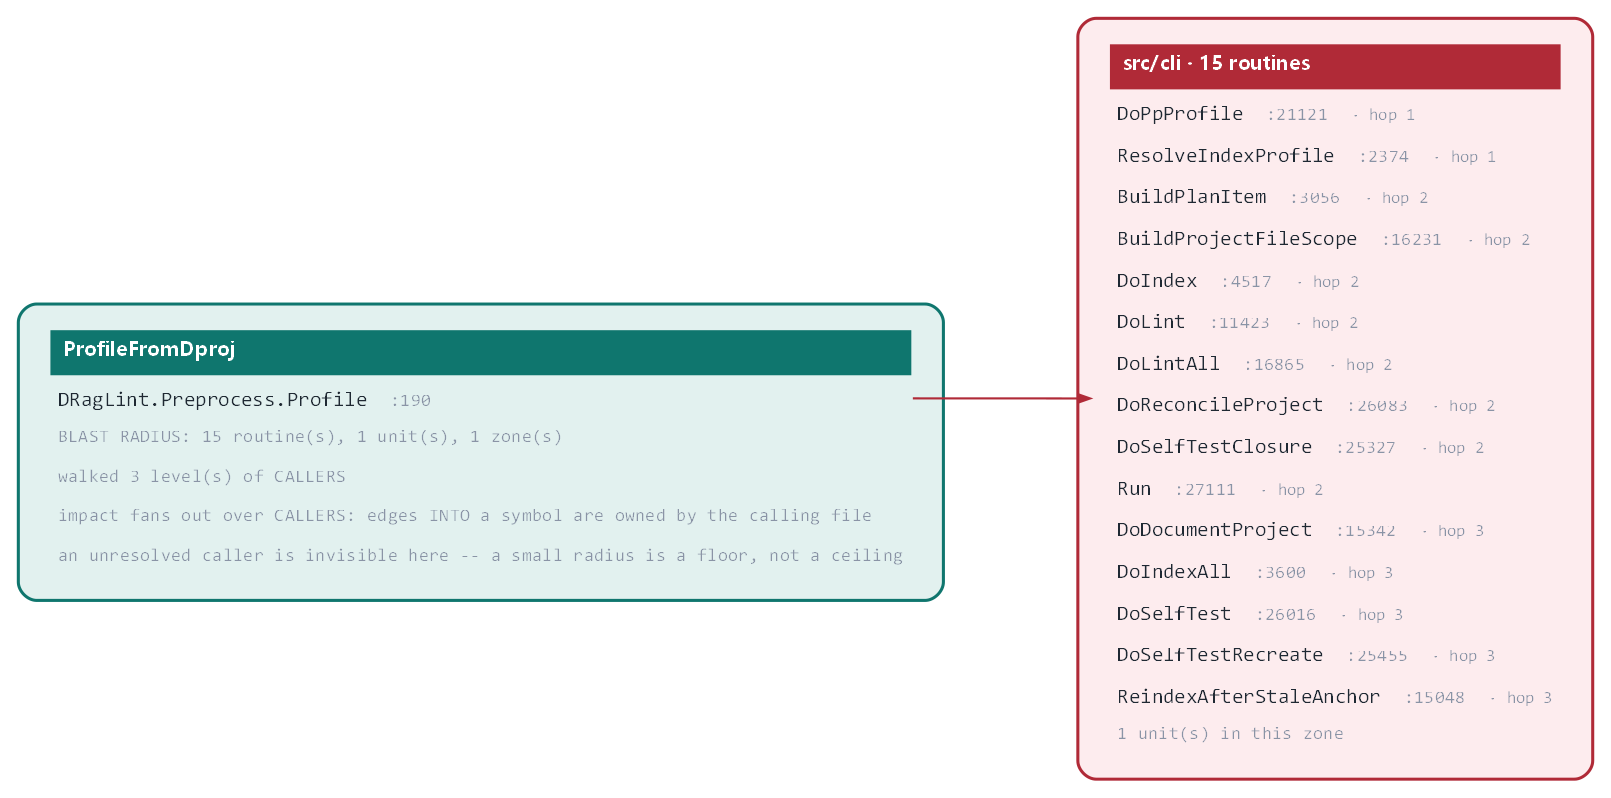
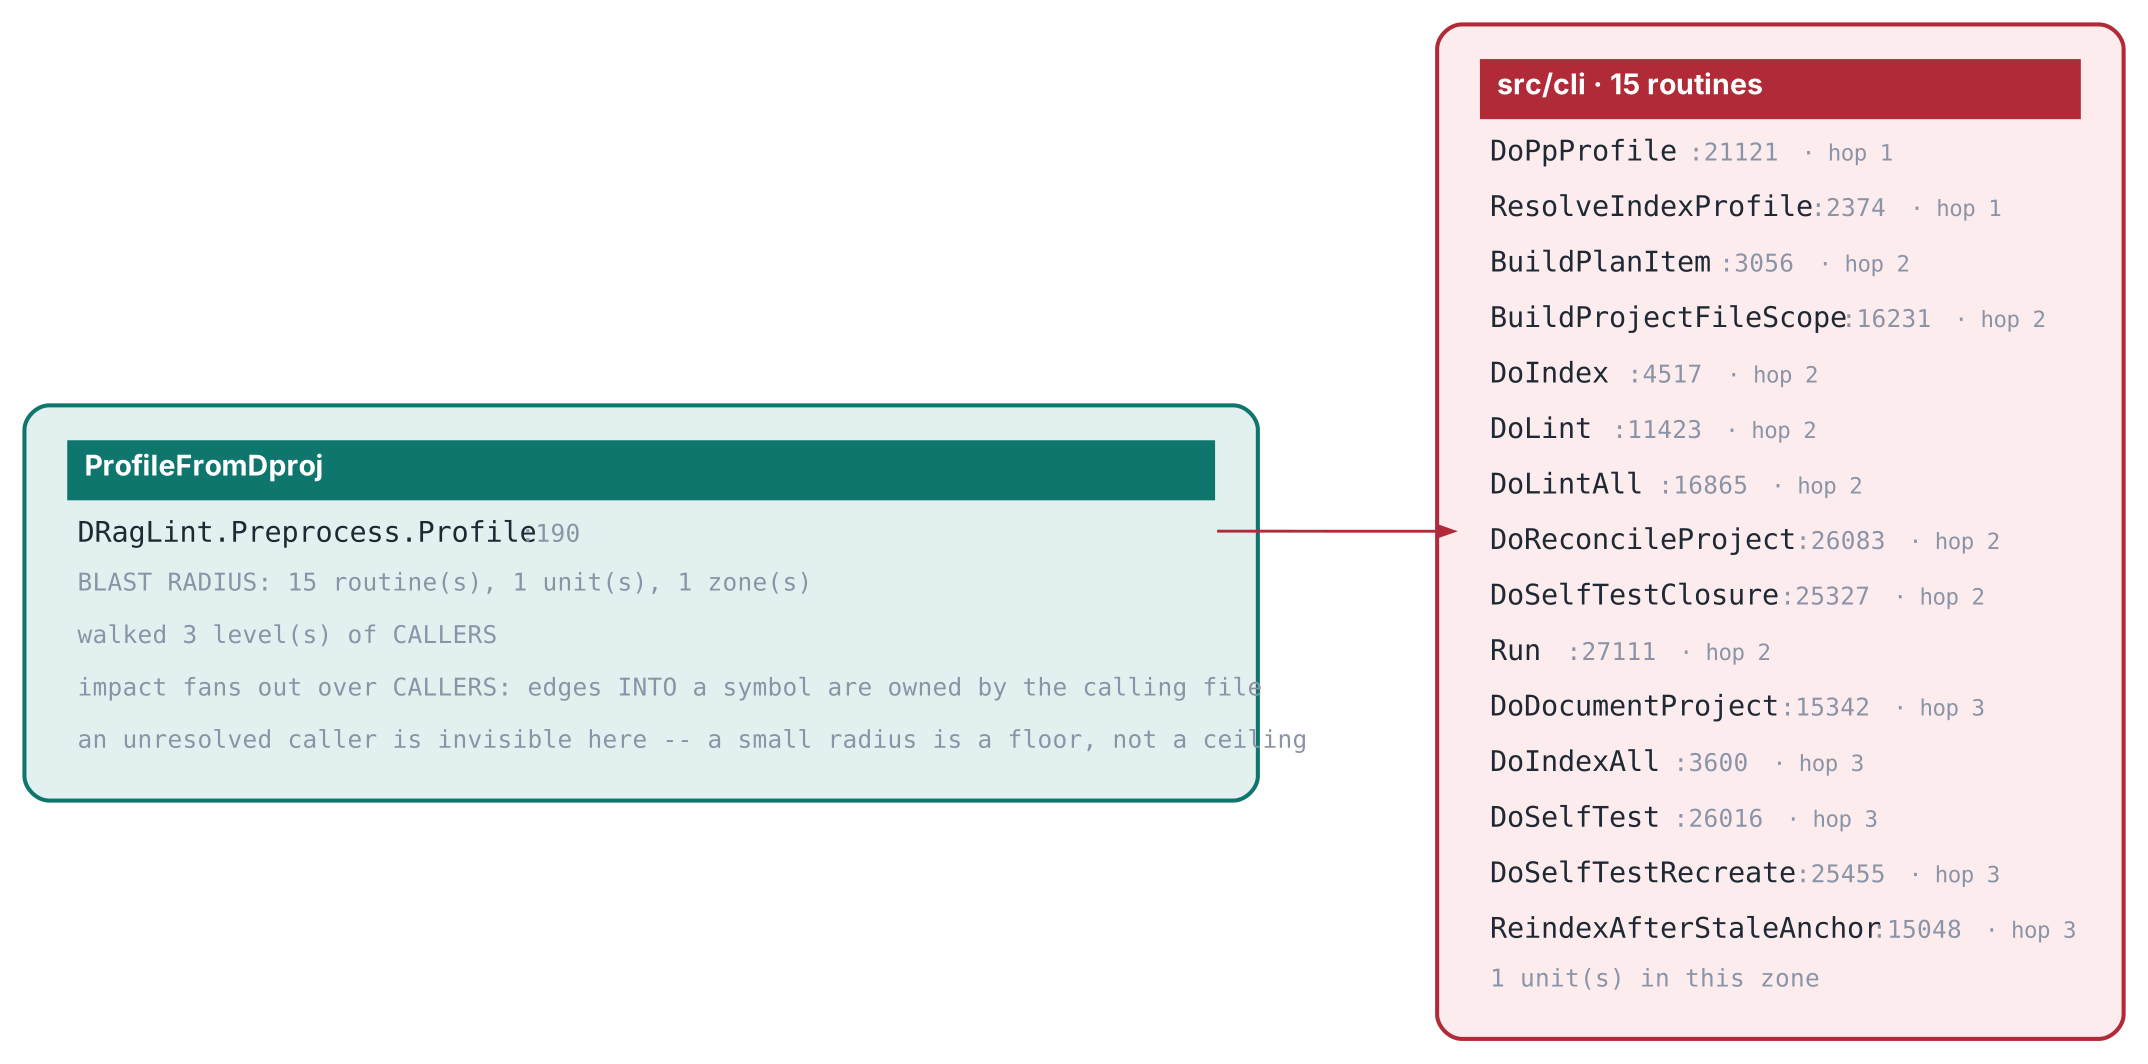
Question change-impact, target DRagLint.Preprocess.Profile.ProfileFromDproj,
depth 3: 15 routines over 1 unit reach it within 3 caller hops --
pp-profile and ResolveIndexProfile directly, then the project closure
(BuildProjectFileScope), index, lint, lint-all, reconcile-project and
document --project. That is why the platform-PropertyGroup fix to this one
function moved the extractor version. Command:
drag-lint ask change-impact --target DRagLint.Preprocess.Profile.ProfileFromDproj --db <drag-lint.sqlite> --depth 3 --cap 16
(--cap 16 so all 16 rows show; the default draws 8 rows per zone and discloses the rest).
SVG
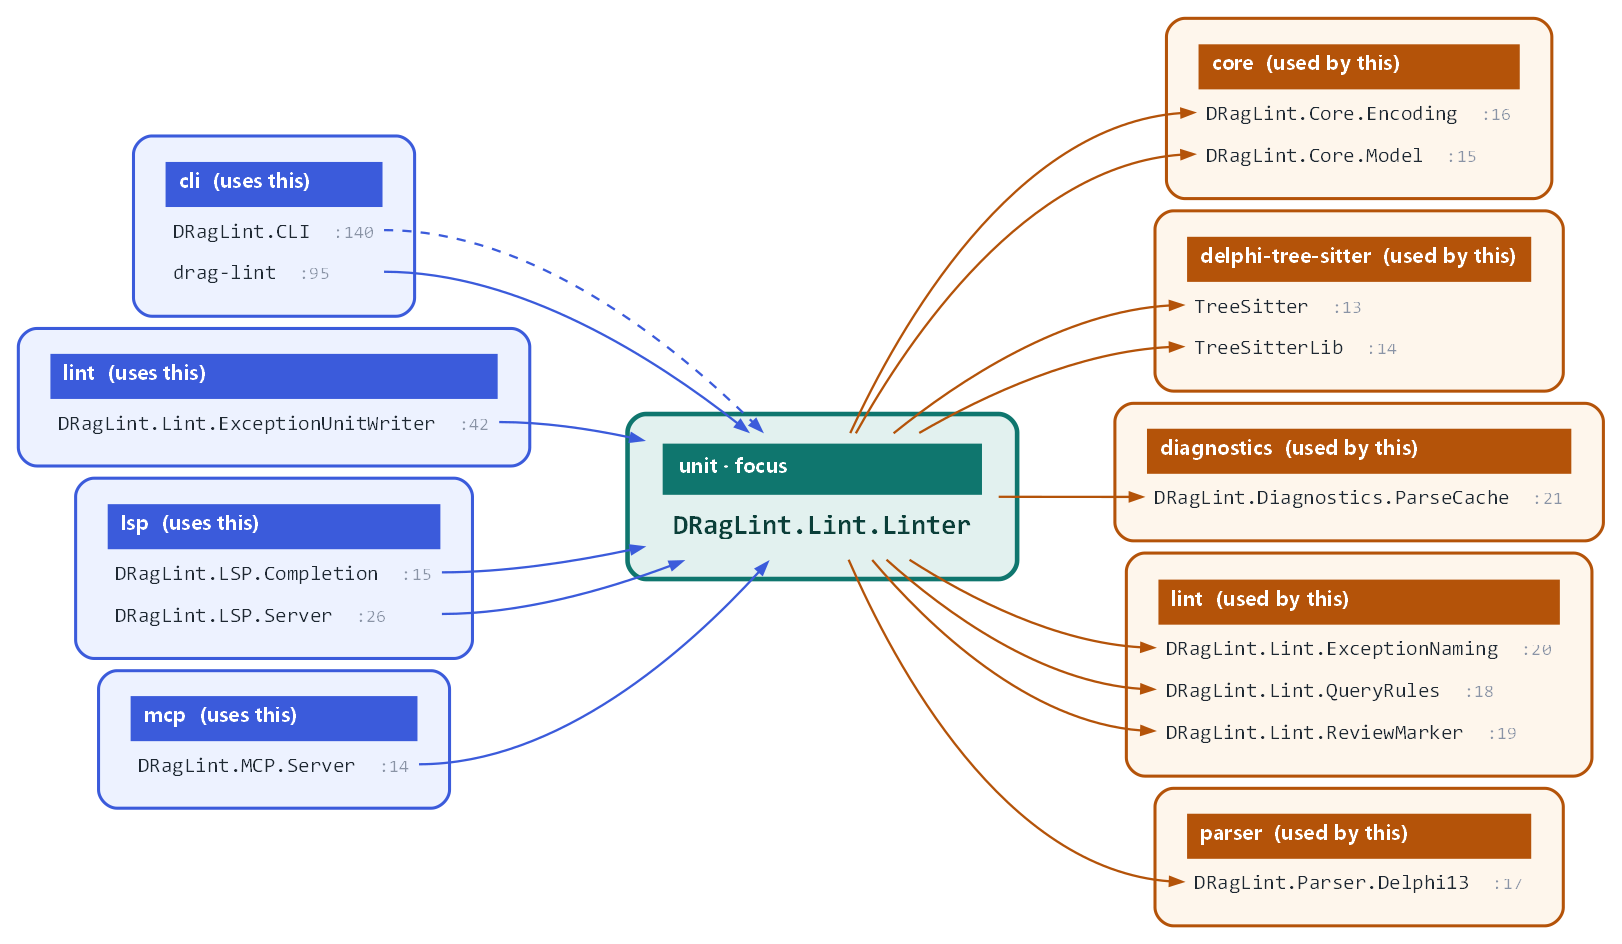
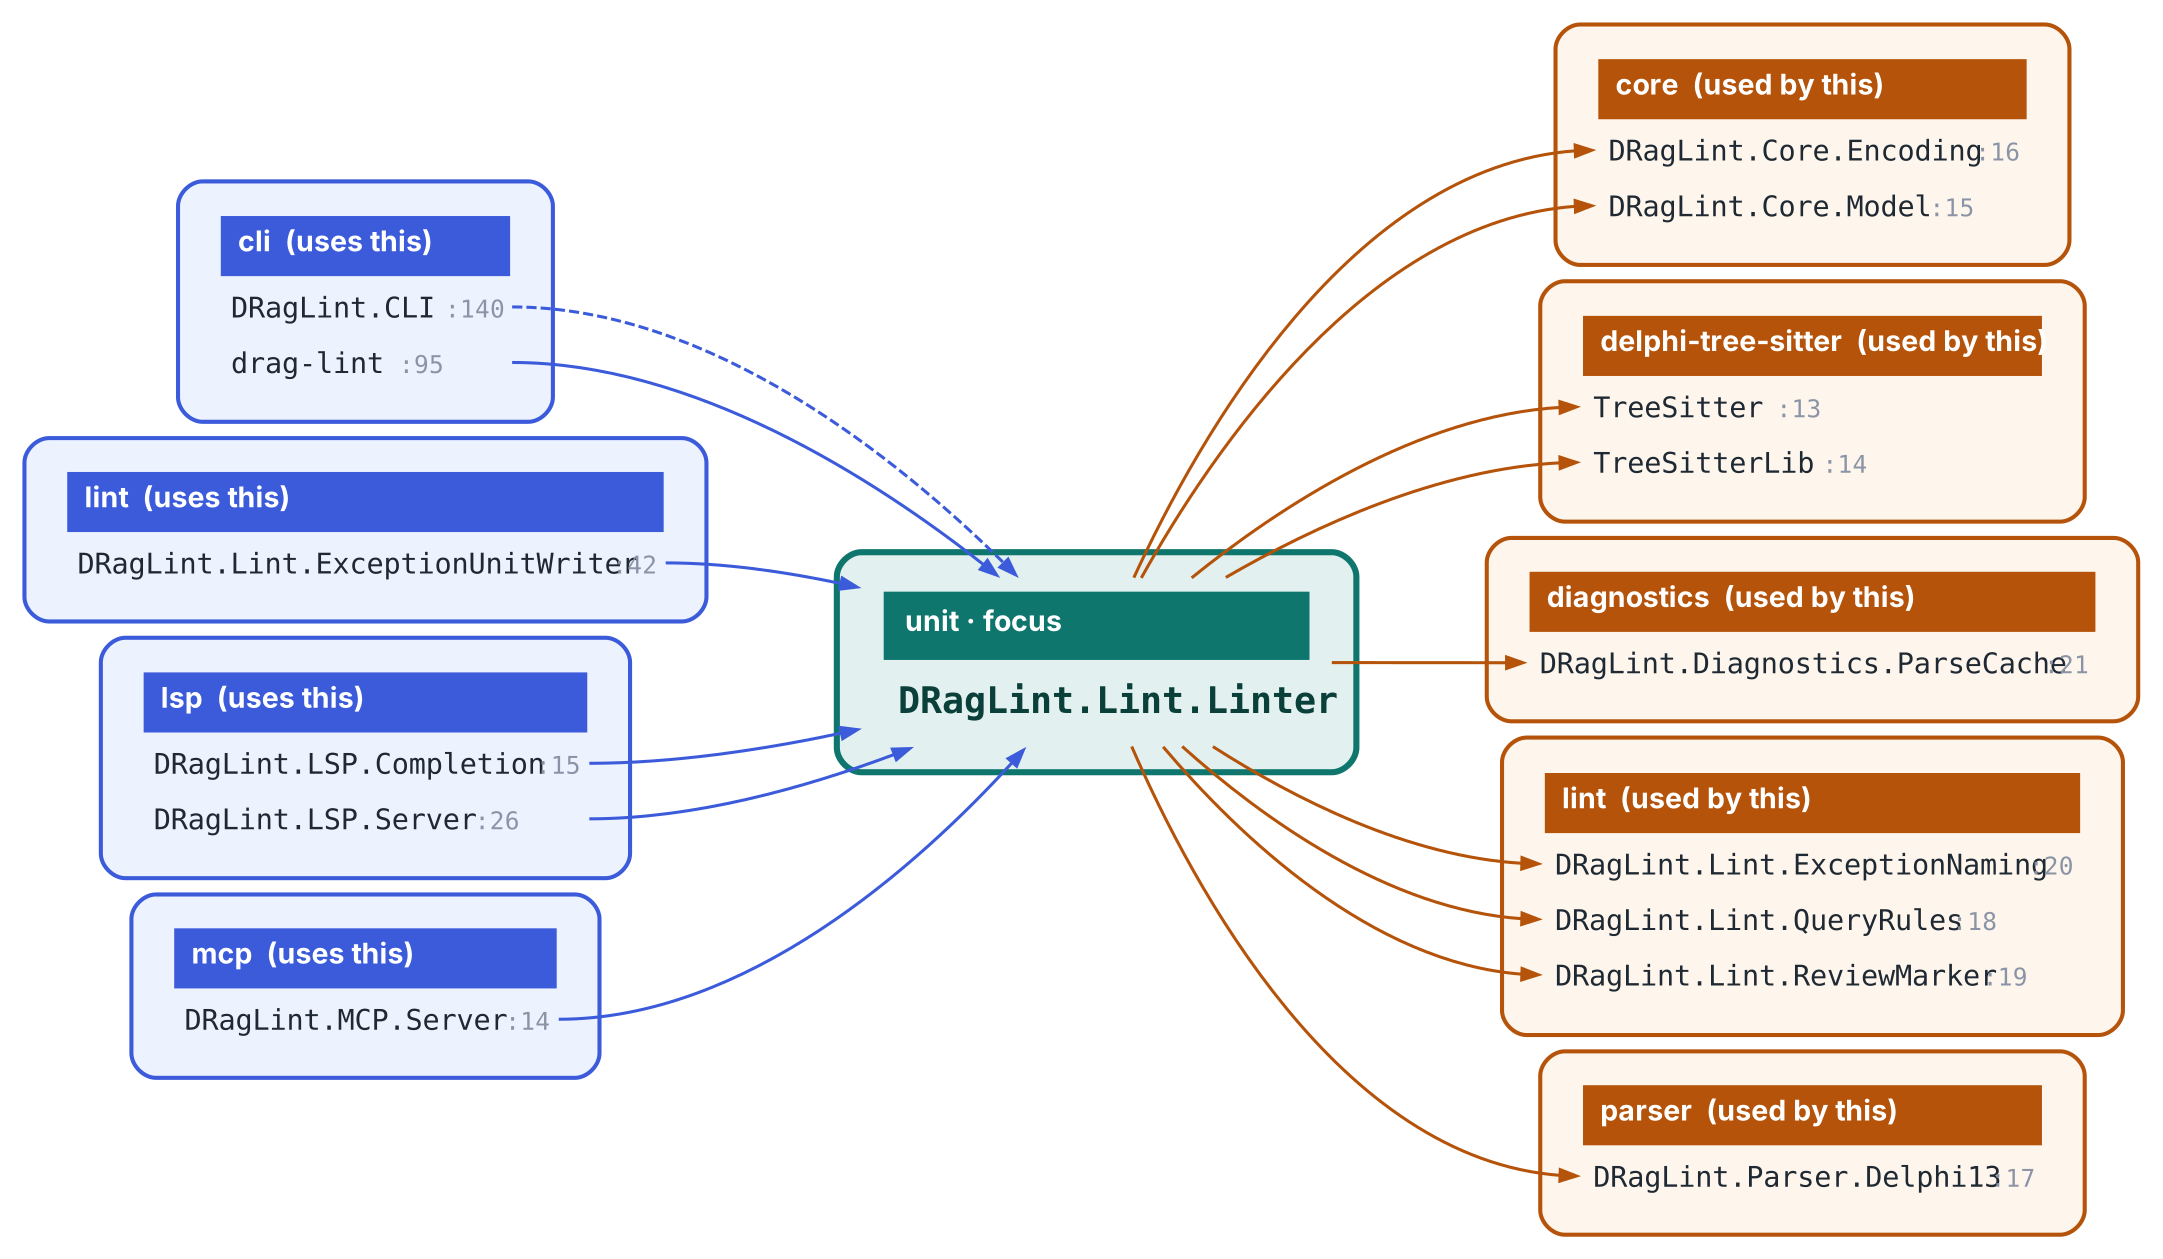
Question deps, target DRagLint.Lint.Linter: 6 units use it (the CLI unit and
program file, two LSP units, the MCP server, one lint unit) and it uses 9 (core, parser,
diagnostics, tree-sitter, three lint units), each grouped by src\ folder.
Dashed = an implementation-section uses. Command:
drag-lint ask deps --target DRagLint.Lint.Linter --db <drag-lint.sqlite>.
The whole-project architecture question on the same index
draws 129 units in 23 zones with 598 internal edges -- accurate and too dense
to read at page size, which is why a one-unit deps is the sample here.
SVG
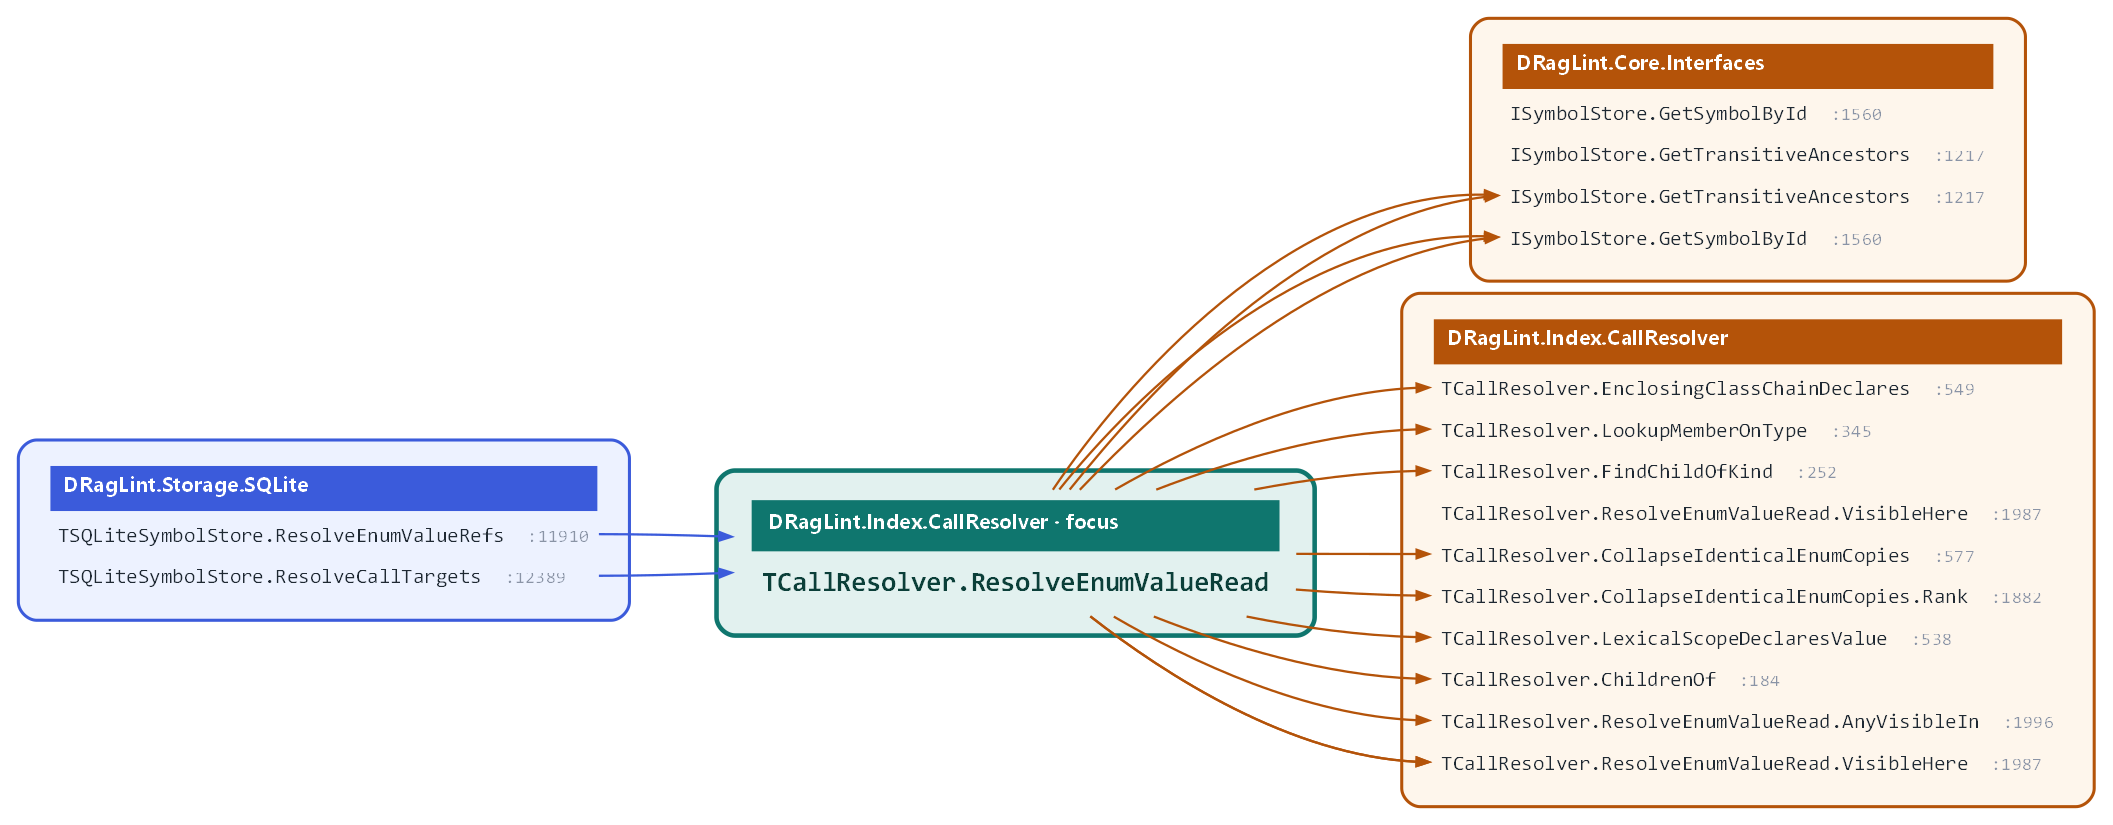
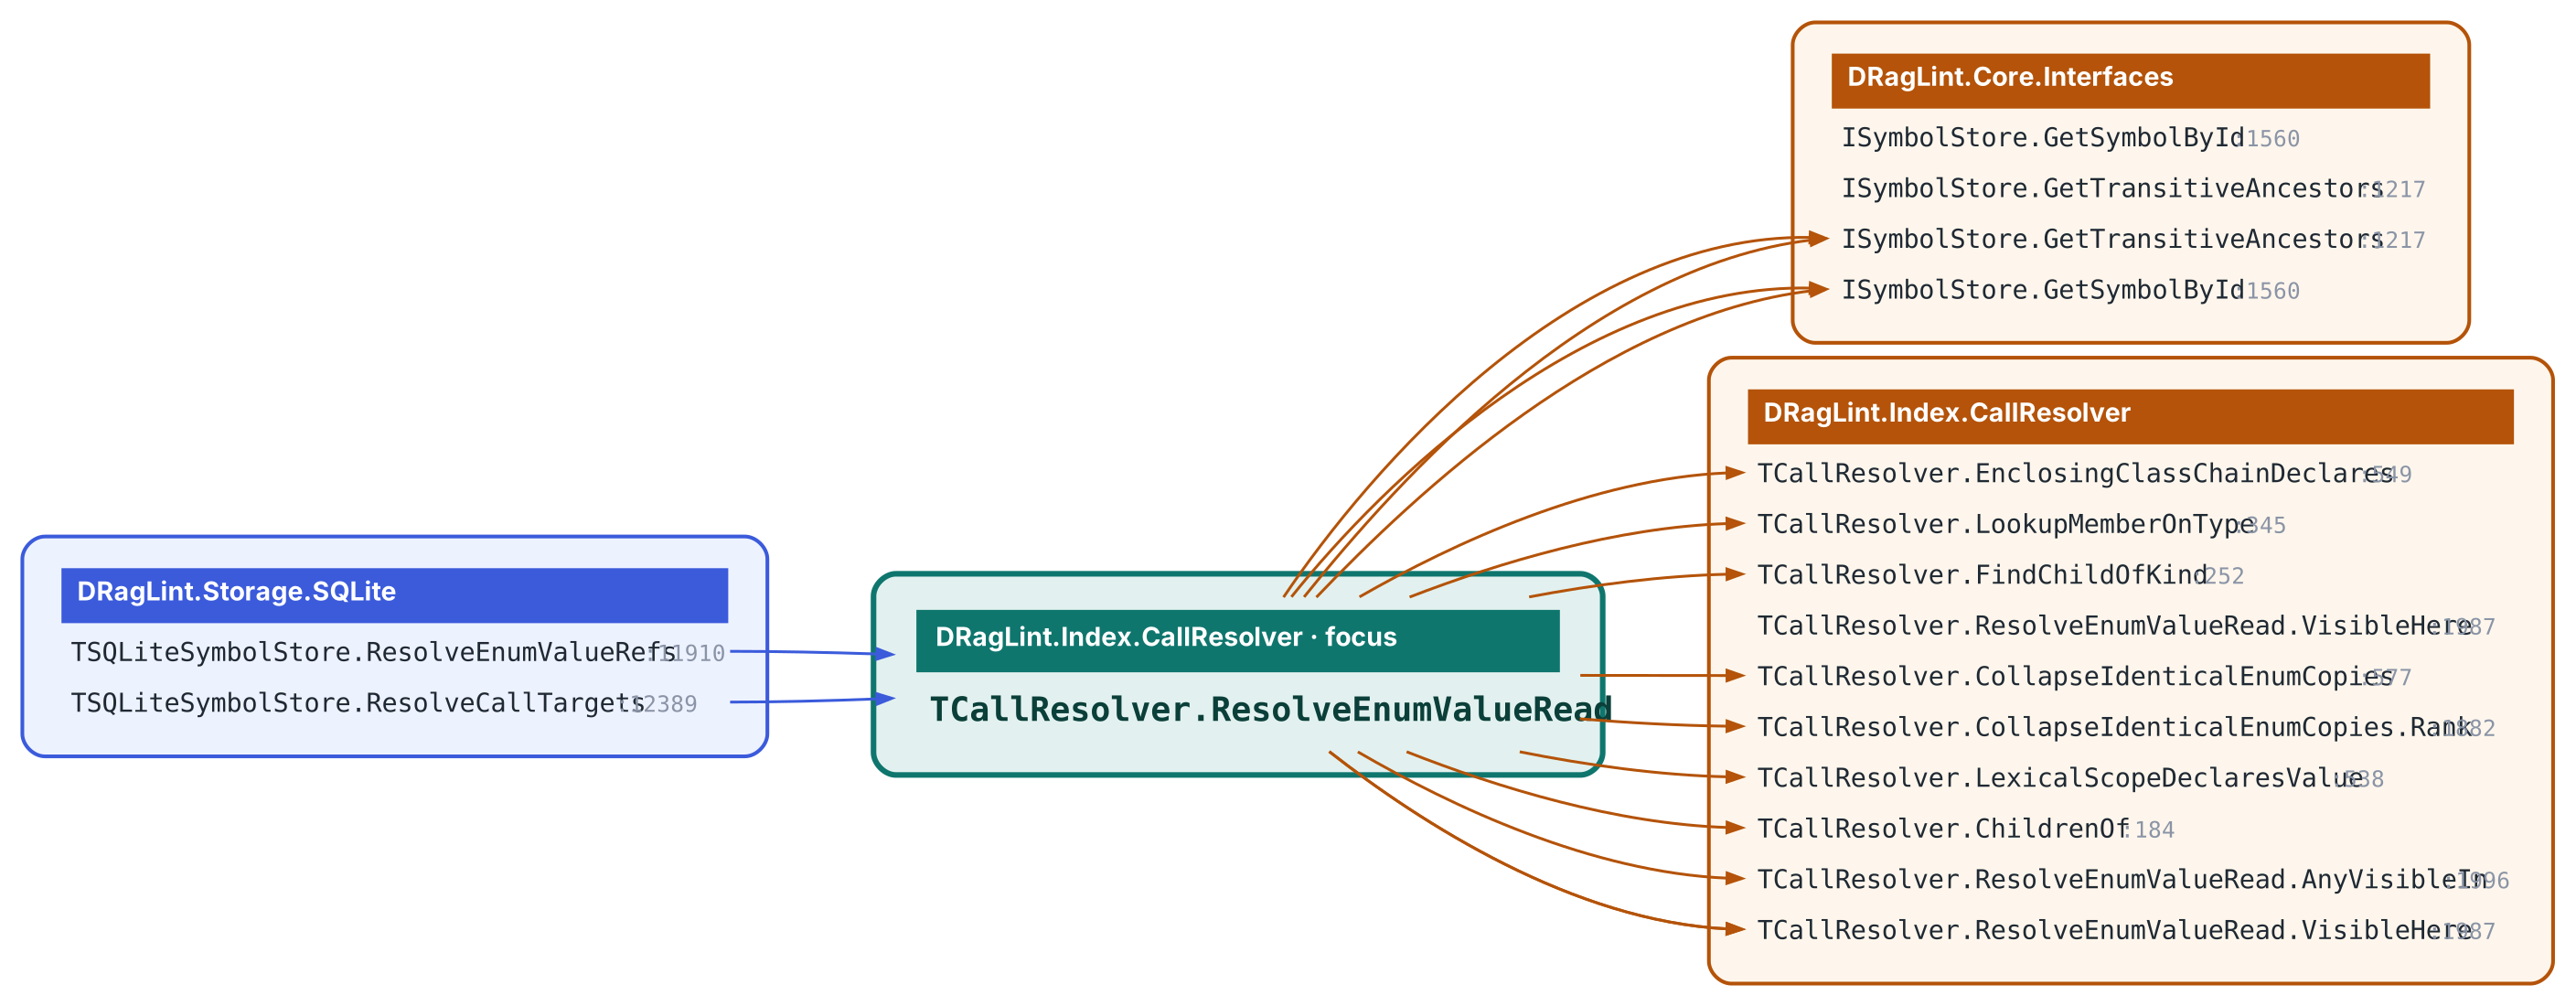
Question butterfly, target
DRagLint.Index.CallResolver.TCallResolver.ResolveEnumValueRead, depth 2:
2 callers (the store's enum-value and call-target resolve passes) and
14 callee rows (scope checks, the identical-copy collapse, and the symbol
store lookups). Command:
drag-lint ask butterfly --target DRagLint.Index.CallResolver.TCallResolver.ResolveEnumValueRead --db <drag-lint.sqlite> --depth 2.
SVG
butterfly, callgraph, reverse-calltree,
graph --format dot|mermaid, cycles, deps-report and
impact print the underlying data as dot, mermaid, text or JSON. The ask
questions render it -- grouped, capped with disclosure, and clickable.