Repository navigation
Class Statistics
Note: The images on this page are from the 2023 dataset and have not yet been regenerated.
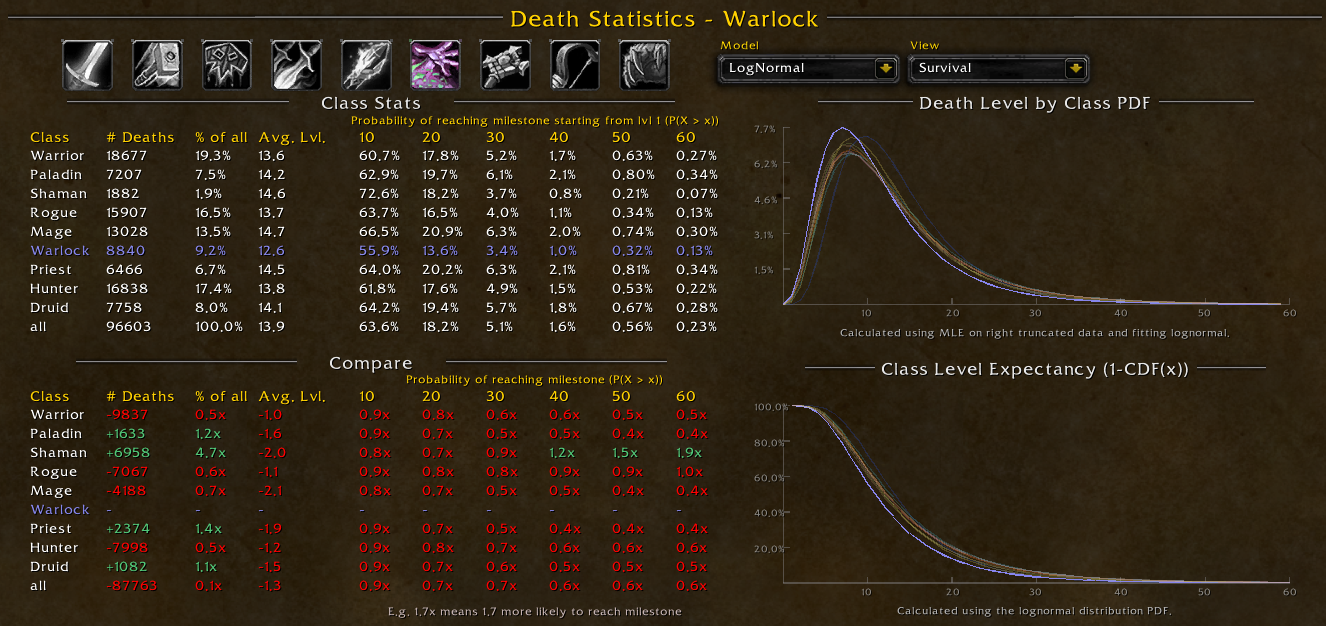
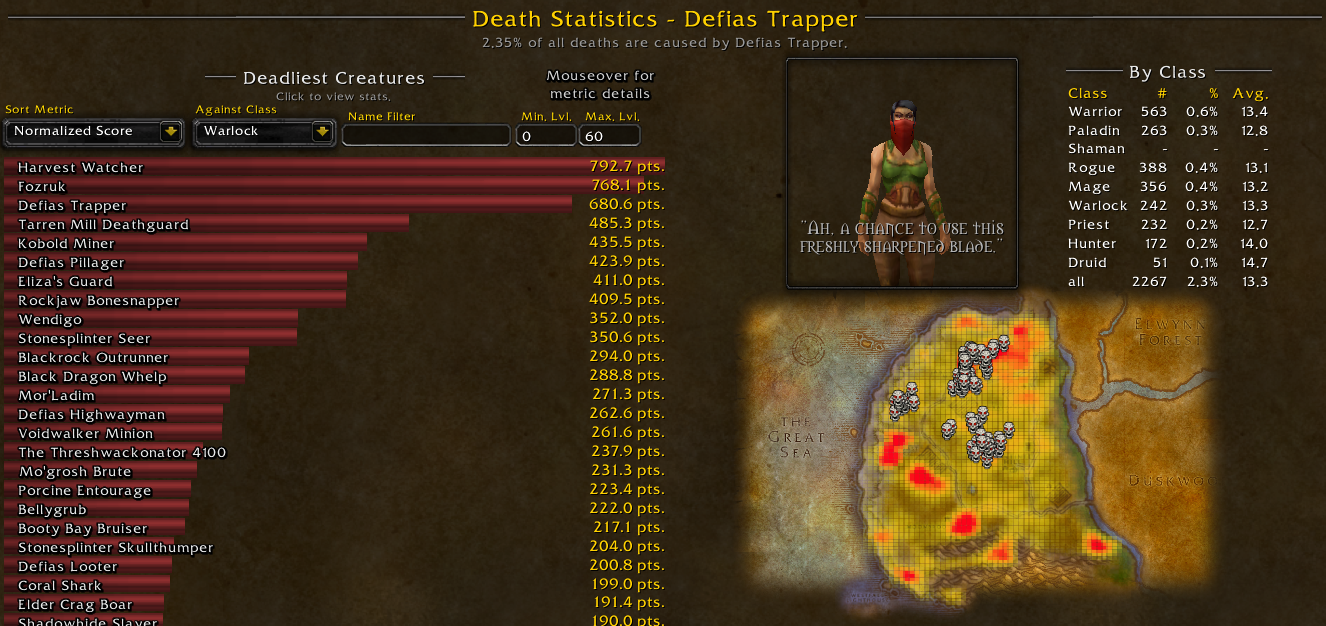
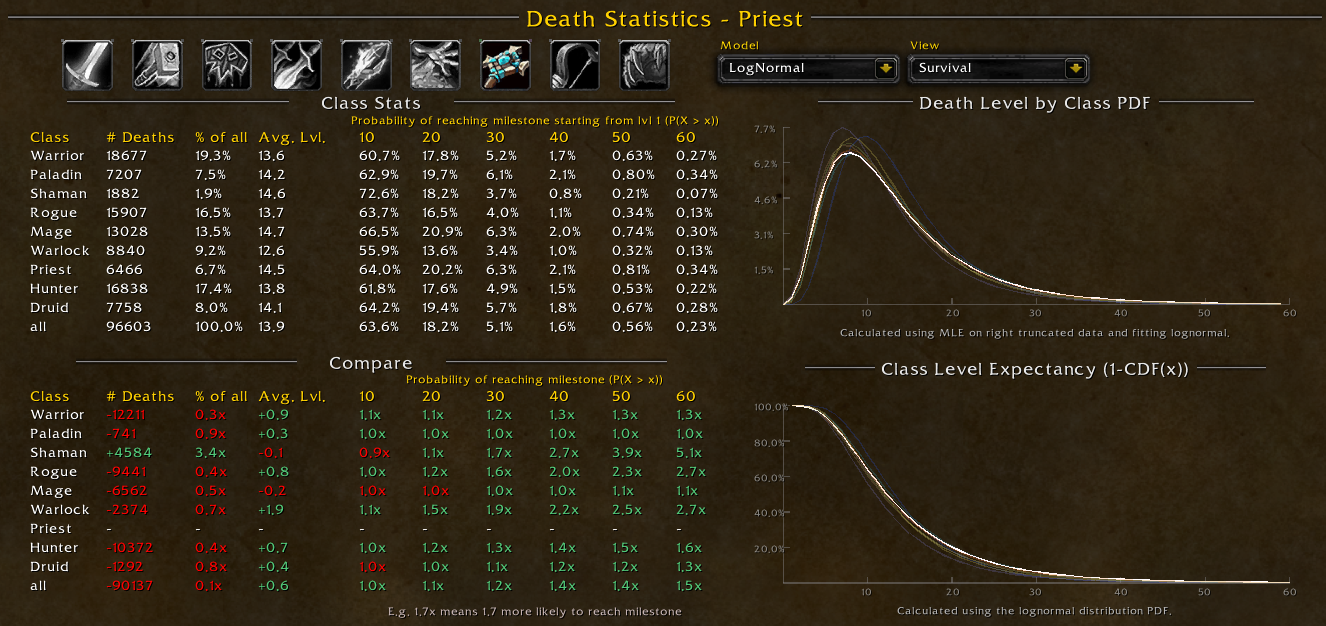
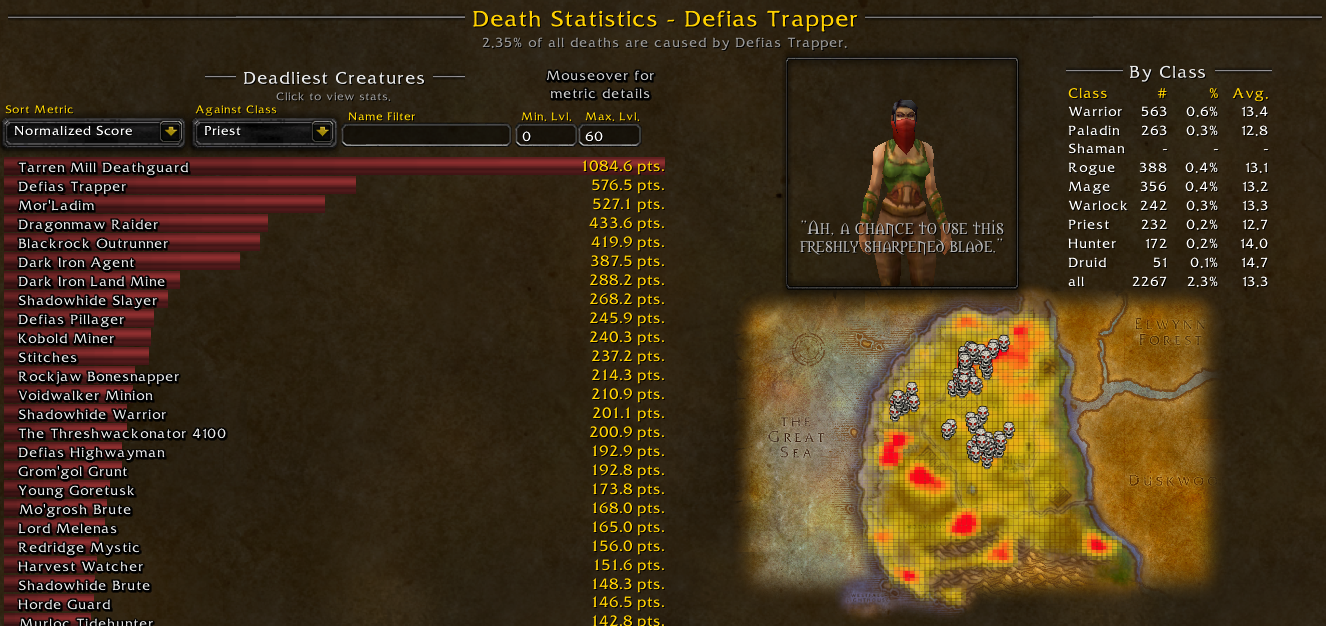
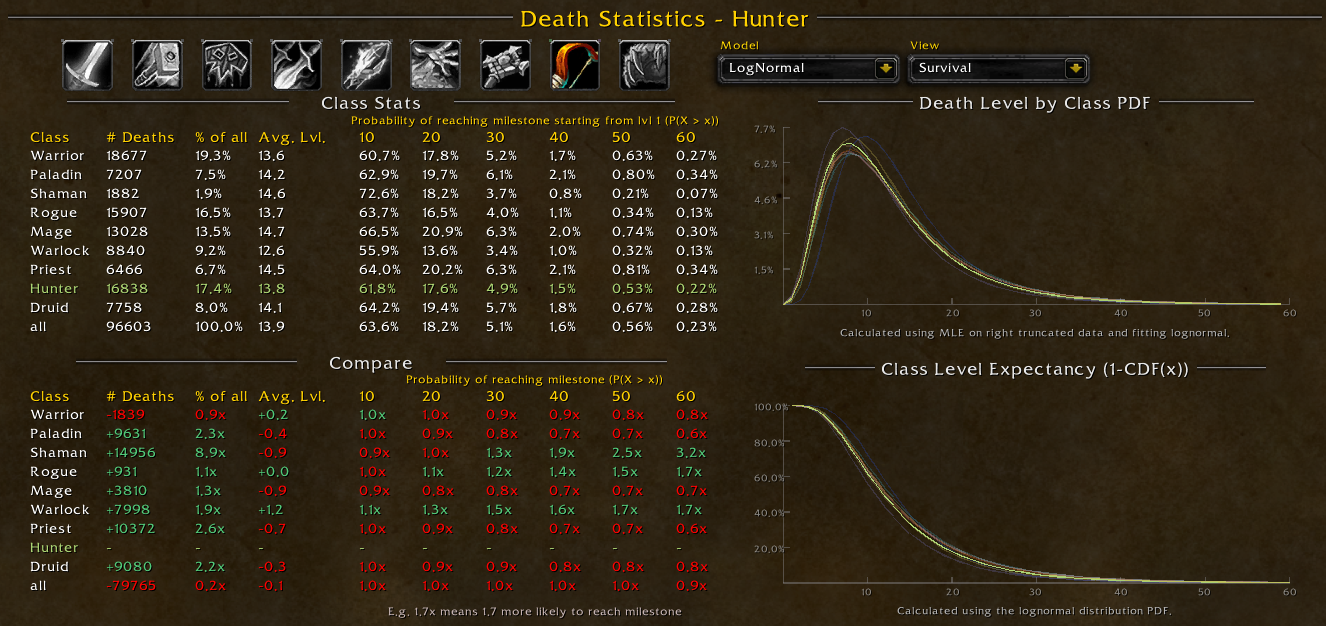
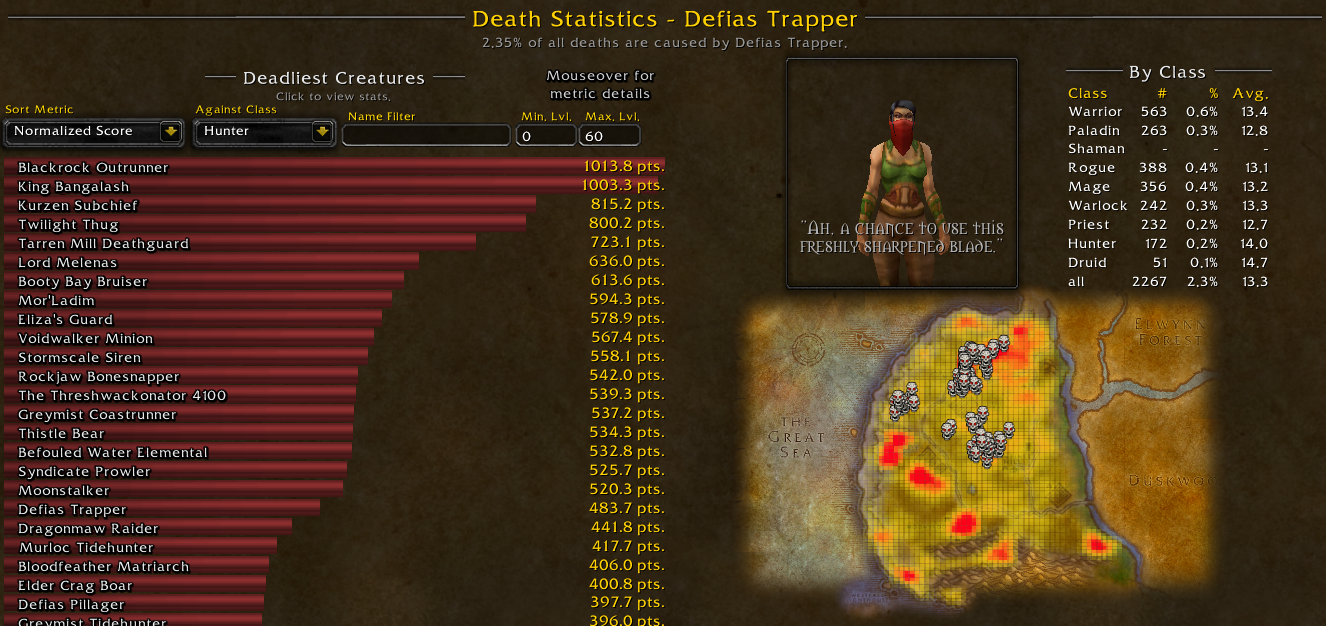
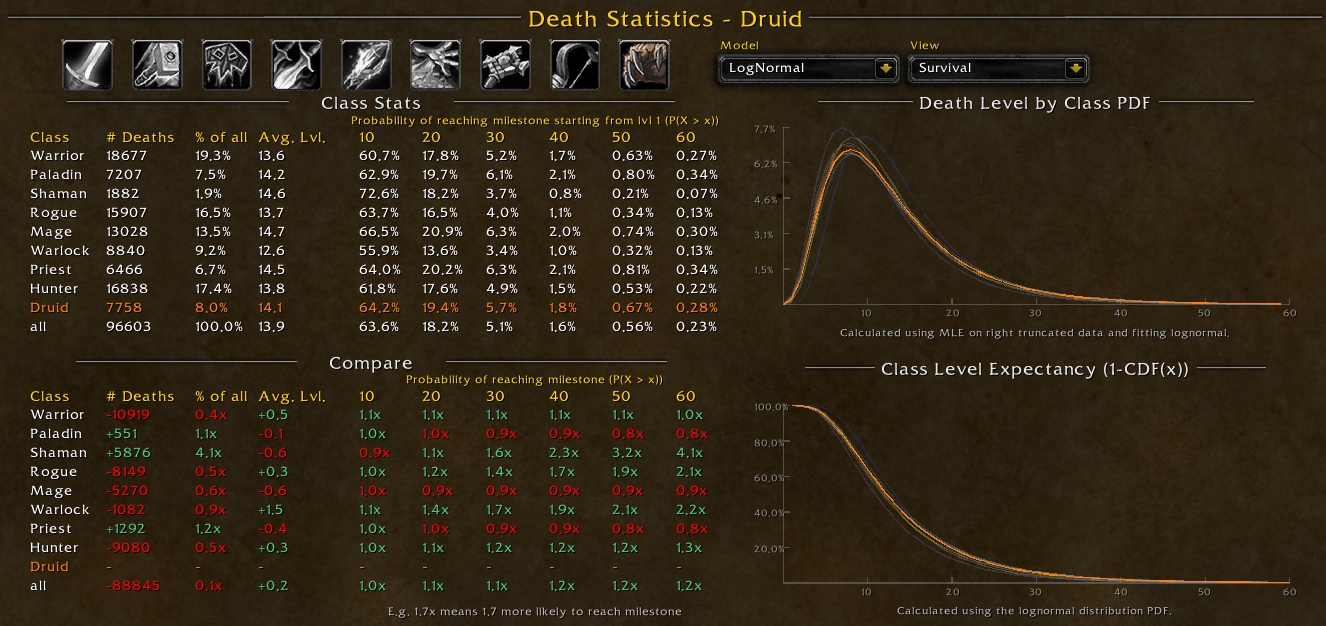
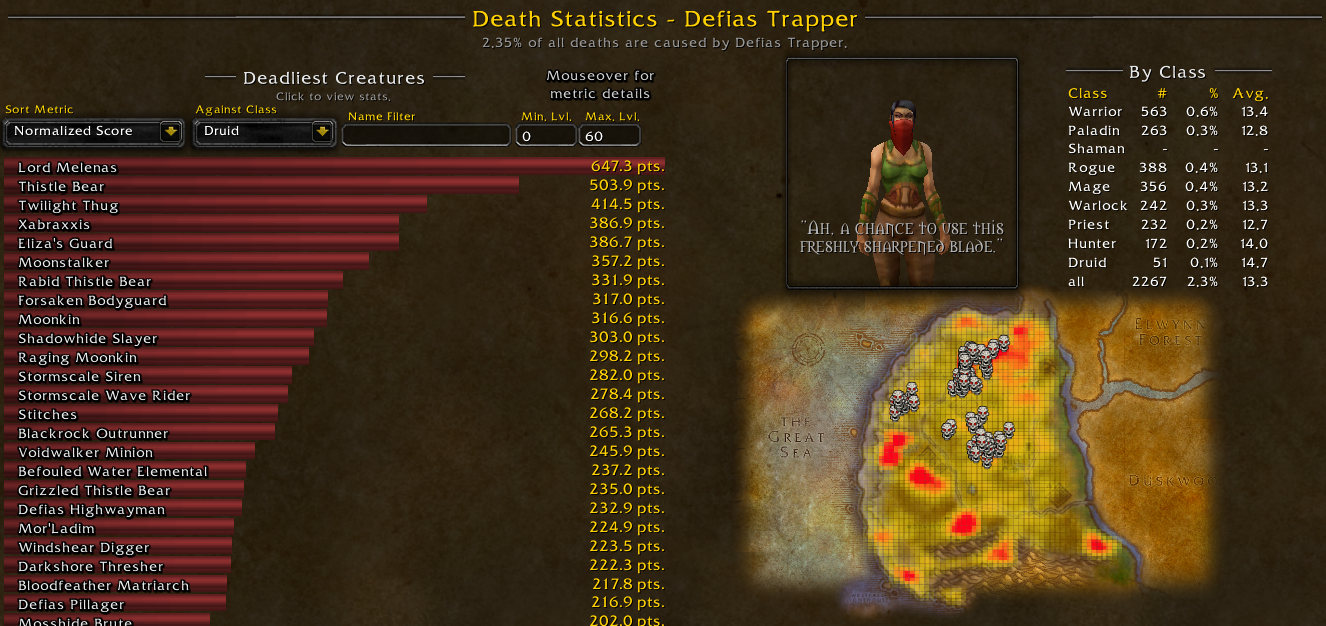
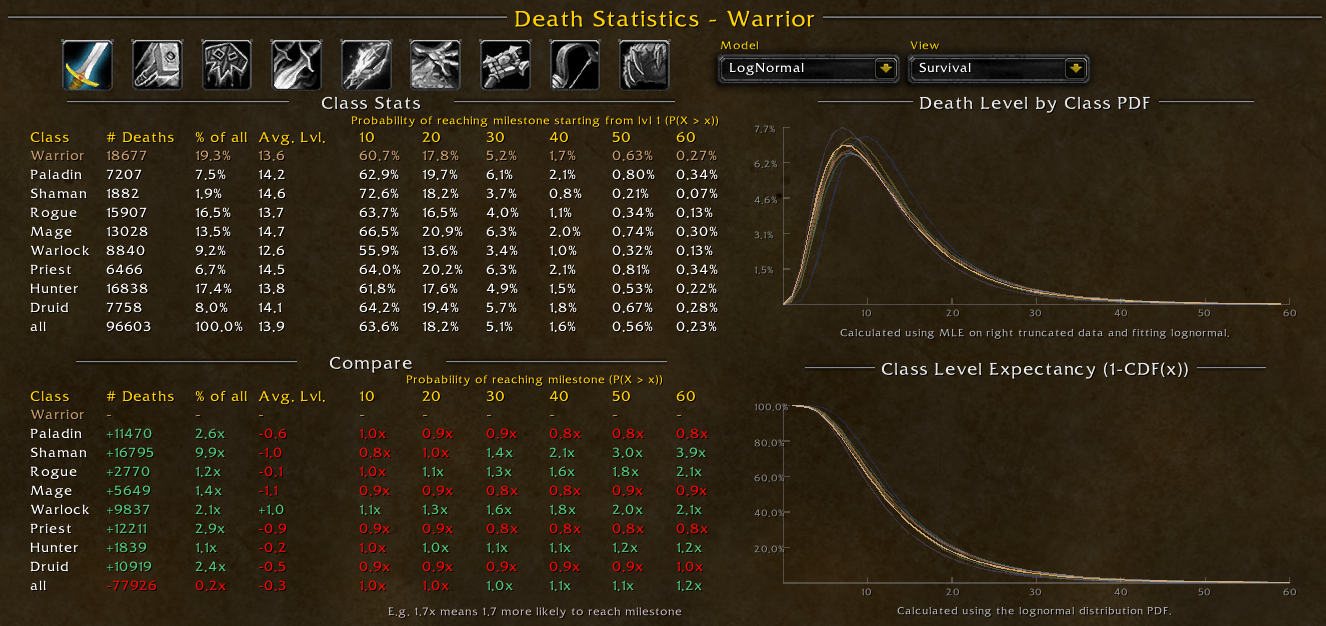
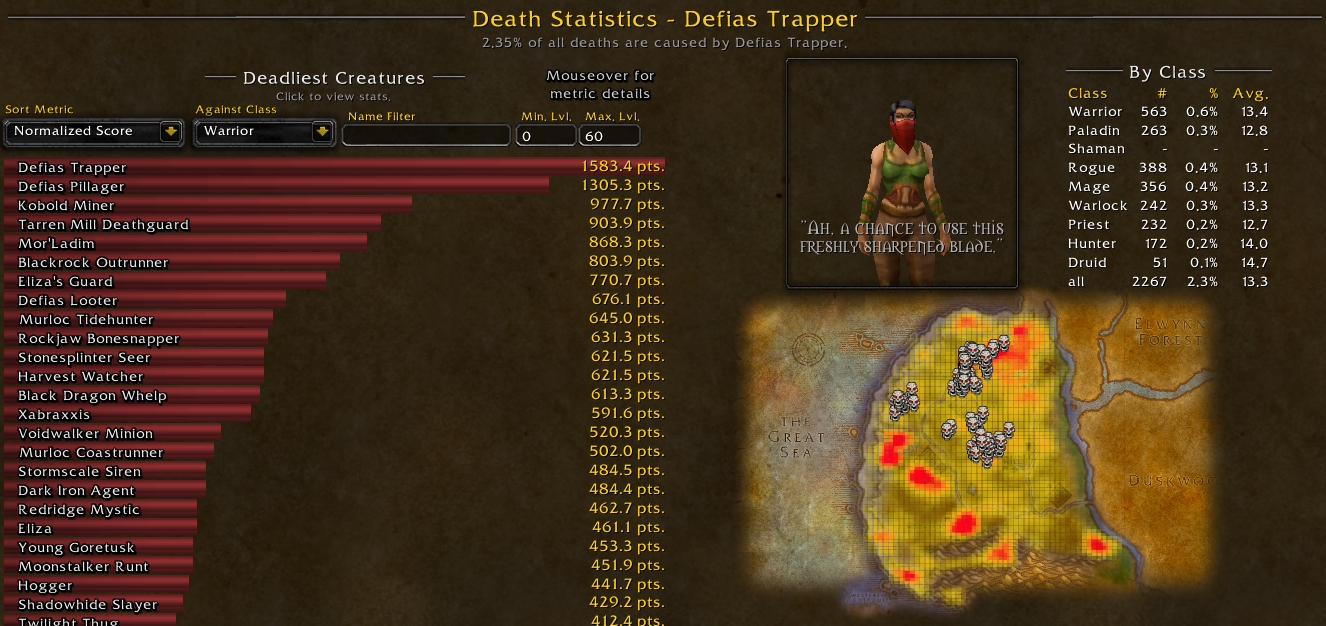
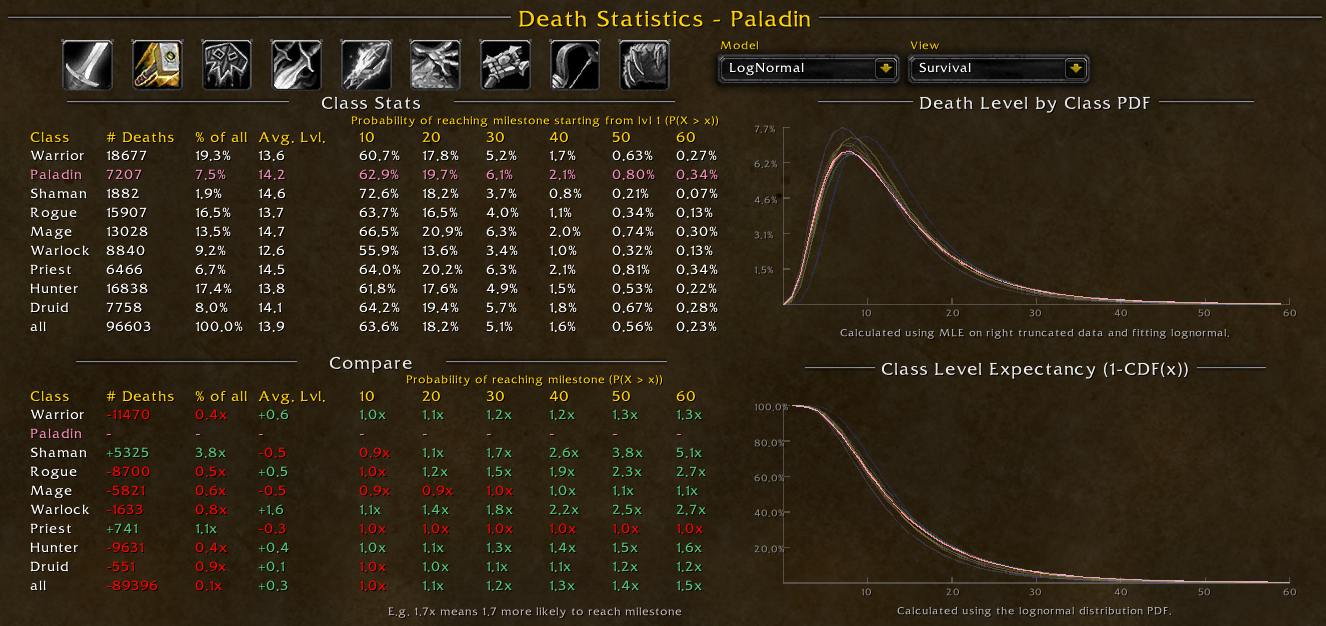
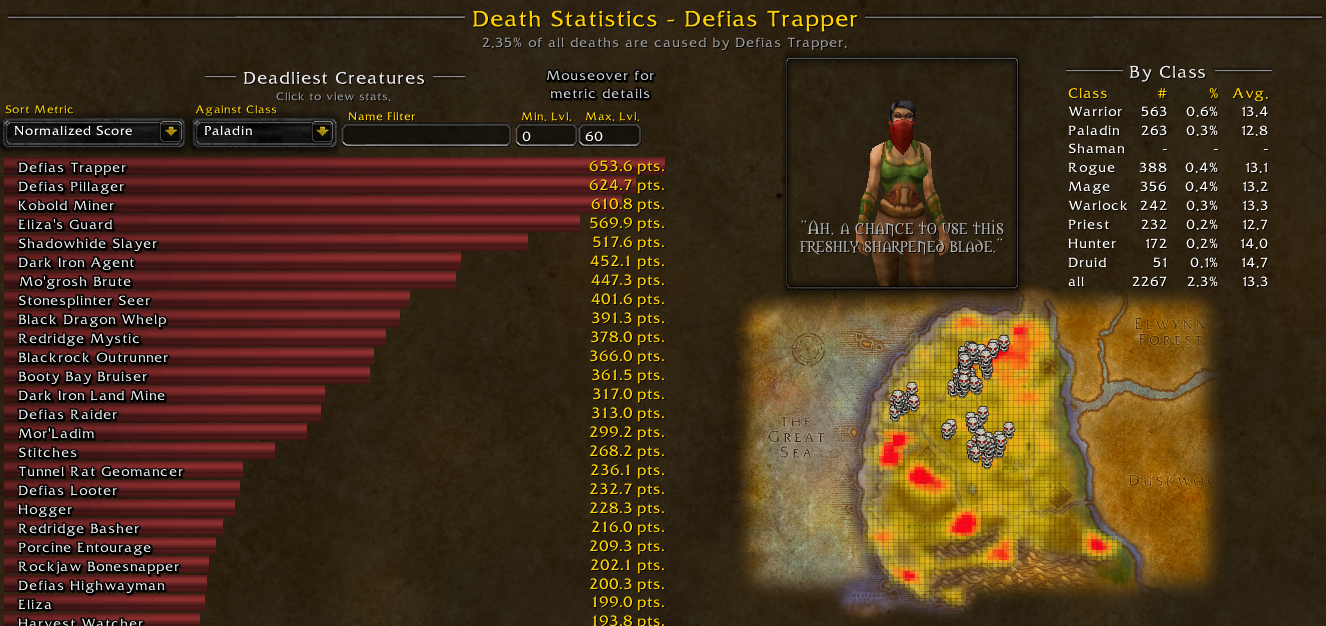
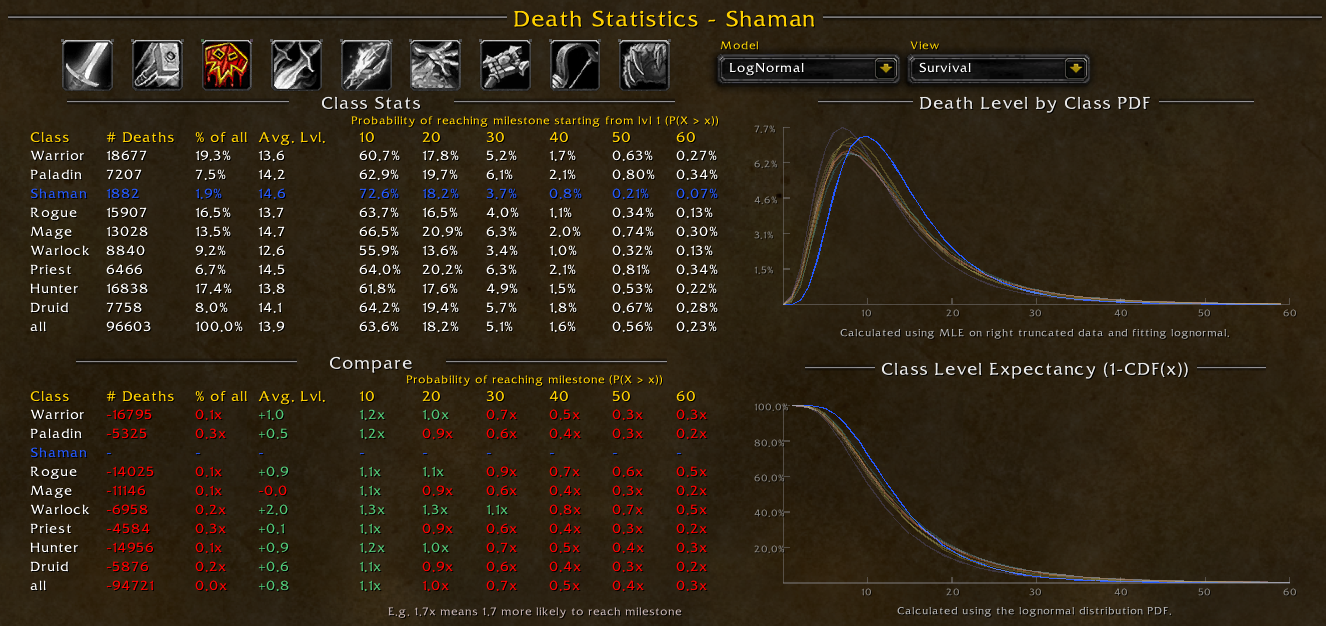
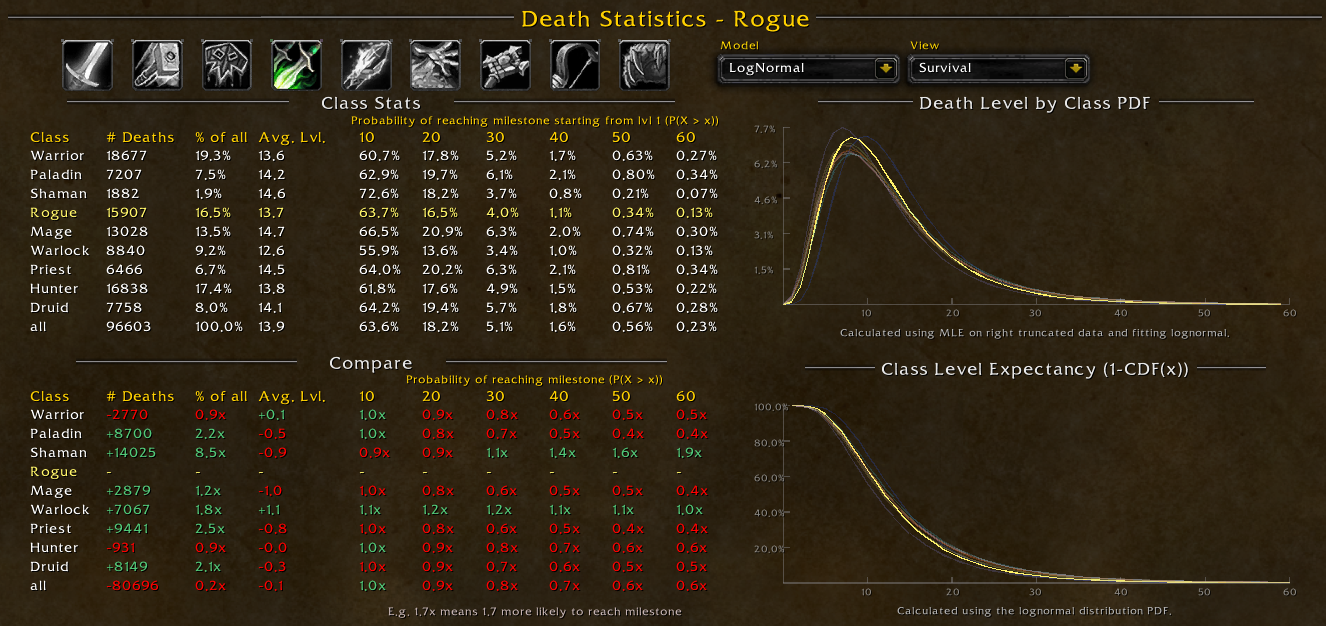
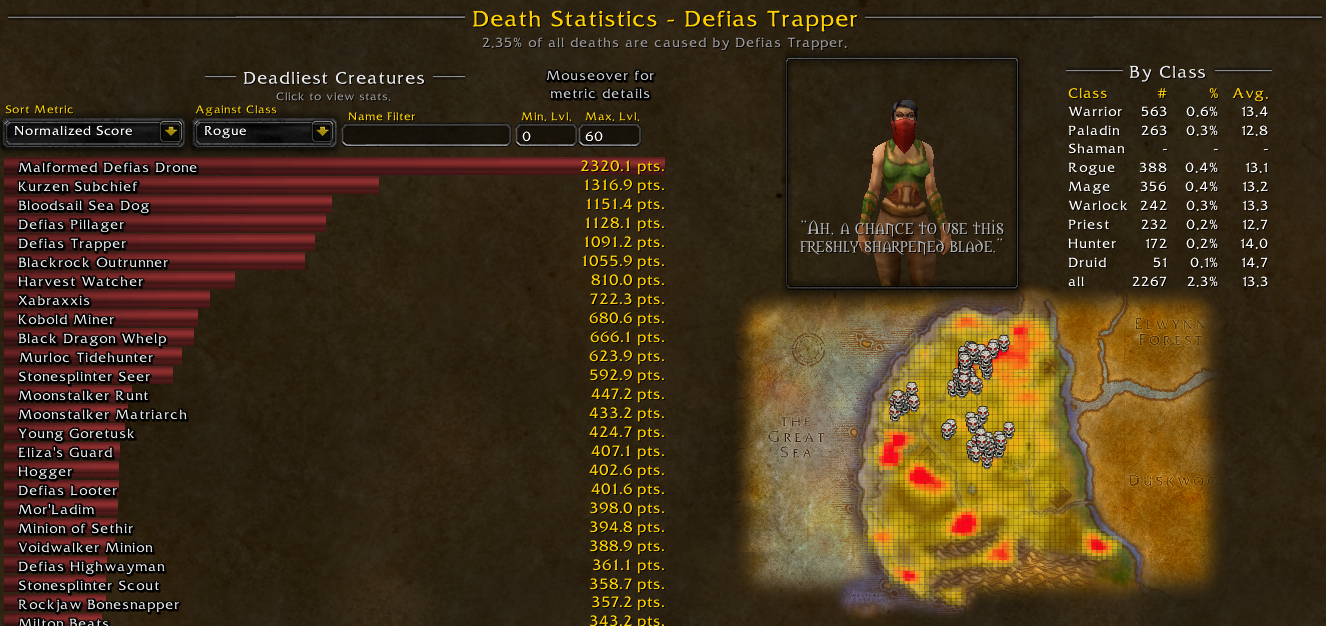
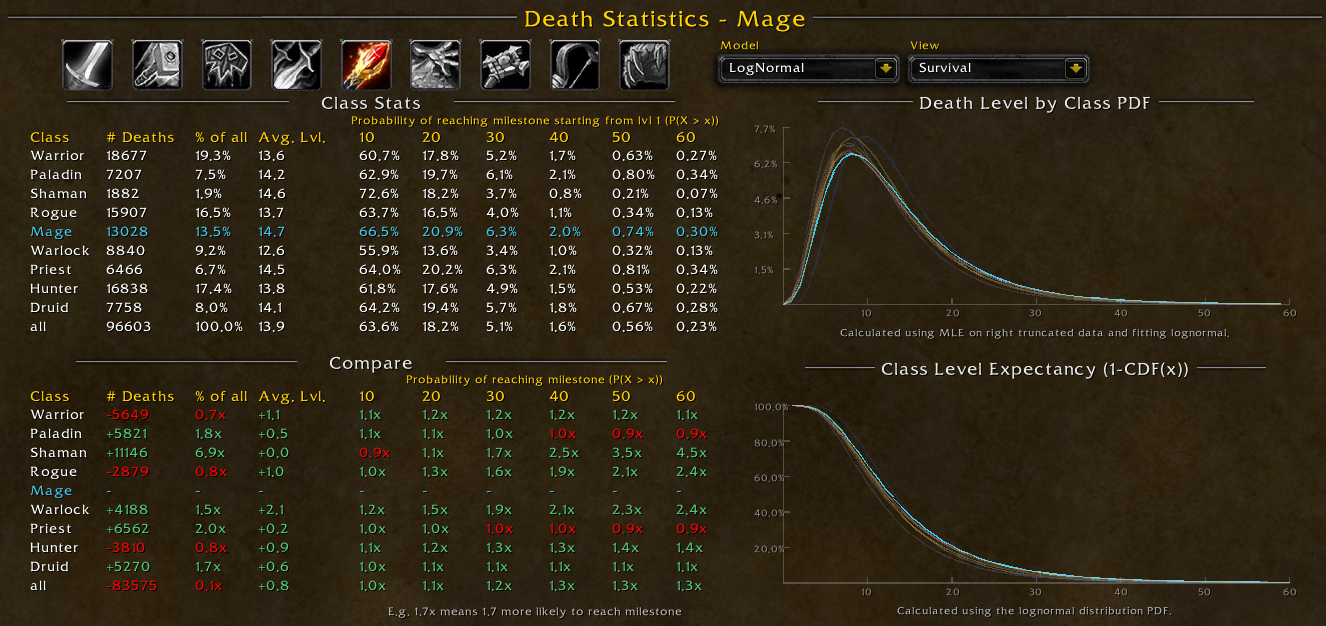
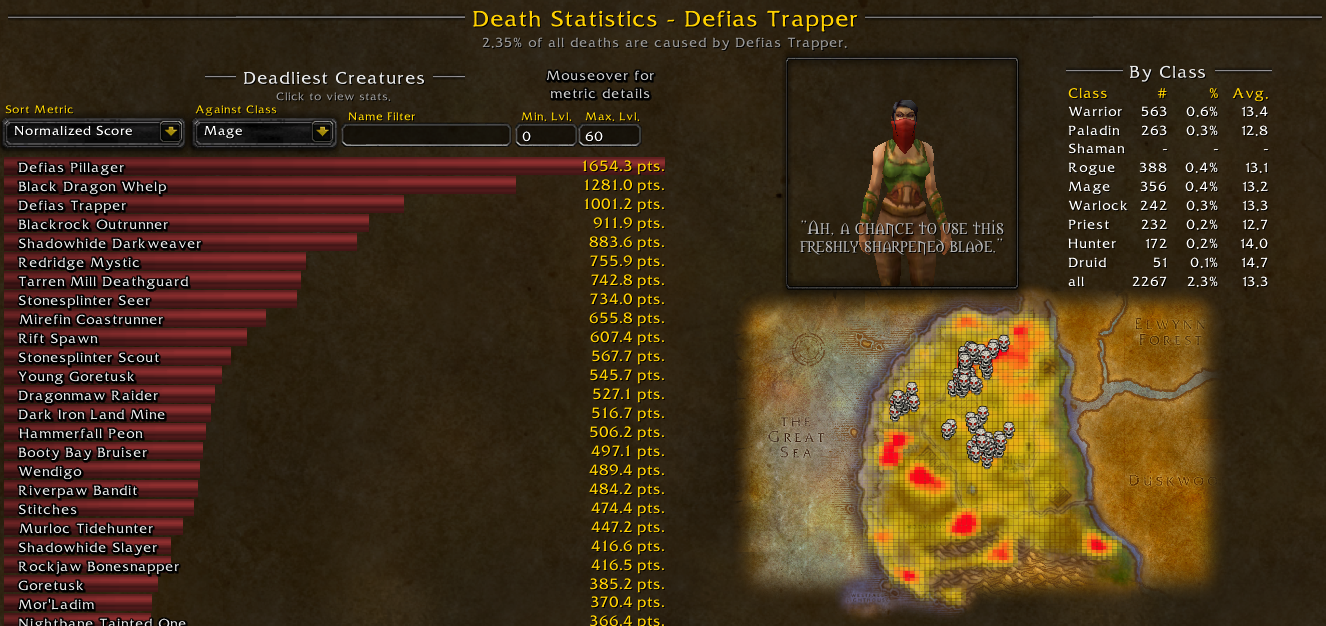
These statistics look at each class and compare them to one another. For every class image, the top left shows general statistics for the class, such as its expected survival rate given the shown milestones. Below that are comparisons to other classes. The top right shows the probability density function for deaths coming from that class, and below that is the survival function (the probability that a character makes it to or past a given level). Surpyval was used to help estimate the survival function and probability density functions. Also included are creature kill rankings against the given class, which can give context as to why a class might perform relative to others.
Nothing too surprising with warriors. Note their weakness to trappers vs pillages when comparing to a range class.
Paladins do quite well.
Shaman do considerably worse than other classes (other than Warlock). My opinion is that this has to do more with starting zones than with classes in particular.
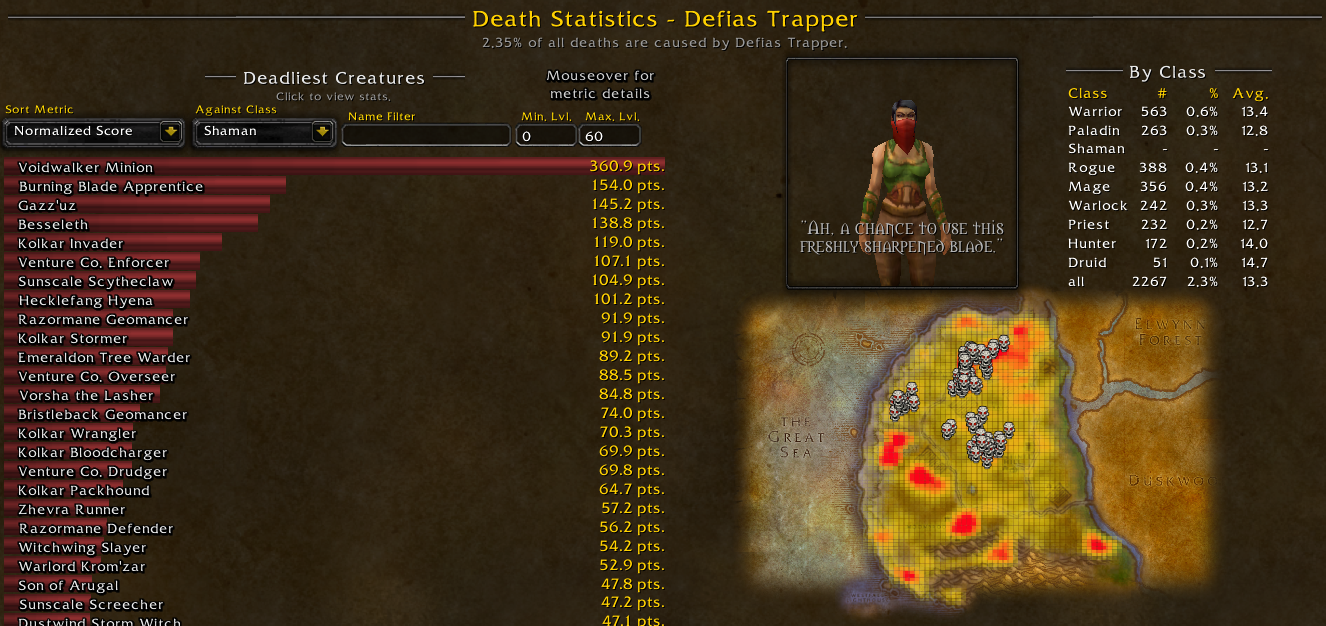
Note how dangerous the level 20 class mobs are for rogues
Interesting how fear immunity affects warlocks (Harvest Watcher + Fozruk).