Home
Article Type: Accelerator / Reference Application Audience: Solution Architects, Operations Engineers, Implementation Partners, Developers Module: Manufacturing Operations & IIoT Telemetry Applies to Versions: Fuuz 2026.2+ App Version: 0.0.2 | Spec Version: 2.0.0
The Machine Telemetry App is a comprehensive industrial operations accelerator built on the Fuuz platform. It provides end-to-end manufacturing visibility covering IIoT telemetry collection, OEE (Overall Equipment Effectiveness) calculation per ISO 22400, alarm management, production tracking, and workcenter state management.
The application ships with built-in data generators that simulate realistic manufacturing operations across a three-site enterprise — making it immediately usable for demos, proof-of-concept evaluations, and as a foundation for production deployments.
Vibe-Coded with Claude AI: This application was vibe-coded with Claude AI using examples of Fuuz flows, queries, and screens as context. Claude generated most of the application artifacts including data models, data flows, screen designs, and OEE calculation logic — demonstrating the speed at which production-ready Fuuz applications can be built with AI assistance.
Note: The original KB article includes two attachments (
MachineTelemetryApp_AsBuilt.md— the as-built specification, andMachineTelemetryApp008.fuuz— the installable application package). Download them from the original article; the files must be re-attached or linked in this repo.
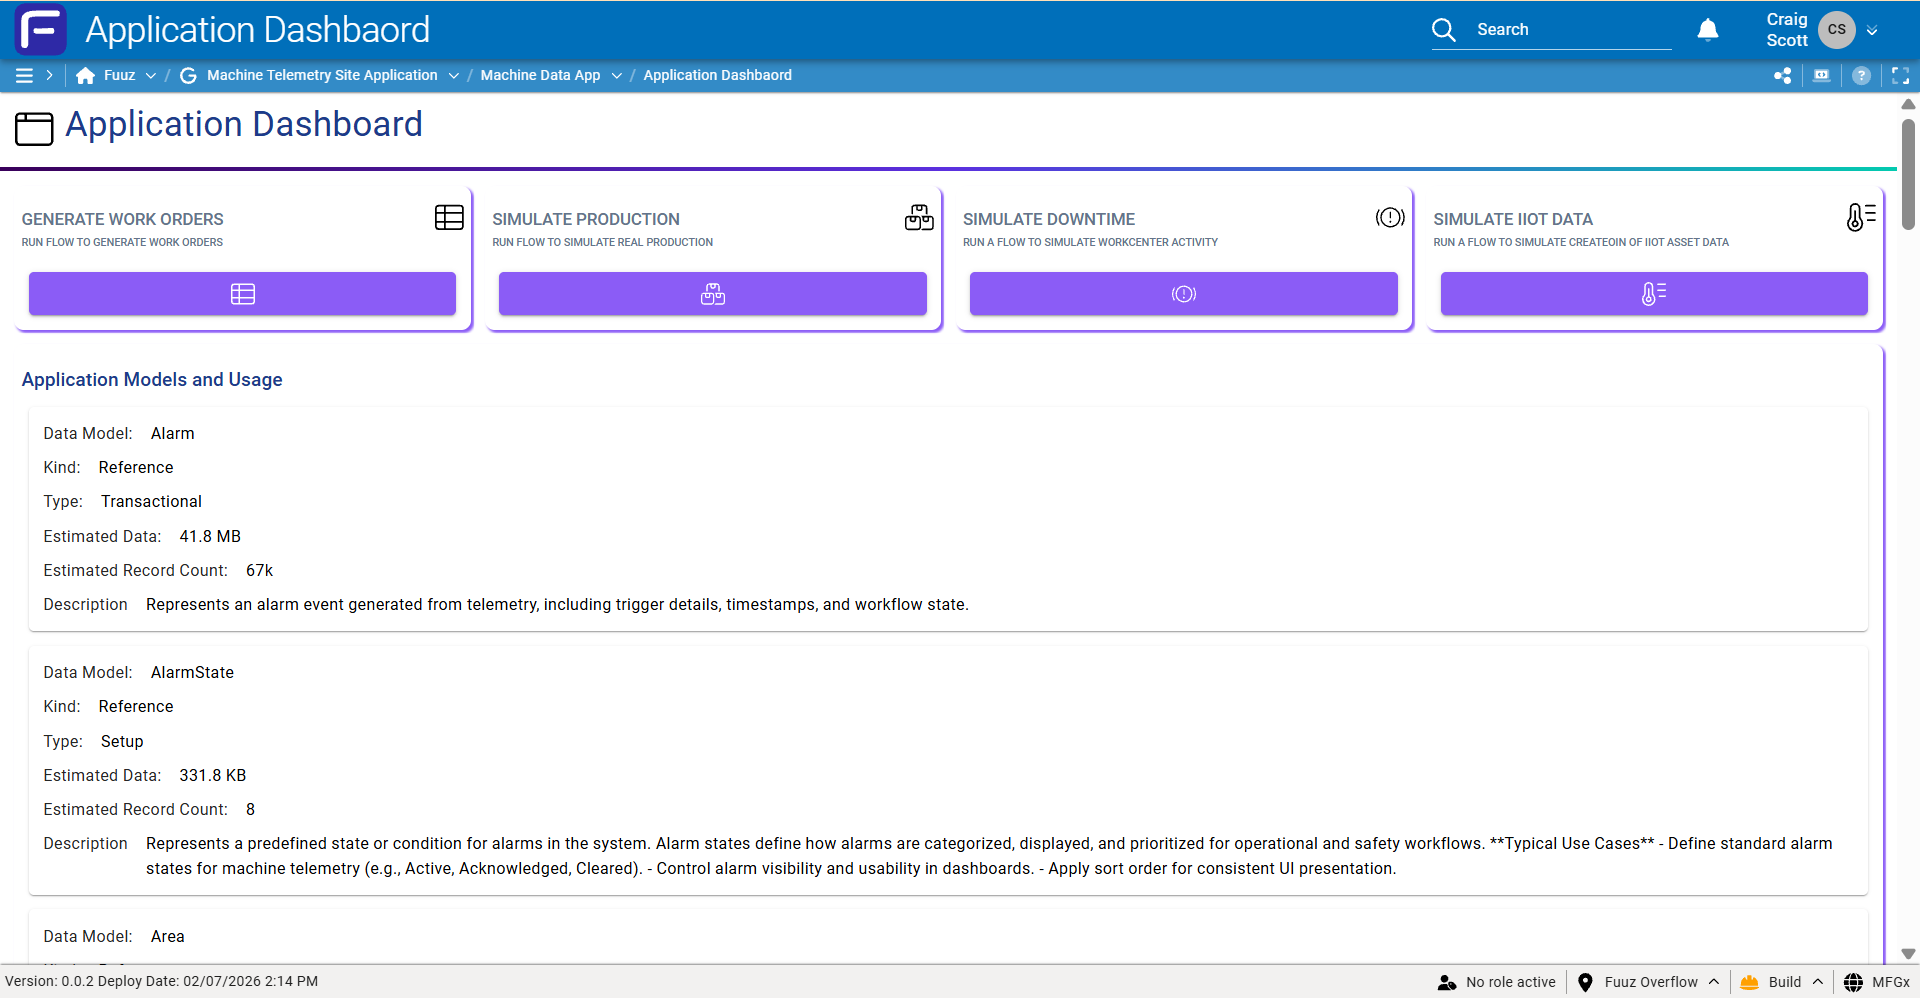
| Component | Count | Highlights |
|---|---|---|
| Data Models | 24 | Equipment hierarchy, telemetry (raw/hourly/daily), OEE (ISO 22400), production, alarms, events |
| Data Flows | 18 | Scheduled generators, event-driven OEE, alarm detection, dashboard web flows |
| Screens | 12 | 3 dashboards (OEE, Reliability, Alarms), 3 CRUD screens, 6 operational history views |
| Schedules | 9 | 5-minute telemetry, hourly aggregation, daily rollups, weekly work orders |
| Seed Data | 1,600+ | 3 sites, 9 areas, 18 lines, 36 cells, 500 assets, 996 data points, 36 workcenters, 21 products, 72 events |
| Component | ID |
|---|---|
| Module Group |
machineTelemetrySiteApplication — Machine Telemetry Site Application |
| Module |
machineDataApp — Machine Data App |
The application models a multi-site manufacturing enterprise following the ISA-95 physical hierarchy:
Enterprise (mfgx)
  └─ Site
      └─ Area
          └─ Line
              └─ Cell
                  └─ Asset
                      └─ DataPoint
| ID | Name | Industry Focus |
|---|---|---|
| DET | Detroit | Automotive parts manufacturing |
| HOU | Houston | Chemical compounds / process manufacturing |
| MKE | Milwaukee | Food & beverage manufacturing |
| Entity | Count | Details |
|---|---|---|
| Sites | 3 | Detroit, Houston, Milwaukee |
| Areas | 9 | Assembly, CIP, Machining, Mixing, Packaging, Reactor, Separation, Stamping, Utilities |
| Lines | 18 | Batch Mix, Reactor, Cartoning, CNC, Fill, Weld, Press, and more |
| Cells | 36 | Operational work cells across all lines |
| Assets | 500 | ASSET-0001 through ASSET-0500 |
| Data Points | 996+ | DP-00001 through DP-00996, plus 4 prototype points |
| Workcenters | 36 | 18 types × 2 instances each (C1 and C2) |
| Products | 21 | Automotive parts, chemical compounds, food & beverage products |
| Events | 72 | Downtime reasons across 12 categories |
The application includes 24 data models organized into six functional groups:
| Model | Purpose | Key Fields |
|---|---|---|
| Site | Physical location / campus |
code, name, city, country, timezone, industry, isActive, areas[]
|
| Area | Functional subdivision within a Site |
code, name, isActive, siteId → Site, lines[]
|
| Line | Production line / flow within an Area |
code, name, isActive, areaId → Area, cells[], assets[]
|
| Cell | Smallest operational work cell / station |
code, name, isActive, lineId → Line, assets[]
|
| Asset | Physical equipment with identity & maintenance attributes |
code, name, type, manufacturer, model, serialNumber, criticality, connectionString, installedAt, nextPmAt, cellId, lineId, workcenterId, dataPoints[]
|
| DataPoint | Telemetry / process variable on an Asset |
code, category, dataType, frequency, precision, deadband, setPoint, tolerance, lowerLimit, upperLimit, alarmEnabled, alarmPriority, historize, assetId, unitId
|
| Model | Tier | Purpose | Key Statistical Fields |
|---|---|---|---|
| TelemetryRaw | Raw | Numeric sensor readings from devices |
value, quality, qualityCode, recordedAt
|
| TelemetryRawBool | Raw | Boolean state readings (on/off, open/closed) |
valueBool, quality, recordedAt
|
| TelemetryRawString | Raw | String/text telemetry (status codes, messages) |
value (String), quality, recordedAt
|
| TelemetryHourly | Aggregated | Hourly statistical summaries per data point |
avg, min, max, sum, std, p05/p25/p50/p75/p95, first, last, countGood, countBad, pctTrue, modeValue
|
| TelemetryDaily | Aggregated | Daily statistical summaries per data point | (same statistical structure as TelemetryHourly) |
| Model | Purpose | Key Fields |
|---|---|---|
| Workcenter | Production execution point for work orders |
code, name, isActive, scheduleGroupId, cellId, lineId, currentWorkOrderId, currentWorkcenterHistoryId
|
| Mode (8 values) | Drives availability calculation per ISO 22400 | PROD, SETUP, MAINT, DOWN, IDLE, CLEAN, ENG, NOSCHED |
| State (14 values) | Operational state categorization | RUN, SLOW, STOP, FLT, ESTOP, HELD, BLKD, STRV, CHGV, CLN, MAINT, WARM, OFF, UNK |
| WorkcenterHistory | Time-series state change records for OEE & downtime |
occurAt, endAt, duration, modeId, stateId, workcenterId, eventId, scheduleId
|
| OeeHourly | Hourly OEE bucket with full ISO 22400 metrics |
availability, performance, quality, oee, totalUnits, goodUnits, scrapUnits, plannedMinutes, runMinutes, downtimeMinutes, idealCycleTime, shift
|
| OeeDaily | Daily aggregated OEE metrics per workcenter |
availability, performance, quality, oee, hoursRecorded, hoursWithProduction, scheduledTime
|
| Code | Name | Downtime? | Production Time? | OEE Impact |
|---|---|---|---|---|
| PROD | Production | No | Yes | Production |
| SETUP | Setup | Yes | No | Setup |
| MAINT / DOWN / IDLE | Maintenance / Disabled / Idle | Yes | No | Unplanned |
| CLEAN / ENG | Cleaning / Engineering | Yes | No | Planned |
| NOSCHED | No Schedule | No | No | Excluded |
The remaining models cover production execution (Product, WorkOrder, ProductionLog), alarm management (Alarm with 8 AlarmStates: ACTIVE, ACKNOWLEDGED, ACTIVE_ACK, CLEARED_ACK, CLEARED_UNACK, OUT_OF_SERVICE, SHELVED, SUPPRESSED), and downtime categorization (EventCategory with 12 categories, Event with 72 specific downtime reasons).
| Code | Name | Affects OEE | Planned |
|---|---|---|---|
chgv |
Changeover | Yes | Yes |
elec / mech
|
Electrical / Mechanical Failure | Yes | No |
matl / proc / qual
|
Material / Process / Quality Issues | Yes | No |
oper / pmnt
|
Operator / Planned Maintenance | Yes | Yes |
umnt / extl / util
|
Unplanned Maint / External / Utilities | Yes | No |
schd |
No Schedule | No | Yes |
Data flows are the server-side automation engine. They run as scheduled jobs, event-driven reactors, and API-invoked sub-flows. The 18 flows are organized into seven functional pipelines:
| Flow | Trigger | Nodes | Purpose |
|---|---|---|---|
Telemetry Generator Scheduler (telemetryGeneratorScheduler) |
Schedule (5-min) | 20 | Main IIoT data generator. Splits data points by type (numeric/boolean/string), batches by frequency, generates realistic values, writes to TelemetryRaw models. |
Generate Boolean Raw Data (generateBooleanRawData) |
API (sub-flow) | 4 | Sub-flow for boolean data point batch processing. |
Telemetry Hourly Aggregation (telemetryRawDataAggregationHourly) |
Schedule (hourly) | 9 | Aggregates raw telemetry into hourly statistical summaries (avg, min, max, percentiles, quality counts). |
Daily Telemetry Aggregation (dailyAggregationFlow) |
Schedule (daily) | 9 | Rolls up hourly summaries into daily aggregations. |
| Flow | Trigger | Purpose |
|---|---|---|
Generate OeeHourly Stubs (generatePayloadForOeeScheduleTomorrowParentFlowScheduled) |
Schedule (nightly) | Pre-creates next-day OeeHourly records with schedule information. |
Workcenter Planned Availability (workcenterPlannedAvailability) |
Schedule | Calculates and broadcasts planned availability windows for all active workcenters. |
Calculate OEE Hourly (calculateOeeHourly) |
Schedule (hourly) | Full recalculation catch-up of OEE hourly metrics from production logs and workcenter history. ISO 22400 compliant. |
Production Log → OEE Events (proudctionLogCreateOeeEvents) |
DataChange: Create on ProductionLog | Event-driven. Calculates OEE impact when a new production log entry is created. Uses mutex lock for concurrency. |
WC History → OEE Updates (workcenerHistoryToOeeHourlyUpdatesOnEndAt) |
DataChange: Update on WorkcenterHistory | Event-driven. Recalculates availability for all affected OEE hourly buckets when a history record closes. Uses mutex lock. |
| Pipeline | Flows | Description |
|---|---|---|
| Production Simulation |
productionSimulatorDaily, weeklyWorkOrderGenerator
|
Daily production log generation with work order quantity updates. Weekly auto-generation of work orders for all active workcenters. |
| Workcenter State Management |
workcenterHistoryScheduler (21 nodes) |
ISO 22400-compliant state change generator with realistic transitions and proper mode assignments. Uses mutex lock. |
| Alarm Processing | createAlarmOnTelemetryRawAnomolyDataChange |
Event-driven (DataChange: Create on TelemetryRaw). Evaluates anomalies and creates alarm records when values exceed configured limits. |
| OEE Daily Aggregation | oeeDailyAggregationFlow |
Daily scheduled. Aggregates hourly OEE data into daily summaries per workcenter. |
| Utility Flows |
duplicateAssetWithOptionsFromScreen, updateDataPointFrequencies
|
Screen-invoked asset duplication with form dialogs. Batch data point frequency updates. |
| Dashboard Web Flows |
oeeRealTimeCalculationsWebFlow, reliabilityDashboardWebFlow
|
Browser-invoked API flows serving real-time OEE and reliability metrics to dashboard screens. |
| Screen | ID | Components | Category | Description |
|---|---|---|---|---|
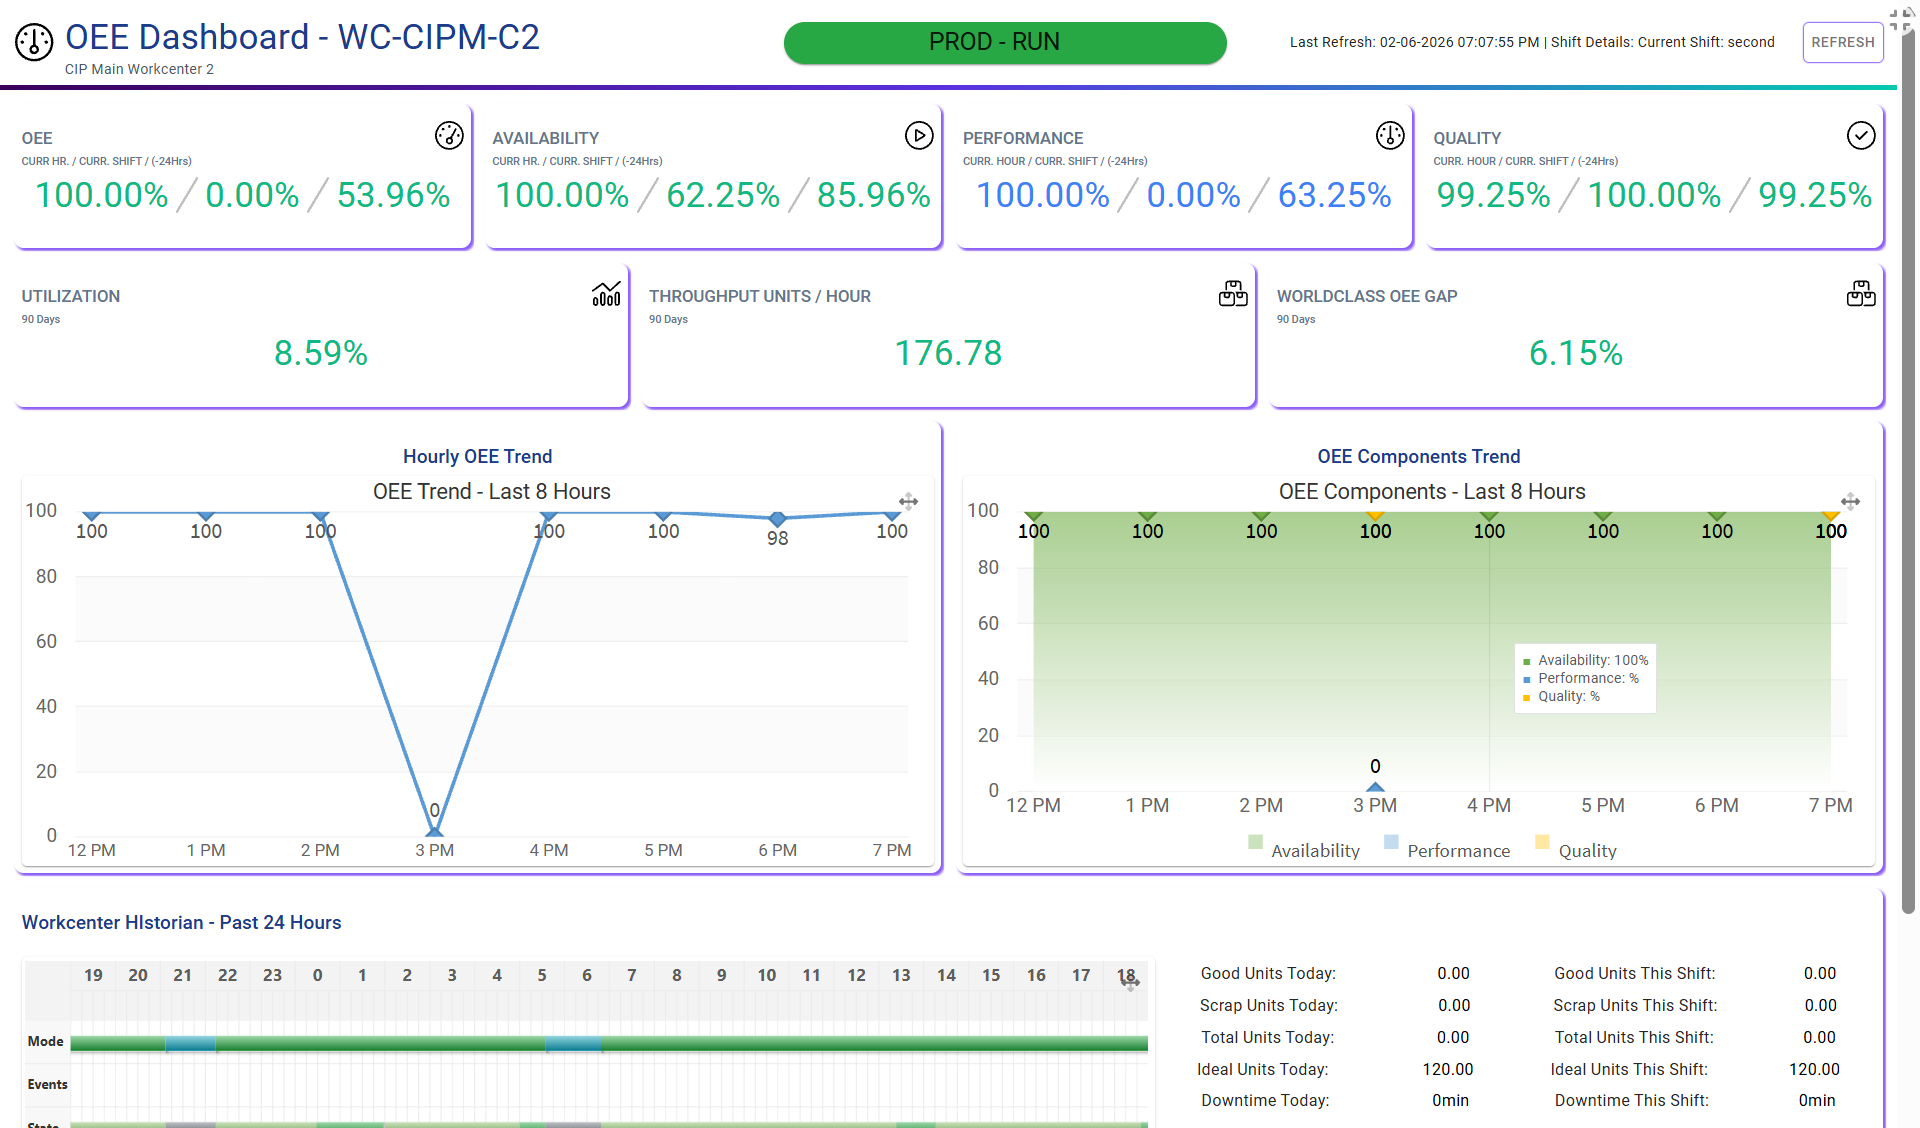
| Workcenter OEE Dashboard | workcenterOeeDashboard |
158 | Dashboard | Real-time OEE with Availability, Performance, and Quality pillar cards. Canvas layout with charts powered by OEE Web Flow. |
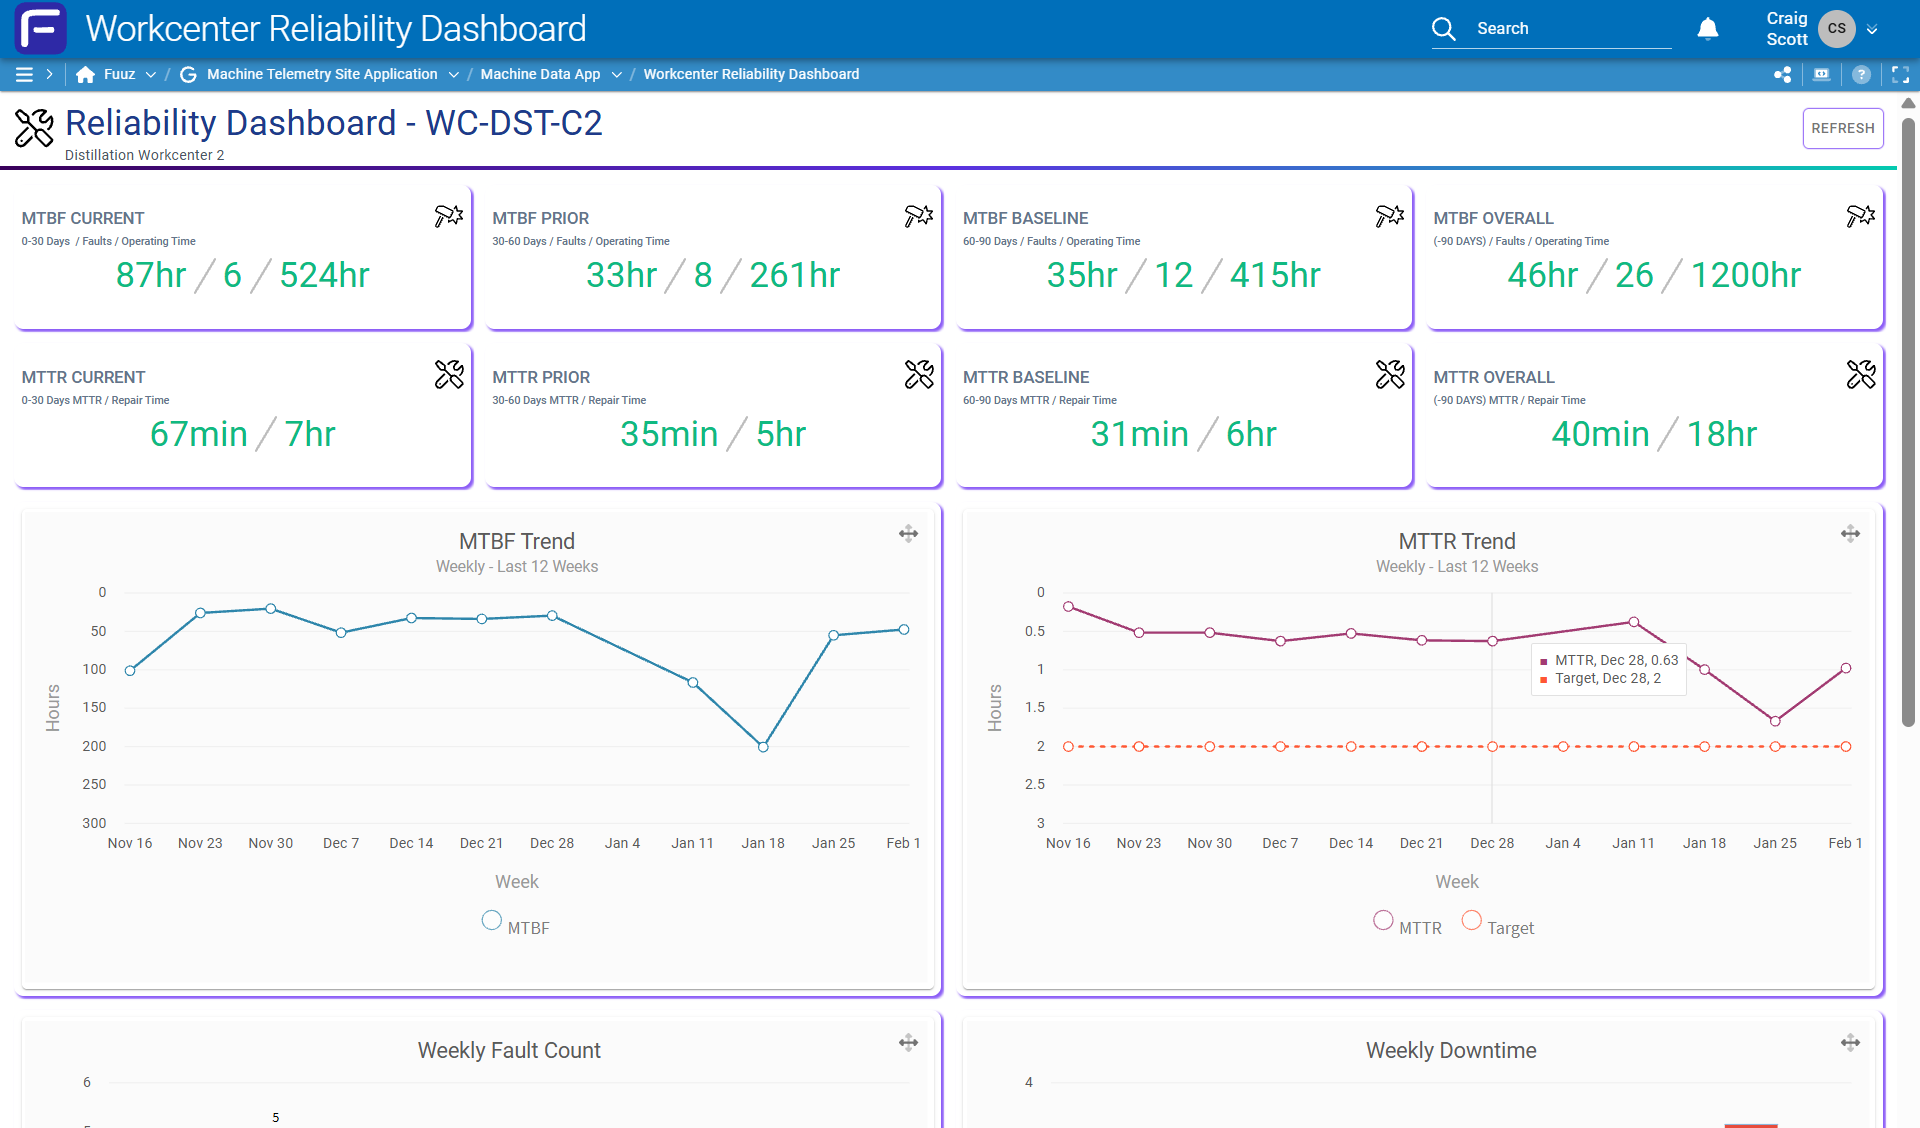
| Workcenter Reliability Dashboard | workcenterReliabilityDashboard |
149 | Dashboard | Equipment reliability metrics powered by the Reliability Dashboard Web Flow. |
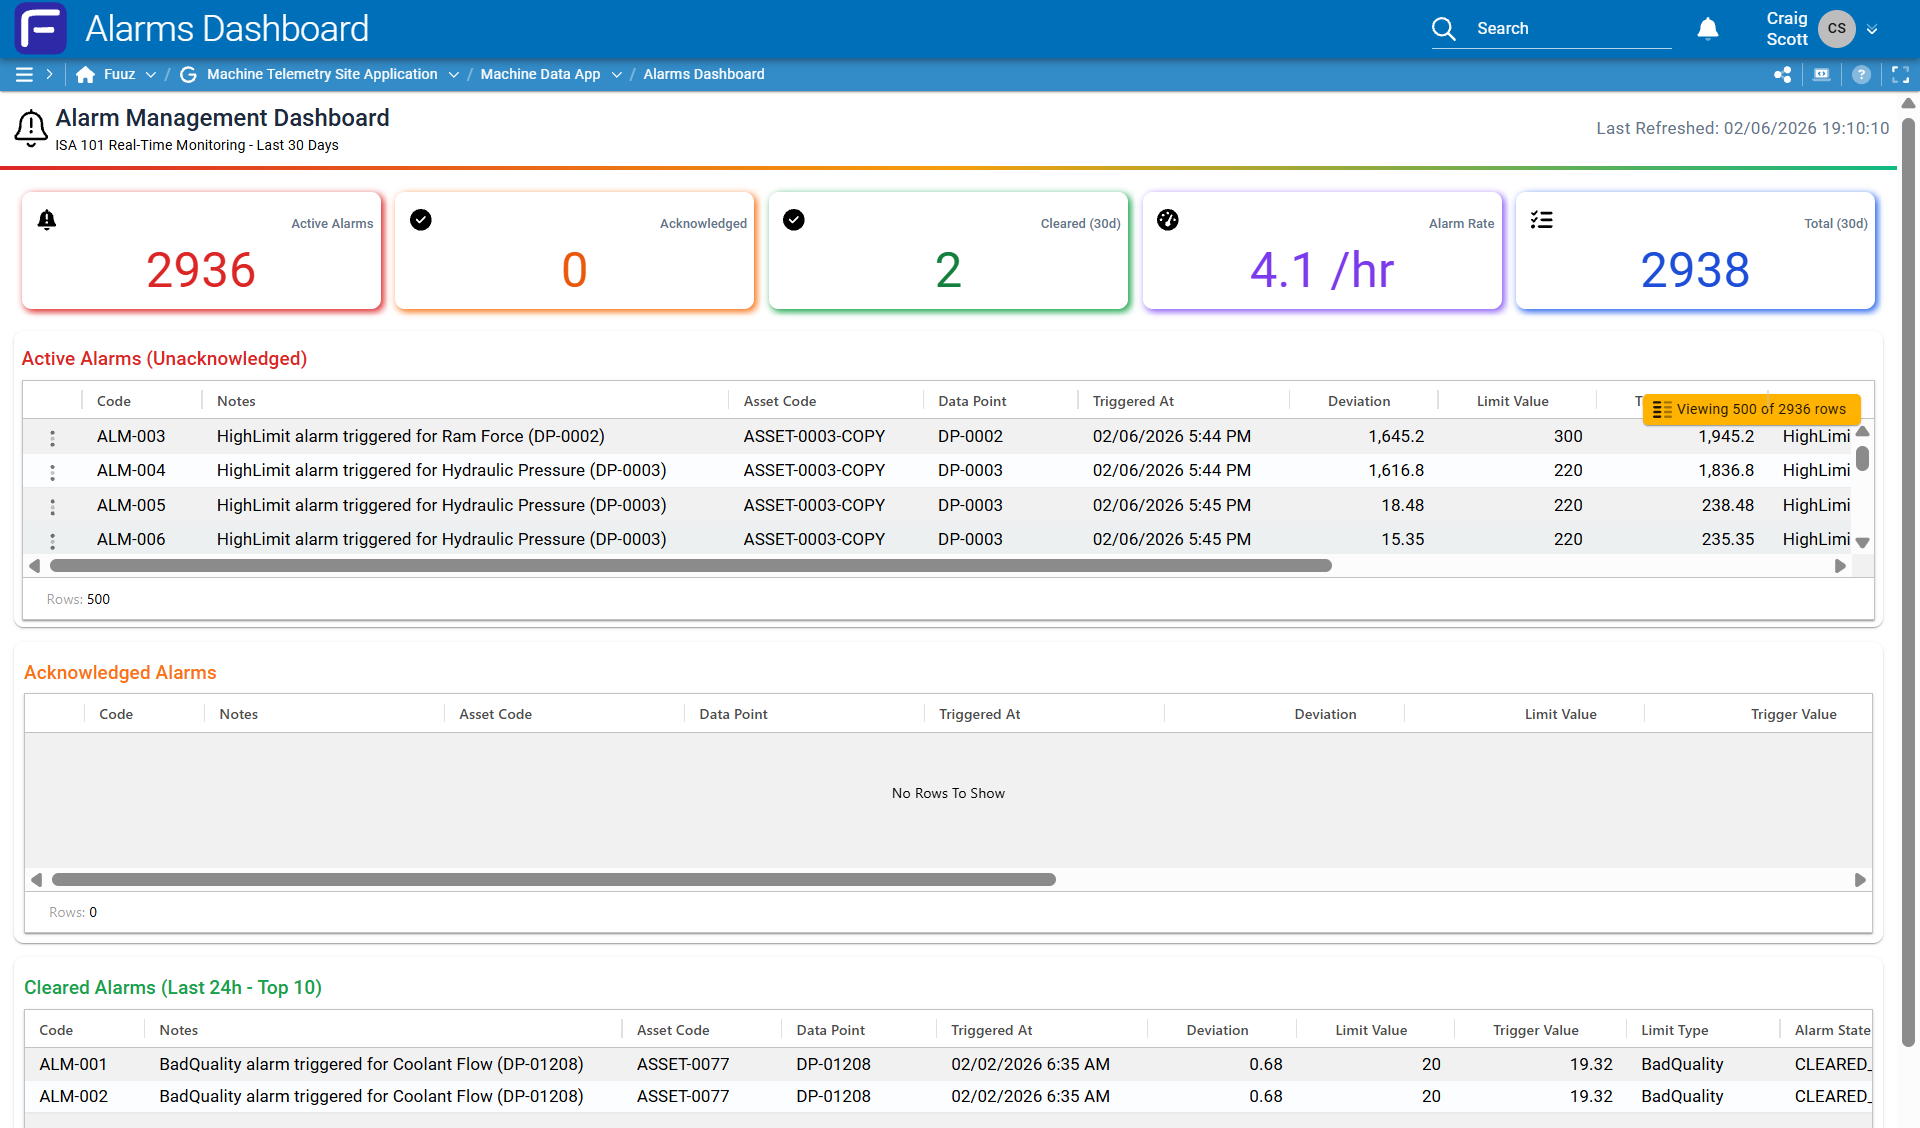
| Alarms Dashboard | alarmsDashboard |
116 | Dashboard | Alarm management with active/acknowledged/cleared filtering and visual status indicators. |
| Assets | assets |
67 | Data Management | Asset CRUD with data point management. "Duplicate Asset" action button. Filter by site/area/line. |
| Products | products |
38 | Data Management | Product master data with workcenter assignment. |
| Workcenter | workcenter |
36 | Data Management | Workcenter configuration within the manufacturing hierarchy. |
| Workcenter History / Production Log / OEE Hourly / OEE Daily / Telemetry Hourly / Telemetry Daily | — | 38–50 each | Operational History | Six tabular history screens with date-range and workcenter/data-point filtering. |
IIoT Devices / Simulators
    │
    ▼ (5-min schedule)
TelemetryRaw / RawBool / RawString  →  Alarm Detection (DataChange trigger) → Alarm
    │
    ▼ (hourly aggregation)
TelemetryHourly
    │
    ▼ (daily aggregation)
TelemetryDaily
WorkcenterHistory Scheduler (hourly)        Production Simulator (daily)
    │                                                  │
    ▼                                                  ▼
WorkcenterHistory (DataChange)              ProductionLog (DataChange)
    │                                                  │
    └───────────────── OeeHourly ──────────────────────┘
                           │
                           ▼ (daily aggregation)
                       OeeDaily
Important: Mutex Locks — Three critical flows use mutex locks to prevent race conditions when multiple triggers update the same OeeHourly records simultaneously: Production Log → OEE Events, WC History → OEE Updates, and WorkcenterHistoryScheduler.
Dashboard screens invoke server-side Web Flows via API Request to perform real-time calculations too complex for client-side GraphQL queries. The pattern follows: Browser → API Call → Web Flow (Request → Query → JavaScript → JSONata → Response) → JSON Payload → Browser renders widgets.
| Schedule | Frequency | Description |
|---|---|---|
| Raw Telemetry Data Generation | 5-minute | Real-time IIoT raw data simulation |
| Aggregate Raw Telemetry Hourly | Hourly | Prior hour raw → hourly rollup |
| Workcenter History Generation | Hourly | State change simulation |
| OEE Hourly Catch-up | Hourly | Full recalculation of previous hour |
| Generate OeeHourly Stubs | Nightly | Pre-create next day OEE buckets |
| Production Data Creation | Daily | Production log & work order updates |
| Aggregate Telemetry Hourly to Daily | Daily | Prior day hourly → daily rollup |
| OEE Daily Aggregation | Daily | Aggregate OEE hourly → daily |
| Weekly Work Order Creation | Weekly (Sunday) | Auto-generate weekly work orders |
Shift Schedule: Basic schedule group with three shifts (First, Second, Third) and corresponding daily schedule events.
| Protocol Family | Drivers |
|---|---|
| PLC | Ethernet/IP PLC, PCCC PLC |
| OPC | OPCUA Client |
| MQTT | MQTT Broker, MQTT Client, MQTT Sparkplug B |
| Modbus | Modbus TCP |
| HTTP | HTTP Client, HTTP Server |
| SQL | Microsoft SQL, MySQL, IBM DB2, Oracle DB |
| File / Print | Local File, Native Printer, TCP Printer |
| Network | TCP Server, TCP Socket, SAP RFC |
Time (s, min, h, d, wk, mo, yr), Weight (g, kg, lb, oz, st, t lb, t oz), Length (mm, in, ft), Amount (ea, pc), Currency (USD), Temperature (°C, °F), Electrical (A, kW), Frequency (Hz, RPM), Pressure (bar), Force (kN), Flow Rate (GPM, L/min), and Ratio (%).
| Decision | Rationale |
|---|---|
| ISO 22400 compliance for all OEE calculations | Modes drive availability; States provide operational categorization. Industry-standard metrics recognized globally. |
| Three-tier telemetry aggregation (Raw → Hourly → Daily) | Scalable time-series analytics. Raw data for real-time; aggregates for dashboards and reporting. |
| Event-driven OEE updates via DataChange triggers | Near-real-time OEE on ProductionLog creates and WorkcenterHistory updates, supplemented by scheduled catch-up for consistency. |
| Mutex-based concurrency control | Ensures OeeHourly record integrity when multiple concurrent triggers update the same buckets. |
| Web Flow pattern for dashboard calculations | Keeps complex business logic server-side. Browsers call API endpoints; receive pre-calculated JSON payloads for rendering. |
- Fuuz Platform: fuuz.com
- Fuuz Support Portal: support.fuuz.com
- Companion Articles: Cloud Connectors Complete Reference Guide, Edge Connections Complete Industrial Integration Reference, EDI Specifications Complete Reference
- Standards Reference: ISO 22400 (Manufacturing Operations Management — Key Performance Indicators), ISA-95 (Enterprise-Control System Integration)
| Version | Date | Changes |
|---|---|---|
| 1.0 | 2026-02-10 | Initial publication — Machine Telemetry App v0.0.2 accelerator reference covering 24 data models, 18 data flows, 12 screens, ISA-95 hierarchy, ISO 22400 OEE, three-tier telemetry pipeline, alarm management, and production simulation. |
- Machine Monitoring V105
- FAQ Preparing for IIOT Machine Integrations
- Edge Gateway Application
- How to connect OPC UA simulator to the Edge Gateway
- How IIoT fits into the Industrial Data Stack
- IIOT Data Flow Nodes
Source: support.fuuz.com
This article was moved from the Fuuz Platform Help wiki to live alongside its package.