Repository navigation
Perf Investigation Throughput
Working log of a performance investigation into Felix's end-to-end pub/sub throughput, particularly at larger payload sizes. Records what was measured, what was concluded, and — importantly — which hypotheses turned out to be wrong.
Status: resolved for macOS; Linux benchmarked in round 18, one open defect. Main ceiling fixed (rounds 7–10); residual bimodality was a path-MTU black-hole collapse (round 15); the Linux CI failure was publish-side shedding in an under-configured test (round 16). Round 17 then established that the ceiling itself is macOS-specific — Linux is faster at the pre-fix baseline than macOS is after every fix — and that the I/O runtime pool must stay off there. Round 18 finally benchmarked Linux on real hardware: the pool verdict holds, Linux reaches 1.17 GB/s (2.3x macOS), and the round-15 loopback MTU guarantee is a hard delivery stall there whenever the documented sysctl tuning is applied — unfixed as of that round. The ceiling was scheduling, not any Felix stage: quinn's driver tasks do a bounded slice of work per poll and reschedule themselves, so sustained throughput is that slice divided by scheduler re-poll latency — and on a runtime shared with ~50 app tasks that latency, times one wakeup chain per datagram, was the whole pipeline's clock. Fixes (all in Felix, official quinn only): dedicated single-threaded I/O runtimes for quinn drivers, colocation of the two transport-facing pump tasks with those drivers, and QUIC ACK-frequency tuning. Result on the same box and benchmark:
| Before | After | |
|---|---|---|
| 4 KiB × batch 64, fanout 1 (sustained) | 73 MB/s | p50 548 MB/s (max 557) |
| 1 KiB, fanout 1 | 74.9 MB/s | ~480 MB/s |
| 16 KiB, fanout 1 | ~72 MB/s | ~507 MB/s |
| latency profile (1 KiB, batch 1, acked) | — | p50 129 µs / p999 256 µs |
Both defects are fixed. The residual bimodality (~30% of runs 5–6× slower, rounds 12–14) turned out to be quinn's MTU black-hole detector misreading a congestive loss burst and collapsing the path MTU to 1200 for the rest of the run — see round 15 for the diagnosis and fix.
Map of this document: rounds 1–6 are the elimination history that pointed at the mechanism; 7–10 are the diagnosis and fix of the main ceiling; 11–14 cover the measurement-tooling defects found while publishing results, the endpoint placement fix, and the characterization of the residual; 15 is the diagnosis and fix of the residual.
- Apple Mac Studio, Apple M4 Max, 16 CPUs
- macOS 26.6.1 (Darwin 25.6.0), APFS, loopback (
lo0, MTU 16384) - Release build,
latency-demo --binary,--all-features - Repo at
main(a36c52c) plus the--log-capacitychange below - Relevant sysctls:
kern.ipc.maxsockbuf=8388608,net.inet.udp.recvspace=786896,net.inet.udp.maxdgram=9216
Broker and client both run in the same process in this harness, sharing one tokio runtime — worth remembering when reading CPU numbers.
- The benchmark harness overstates throughput. For most configurations the entire measured run fits inside the 64 MiB QUIC connection send window, so the reported number is buffer-absorption speed, not sustained throughput.
- There is no "large payload cliff." Once every run exceeds the send window, 1 KiB and 4 KiB converge on the same ~73 MB/s payload rate. Larger payloads simply hit the window sooner, which looked size-dependent.
- Felix is meaningfully slower than raw quinn on the same box, but the gap is ~3.5× on wire bytes at comparable core counts — not the 8× a naive payload-vs-payload comparison suggests. See "Corrections" below.
- Both Felix and raw quinn are ~90% system time on macOS loopback. (An early suspicion that Felix sends smaller datagrams was later disproven — see round 2; Felix runs at MTU 16354 with ~15,650 B/datagram.)
- The ceiling is exactly per-byte — 70–73 MB/s across a 16× payload range — and every structural explanation tested has been eliminated. See round 6.
felix-transport defaults send_window to 64 MiB
(crates/felix-transport/src/lib.rs:52). Any run whose total payload volume is
below that is absorbed by buffers before backpressure appears, and
latency-demo stops its clock when the last event arrives.
Throughput at 4 KiB, fanout 1, batch 64, varying run length (3 reps each):
--total |
Run bytes | Reps (msg/s) |
|---|---|---|
| 8,000 | 31 MB (fits) | 70,085 / 75,993 / 79,078 |
| 20,000 | 78 MB (exceeds) | 29,679 / 28,173 / 30,090 |
| 40,000 | 156 MB (exceeds) | 19,979 / 22,112 / 20,559 |
Variance within a run length is ~±5%; across run lengths throughput falls monotonically. The marginal rate between successive windows keeps dropping (20,800 → 16,370 msg/s), so this is not a fixed startup transient — the short runs are simply measuring buffer fill.
Consequence: the numbers in
docs-site/src/content/docs/features/benchmarks.md are affected. The macOS
1 KiB × fanout 1 row (244–263 K msg/s) is a buffer-absorption measurement. That
page's methodology section promises "sustainable rates, not burst rates measured
while shedding" — it is correct about shedding (drops really are 0), but the
buffering artifact defeats the intent regardless.
Original payload sweep (fanout 1, batch 64, total 20,000 — all under the window except the last two rows):
| Payload | msg/s | MB/s |
|---|---|---|
| 1024 B | 332,042 | 340.0 |
| 1500 B | 276,571 | 414.9 |
| 2048 B | 181,321 | 371.3 |
| 2560 B | 82,898 | 212.2 |
| 3072 B | 57,273 | 175.9 |
| 4096 B | 32,822 | 134.4 |
| 8192 B | 16,469 | 134.9 |
Re-run with every configuration sized to exceed 64 MiB:
| Payload | Total | Run bytes | msg/s | MB/s |
|---|---|---|---|---|
| 256 B | 400,000 | 98 MB | 975,550 | 249.7 |
| 1 KiB | 200,000 | 195 MB | 73,126 | 74.9 |
| 4 KiB | 60,000 | 234 MB | 17,692 | 72.5 |
1 KiB collapses from 358 MB/s to 74.9 MB/s (4.8×) and lands on top of 4 KiB. The 256 B run was only 1.5× the window, so 249.7 MB/s is likely still partly inflated.
Supporting evidence that the effect tracks bytes, not frame size (total 40,000):
| Config | Frame size | msg/s |
|---|---|---|
| 4 KiB × batch 4 | 16 KiB | 53,586 |
| 4 KiB × batch 16 | 64 KiB | 20,128 |
| 4 KiB × batch 64 | 256 KiB | 20,419 |
| 1 KiB × batch 256 | 256 KiB | 367,415 |
Identical 256 KiB frames give 20 K or 367 K msg/s depending only on payload size, i.e. on total run bytes relative to the window.
Standalone probe replicating Felix's transport settings exactly — same windows,
same MTU config, same 8 MiB SO_SNDBUF/SO_RCVBUF halve-until-accepted loop —
moving bytes over loopback with no broker, no wire protocol, no fanout.
One uni stream, 256 KiB writes, 32 MB per run.
| MTU upper bound | MTU reached | MB/s | Lost | Cong. events | Black holes |
|---|---|---|---|---|---|
| 1452 | 1452 | 144.4 | 0 | 0 | 0 |
| 2048 | 1942 | 187.2 | 0 | 0 | 0 |
| 4096 | 3915 | 415.7 | 0 | 0 | 0 |
| 8192 | 7973 | 819.0 | 0 | 0 | 0 |
| 9216 | 8715 | 748.6 | 0 | 0 | 0 |
| 16384 (Felix default) | 16324 | 628.7 | 0 | 0 | 0 |
Second run under /usr/bin/time reproduced the shape (1452→149.9, 2048→186.4,
4096→381.3, 8192→725.9, 9216→742.9, 16384→506.8 MB/s).
Two things fall out:
-
Socket buffers are load-bearing. An earlier version of the probe without
the 8 MiB buffers failed outright at upper bounds ≥9216 (connection timed
out), and at 1452 reported
lost=75, cong_events=46, black_holes=2with MTU stuck at 1200. Felix sets these buffers correctly; this is a latent trap for anything that does not. - 16384 is not the best upper bound even for raw quinn. 8192 is ~30% faster (819 vs 629 MB/s). Larger datagrams stop paying once per-datagram cost is amortised.
Felix's own MTU sweep (4 KiB, total 60,000) is nearly flat by comparison, which is itself the signal that Felix never gets close to the transport ceiling:
| Setting | msg/s | MB/s | Datagrams | Avg B/datagram |
|---|---|---|---|---|
| baseline (upper 16384, init 1200) | 18,484 | 75.7 | 267,790 | 1,835 |
| upper 9216 | 16,376 | 67.1 | 294,742 | 1,668 |
| init 8192, upper 9216 | 16,687 | 68.3 | 291,198 | 1,688 |
| upper 1452 | 8,858 | 36.3 | 558,153 | 881 |
| upper 16384 (repeat) | 17,997 | 73.7 | 267,402 | 1,838 |
Note the average-bytes-per-datagram column is diluted by ACKs in both directions and by loopback double-counting; treat it as indicative, not exact.
/usr/bin/time -l, 80,000 × 4 KiB, fanout 1, batch 64:
| Felix | Raw probe (6 runs) | |
|---|---|---|
| real | 5.02 s | 1.03 s |
| user | 1.63 s | 0.27 s |
| sys | 15.60 s | 2.64 s |
| sys:user ratio | 9.6:1 | 9.8:1 |
| Cores busy (CPU/wall) | 3.4 of 16 | 2.8 |
| Voluntary ctx switches | 7,374 | 0 |
| Involuntary ctx switches | 361,126 | 54,279 |
| Max RSS | 554 MB | — |
Both are overwhelmingly kernel time — macOS UDP loopback is syscall-dominated,
consistent with what benchmarks.md already reports. Critically, Felix leaves
12+ of 16 cores idle while running well below the transport ceiling, so this
is not a CPU-saturation problem.
sample-based symbol occurrence counts over 8 s under load (occurrence counts
of frames in the call tree, not sample-weighted — indicative only):
__sendmsg 63   __psynch_mutexwait 41   __psynch_cvsignal 32   malloc 29
kevent 26      platform_memmove 24     __recvmsg 23           __psynch_cvwait 21
free 10        __psynch_mutexdrop 8
ring aes_gcm seal 19   rustls encrypt_in_place 15   aes_gcm_enc_kernel 14
The pthread mutex/condvar family taken together is the largest userspace
category, which lines up with the note already in benchmarks.md that the next
target is "user-space scheduling and synchronization."
Recorded deliberately, because several are plausible enough to be re-proposed.
-
The redundant payload copy is not the bottleneck.
decode_publish_batchdoesbytes.to_vec()per payload (crates/felix-wire/src/binary.rs:250) and every caller immediately converts back withBytes::from(vec)(handlers/publish/uni.rs:82,control.rs:108) — a genuineBytes→Vec→Bytesround trip caused only byPublishBatch.payloadsbeingVec<Vec<u8>>. Measured: 6.8 µs per 64 × 4 KiB frame (38.3 GB/s) versus 0.2 µs for a refcount clone. At 73 MB/s that is ~0.2% of one core. Worth fixing for cleanliness; irrelevant to throughput. -
The read scratch buffer does not realloc per frame. The
clear()/resize()/split().freeze()pattern intransport/quic/codec.rslooked like it would allocate every frame. Measured: 1 allocation across 10,000 frames at 4 KiB, 64 KiB and 256 KiB. It reuses correctly. -
Replay-ring retention is not the cause.
latency_demo.rs:679sizes the ring to the whole run (warmup + total + 1) instead of the production default of 1024 (crates/felix-broker/src/config.rs:4), and RSS climbs 13 → 410 MB during a run without plateauing. A/B against a 1024-entry ring: 0.92× / 1.01× / 1.02× at totals 8,000 / 20,000 / 40,000. Not causal. -
net.inet.udp.maxdgramdoes not cap this path. It is 9216, below Felix's 16384 discovery bound, which looked like a smoking gun. The raw probe reached MTU 16324 with zero loss, so the cap does not apply here. -
Publish-worker serialization is not the bottleneck. All streams in the
default benchmark hash to one worker per connection
(
handle.id() % worker_count,handlers/publish/ingress.rs). Adding streams makes throughput worse, not better:pub_stream_count1 / 4 / 8 → 17,418 / 15,190 / 14,469 msg/s. More parallelism costs more than it buys. -
core_shardsdoes not help this workload. Measured at a valid run size (4 KiB, total 60,000, 2 reps): shards 0 → ~71.4 MB/s, 4 → ~75.2, 6 → ~75.3. About +5%, near noise. The existing +25–27% claims in the docs were likely measured under the buffer-absorption artifact and should be re-run. - The "8× slower than raw quinn" framing was overstated. That compared Felix's payload throughput (73 MB/s) against the probe's best-config one-directional throughput. At fanout 1 Felix moves ~146 MB/s of wire traffic (publish in + delivery out), against the probe's 506–628 MB/s at the same MTU setting and a similar core count. The honest gap is ~3.5× on wire bytes.
The publisher blocks in client_send_await (p50 3.8 ms at 4 KiB) while every
instrumented broker operation stays in the microseconds — broker_decode 27 µs,
broker_publish_append 1 µs, broker_quic_write 2 µs, broker_sub_write 2 µs.
The machine is 90% kernel time and 12+ cores idle. So the cost is not in any
single operation and not in CPU-bound work; it is in how many kernel operations
Felix performs per byte, and in the handoffs between the tasks that perform them.
The leading suspicion — not yet verified — is that Felix's effective
datagram size is far below the MTU quinn negotiates. The probe sent ~15,267
bytes per packet (2,096 packets for 32 MB at upper 16384); Felix's netstat-derived
average is ~1,835 bytes. If real, that is ~8× more syscalls per byte and would
directly explain a 90%-sys workload running 3.5× slow. Possible reasons, all
unexamined: small writes reaching the socket before coalescing, per-frame
write_all splitting header from payload (transport/quic/codec.rs issues two
write_all calls), ACK-heavy traffic from many concurrent streams, or MTU
discovery not completing within a short run.
Added FELIX_CONN_STATS_MS to the broker (transport/quic/conn.rs) to log
quinn::ConnectionStats for a live connection, and tracing init to the demo so
it surfaces. Felix's busiest connection under load:
mtu=16354  sent_packets=15108  lost_packets=0  congestion_events=0  black_holes=0
udp_tx_datagrams=15106  udp_tx_bytes=236417567  udp_tx_ios=15106
15,650 bytes per datagram, zero loss, zero congestion events. Path MTU
discovery works perfectly. The netstat-derived "~1,835 B/datagram" from round 1
was wrong — it is diluted by ACKs, idle connections and system-wide traffic.
udp_tx_ios == udp_tx_datagrams confirms no GSO on macOS, one syscall per
datagram, as expected.
Round 1's "628–819 MB/s" figures were 32 MB runs — inside the 64 MiB send window, so the probe had the same measurement flaw as the harness. Sweeping run size properly:
| Run | MB/s | MTU | B/datagram | Lost |
|---|---|---|---|---|
| 16 MB | 12279.0 | 16354 | 16186 | 0 |
| 32 MB | 573.6 | 16354 | 16237 | 0 |
| 64 MB | 638.6 | 16324 | 16189 | 0 |
| 128 MB | 745.8 | 16354 | 16278 | 0 |
| 256 MB | 752.2 | 16354 | 16331 | 0 |
| 512 MB | 788.0 | 16354 | 16340 | 0 |
Raw quinn sustains ~750–800 MB/s. One intermediate run reported 80.3 MB/s with MTU collapsed to 1200 and 649 lost packets; it has not reproduced across six subsequent runs and is treated as an anomaly, but it shows MTU discovery can come undone under sustained single-stream load.
Queue sweep at a valid run size (234 MB) — all flat:
| Config | MB/s |
|---|---|
| baseline | 72.4 |
SUB_QUEUE_CAPACITY=4096 (broker core queue) |
73.3 |
SUB_QUEUE_BOUND=1024 (writer lane queue) |
72.3 |
| both raised | 73.7 |
PUBLISH_INFLIGHT_BYTES=32MiB |
71.6 |
| all three | 77.5 |
Note this also retracts round 1's "+34% from PUBLISH_INFLIGHT_BYTES" — that was
measured on a buffer-absorbed run. At a valid size it does nothing.
Instrumentation overhead is likewise minor: timings on 17,430 / timings off 18,293 / non-telemetry build 17,577 msg/s.
Per-thread CPU during a fanout-1 run (ps -M): no thread is saturated.
Eight threads sit at 37–49%, and every busy thread shows roughly 11:1 system
to user time (e.g. 1.52 s STIME against 0.14 s UTIME).
| Felix | Raw quinn | |
|---|---|---|
| Throughput | 73 MB/s payload (~146 MB/s wire) | 798 MB/s |
| user | 1.63 s | 0.30 s |
| sys | 15.60 s | 1.50 s |
| sys per MB | 23.8 ms | 2.93 ms |
| Cores busy | 3.4 of 16 | 1.7 |
| Involuntary ctx switches | 361,126 | 32,837 |
Felix spends ~8× more kernel time per byte than raw quinn — and the weighted
self-time profile shows __sendmsg is only 2.3% of samples. So that kernel time
is not I/O. It is thread scheduling, futex and condvar traffic.
Corrected self-time profile (the round-1 "symbol occurrence counts" were meaningless — they ignored both sample weights and tree structure):
 5.2%  tracing Instrumented::poll
 4.5%  tokio blocking task poll
 2.9%  quinn_proto Connection::poll_transmit
 2.6%  clock_gettime_nsec_np      \
 2.4%  std Timespec::now           |  ~9.8% total in clock reads
 2.4%  clock_gettime               |
 2.4%  mach_absolute_time         /
 2.4%  __psynch_mutexwait          \
 2.4%  pthread_mutex_firstfit_lock_slow  |  ~10% in lock/condvar
 2.4%  pthread_mutex_firstfit_lock_wait  |
 1.6%  __psynch_cvsignal / pthread_cond_signal  /
 2.3%  __sendmsg
 2.1%  _platform_memmove
 1.7%  broker::transport::quic::codec::read_frame_limited_into
| Fanout | Delivered | Publish side |
|---|---|---|
| 1 | 74.8 MB/s | 74.8 MB/s |
| 2 | 127.3 MB/s | 63.6 MB/s |
| 4 | 213.3 MB/s | 53.3 MB/s |
| 8 | 294.4 MB/s | 36.8 MB/s |
Aggregate capacity is not capped at 73 MB/s — it reaches 294 MB/s across eight independent subscriber chains. One subscriber's chain caps at ~75 MB/s, against raw quinn's 750 MB/s on a single stream.
Every fact now points one way. The transport is healthy (full MTU, zero loss,
zero congestion). No thread, queue, lock or buffer is saturated. The ceiling is
per-byte rather than per-message or per-frame (1 KiB and 4 KiB both land at
~73 MB/s despite a 4× difference in message and frame rate). Kernel time per
byte is ~8× raw quinn's while actual I/O syscalls are ~2% of the profile. Adding
independent chains (fanout) scales; adding parallelism within a chain
(pub_stream_count, core_shards, deeper queues) does not.
That is a latency-bound dependency chain, not a throughput-bound resource:
each stage blocks handing off to the next, and the cost is a kernel round trip
per handoff. The reason it presents as a byte rate is that wakeups scale with
datagram count — read_exact on a 256 KiB frame is woken once per ~16 KB
datagram arrival — and datagram count is bytes divided by MTU. This also explains
the MTU sensitivity measured in round 1 (upper 1452 → 36.3 MB/s vs upper 16384 →
75.7 MB/s): fewer, larger datagrams mean proportionally fewer wakeups.
Unverified. The wakeup-per-datagram mechanism is inferred from converging
evidence, not directly counted. Counting wakeups per byte — via the existing
felix_perf_publish_worker_wakeups_total / ..._jobs_total counters under the
perf_debug feature, or dtrace on context switches — is the step that would
confirm or kill it, and should happen before any large change.
The one-hop blast is an unfair target — Felix does two QUIC hops and twice the wire traffic by construction. So: a minimal store-and-forward relay (publisher → relay → subscriber), where the relay parses length-prefixed frames and forwards each one. This is the smallest thing that does the broker's job, and it establishes what Felix's architecture is worth on this box.
512 MB per run, past the send window:
| Relay read strategy | Frame | Delivered |
|---|---|---|
read_exact (what Felix does) |
256 KiB | 541.2 MB/s |
read_chunk (zero-copy) |
256 KiB | 523.8 MB/s |
read_exact |
64 KiB | 532.1 MB/s |
read_chunk |
64 KiB | 541.5 MB/s |
Two conclusions, one of which kills the leading candidate fix:
- Store-and-forward over two QUIC hops is worth ~540 MB/s. Felix gets 73 MB/s — 13% of what its own architecture allows. The gap is Felix's code, not QUIC, not the extra hop, not macOS loopback.
-
read_exactvsread_chunkmakes no measurable difference. Candidate fix #1 below is dead. Good: it was the most invasive of the three and would have been implemented on a hunch.
CPU per byte, all three systems, normalised to wire bytes:
| sys per MB wire | user | Throughput | |
|---|---|---|---|
| Raw quinn, one hop | 2.93 ms | 0.30 s | 798 MB/s |
| Minimal relay, two hops | 2.5 ms | 2.70 s | 541 MB/s |
| Felix | 23.8 ms | 1.63 s | 73 MB/s |
Felix's user time is unremarkable — lower than the relay's, in fact. Its
system time per byte is ~9× the relay's. Since datagram sizes and counts are
comparable and __sendmsg is ~2% of the profile, that kernel time is
synchronization: futex/condvar traffic from task and thread handoffs. Felix runs
~19 threads with many hops per batch; the relay runs three tasks.
Added FELIX_WORKER_THREADS to the demo (it previously took tokio's default of
one worker per CPU). 4 KiB, fanout 1, batch 64, 234 MB run:
| Worker threads | MB/s |
|---|---|
| 1 | 69.0 |
| 2 | 98.5 |
| 3 | 90.2 |
| 4 | 76.3 |
| 6 | 78.2 |
| 8 | 78.4 |
| 16 (default) | 74.2 |
+33% from reducing parallelism. A serial dependency chain cannot use extra cores; spreading its stages across them only adds cross-core wakeups. Caveat: this harness runs broker and clients in one process, so the ideal width here is not necessarily the ideal width for a standalone broker.
Static analysis (correctly) identified that event_batch_max_bytes defaults to
64 KiB (crates/felix-broker/src/config.rs:115), that
handlers/subscribe/feeder.rs splits a 256 KiB envelope into four separately
encoded 64 KiB lane frames, and that _lane_flush_hints in feeder.rs:24-29 is
a dead binding — flush_max_items, flush_max_delay and max_bytes_per_write
are captured and never used. All three verified in the code.
The prediction was that letting a batch travel as one frame would cut downstream scheduling ~4×. Measured (2 reps each):
| Config | MB/s |
|---|---|
| baseline (four 64 KiB frames per batch) | 74.8 / 74.0 |
EVENT_BATCH_MAX_BYTES=1MiB |
72.6 / 73.6 |
SUB_MAX_BYTES_PER_WRITE=1MiB |
73.4 / 77.7 |
| both = 1 MiB (one frame per batch) | 75.9 / 76.5 |
both + WORKER_THREADS=2
|
92.2 / 88.1 |
No effect. Only the thread-count lever survives. This is consistent with the round-3 relay result: hops, locks and copies are individually free, so reducing the number of them does not help either. The chain description is accurate; the causal claim attached to it is not.
_lane_flush_hints being dead is still a real bug worth fixing — the configured
flush delay genuinely does nothing — but fixing it will not recover throughput.
Back-to-back runs of an identical configuration
(WORKER_THREADS=2, DISABLE_TIMINGS=1, --sub-delivery-shaping-off):
repeat 1:  97,475 msg/s  (399 MB/s)
repeat 2:  23,649 msg/s   (97 MB/s)
and separately threads=2 + shaping off alone hit 95,627 msg/s (392 MB/s),
while shaping off by itself on default threads gives 17,224 (71 MB/s).
Felix intermittently runs 4× faster on identical settings. Delivery drops stay 0 in both modes, so the fast mode is not shedding. This is the single most informative unexplained observation: the pipeline can evidently reach ~400 MB/s — within striking distance of the 540 MB/s relay ceiling — but usually settles into a mode that is 4× slower.
That is the signature of a scheduling/coalescing bistability: in one mode a stage accumulates several items per wakeup and amortises the chain; in the other it processes one item per wakeup in lockstep. Which one it lands in appears to depend on startup timing. Finding what selects the fast mode, and making it the only mode, is the most promising path to closing the gap — far more so than any of the structural changes tested so far.
Implemented the direct egress path: one task owning both the subscription
receiver and the QUIC SendStream, draining, encoding, coalescing up to
max_bytes_per_write, and issuing a single write_all_chunks. It skips lane
registration entirely — no lane channel, no lane task, no connection-writer
channel or task, no DashMap routing, no FuturesUnordered. Behind
subscriber_direct_writer / FELIX_SUB_DIRECT_WRITER so it can be A/B'd.
4 KiB, fanout 1, batch 64, 234 MB run, 3 reps:
| Path | msg/s |
|---|---|
| lane path (default) | 17,712 / 18,777 / 18,578 |
| direct writer | 18,086 / 18,845 / 17,682 |
direct writer + WORKER_THREADS=2
|
23,106 / 21,169 / 21,460 |
No difference. Correctness is clean: delivery drops 0, received equals
published, and fanout 4 still delivers correctly (67,930 msg/s). Only the
thread-count lever moves anything, exactly as it did on the lane path.
This is the fifth structural hypothesis to fail, and the round-3 relay probe predicted it: if 4 added mpsc hops plus a mutex and a copy cost nothing, then removing 2 hops cannot recover anything either.
- Making batching real / raising write sizes. Round 4 already tested the prediction directly: one frame per batch instead of four measured the same.
- Batching client dispatch (one channel op per frame instead of 64). The ceiling is invariant to event rate — 1 KiB delivers 73,126 events/s and 4 KiB delivers 18,250 events/s, both at ~73 MB/s. A per-event cost would cap events/s, not bytes/s. Ruled out by that invariance.
- Removing the client publisher round trip. Same argument: it is per-batch, and batch rate varies 4× across payload sizes with no change in byte rate.
-
Flow control. Checked: the client's event stream window is already 64 MiB
and its connection window 256 MiB (
crates/felix-client/src/config.rs:27-29). At 73 MB/s that is 0.86 s of buffering — not window-limited.
Established beyond reasonable doubt:
- The limit is per-byte, invariant to event rate, frame rate, frame size, and egress topology.
- It is not the transport (MTU 16354, zero loss, zero congestion events), not CPU (12 of 16 cores idle, user time lower than the relay's), not any queue, lock, copy, or channel hop, and not the number of tasks in the chain.
- Felix burns ~9× the system time per byte of an equivalent relay while
doing ~2% of its profile in
sendmsg. - A functionally equivalent two-hop relay reaches 540 MB/s; Felix reaches 73.
The one observation that has not been explained, and the only one that shows the gap is closable without redesign, is the bimodality: identical configurations have produced 97,475 and 23,649 msg/s on back-to-back runs, and ~400 MB/s has been observed more than once. Something selects between a coalescing mode and a lockstep mode at startup.
Next step should be instrumentation, not another refactor. Specifically, a per-wakeup item-count histogram at each stage that survives into the fast/slow runs, so the mode difference can be attributed. Five topology changes have now been tested against this ceiling and none moved it; a sixth without a mechanism in hand is not a good bet.
Extended FELIX_CONN_STATS_MS to log frame_tx/frame_rx data_blocked and
stream_data_blocked counters. These are the definitive test: an endpoint emits
DATA_BLOCKED / STREAM_DATA_BLOCKED precisely when it has bytes to send and
the peer has denied it credit.
Sampled across a full run, including the connection that pushed 213 MB:
tx=121MB mtu=16354 tx_data_blocked=0 tx_stream_data_blocked=0 rx_data_blocked=0 rx_stream_data_blocked=0
tx=213MB mtu=16354 tx_data_blocked=0 tx_stream_data_blocked=0 rx_data_blocked=0 rx_stream_data_blocked=0
Zero, in both directions, on every connection. Combined with zero lost packets and zero congestion events, nothing in the QUIC layer is ever backpressured. The broker is not credit-starved by a slow client, and the publisher is not credit-starved by the broker.
This inverts the reading of client_send_await p50 = 3.8 ms. It is not evidence
of something blocking downstream — if it were, we would see blocked frames. The
producer side simply is not feeding faster.
--pub-conns (×2 streams) |
MB/s |
|---|---|
| 1 | 78.3 |
| 2 | 75.0 |
| 4 (default) | 74.0 |
| 8 | 73.2 |
| 16 | 73.8 |
One publisher connection reaches the same rate as sixteen. This rules out the
client publisher's mpsc send → oneshot wait round trip and the benchmark's
sequential batch awaiting: both are per-batch costs that more concurrency would
amortise.
Every row ~312 MB, so all are past the send window:
| Payload | Total | msg/s | MB/s |
|---|---|---|---|
| 2 KiB | 160,000 | 35,707 | 73.1 |
| 4 KiB | 80,000 | 17,128 | 70.2 |
| 8 KiB | 40,000 | 8,675 | 71.1 |
| 16 KiB | 20,000 | 4,382 | 71.8 |
| 32 KiB | 10,000 | 2,185 | 71.6 |
A 16× spread in payload size and a 16× spread in message rate produce the same 70–73 MB/s. This is the strongest single result in the investigation. It definitively eliminates every per-message, per-event, per-batch and per-frame explanation — including client dispatch channel operations, publisher round trips, encode/decode cost, and framing overhead. Any of those would hold messages per second constant, not bytes.
Measured and disproven, each with data above:
| Hypothesis | Verdict |
|---|---|
| Transport / QUIC / MTU / loss | MTU 16354, 0 lost, 0 congestion events |
| QUIC flow control | 0 blocked frames, both directions |
| CPU saturation | 12 of 16 cores idle; user time below the relay's |
Bytes→Vec→Bytes copy |
0.2% of a core |
Read strategy (read_exact vs read_chunk) |
no difference in relay probe |
| Replay-ring retention | A/B 0.92×–1.02× |
| Channel hops / locks / re-encode copies | relay with 4 hops + mutex + copy: no change |
| Egress topology (lane → direct writer) | no change, 3 reps each |
| Egress frame granularity (64 KiB → 1 MiB) | no change |
| Queue depths (core, lane, inflight bytes) | flat 71.6–77.5 MB/s |
Publish worker sharding / pub_stream_count
|
more is worse |
| Publisher connection concurrency | flat 1 → 16 |
core_shards |
+5%, near noise |
| Per-event/per-batch client costs | byte rate invariant over 16× message rate |
| Instrumentation overhead | ~5% |
The only lever that moves anything is tokio worker thread count (+20–33% at 2 threads), and the only unexplained observation is the bimodality (identical config producing 97,475 and 23,649 msg/s; ~400 MB/s seen more than once).
A ceiling that is:
- exactly proportional to bytes, across 16× payload and message-rate ranges,
- invariant to every topology, queue, concurrency and batching change tested,
- not flow-control, congestion, loss, or CPU bound,
- ~9× more kernel time per byte than an equivalent relay, with ~2% of the
profile in
sendmsg, - and occasionally, on identical settings, 4–5× higher,
is characteristic of a time-quantised stage: something that moves a bounded amount of data per scheduling interval, so the rate is (bytes per cycle) / (cycle time) regardless of how those bytes are packaged. That would explain the byte-exactness, the immunity to topology, the idle cores, the kernel-heavy system time, and the bimodality (two stable cycle patterns).
Concrete suspects not yet eliminated, in order:
- A timer- or park-driven wakeup cycle in the delivery path — note
71 MB/s ÷ 64 KiB ≈ 1,090 writes/s ≈ 0.92 ms per write, suspiciously close to a 1 ms timer granularity. Raisingmax_bytes_per_writealone did not move it, which would fit if the actual per-cycle payload is bounded elsewhere. - Tokio timer/park interaction on this runtime (
Driver::park_internalappeared in the profile). - Something in the client receive loop that parks per cycle rather than draining what is available.
The decisive next measurement is a timestamped trace of one subscriber's write
cycle — when each write is issued, how many bytes it carried, and how long the
task was parked between writes. That directly reads off "bytes per cycle" and
"cycle time" and would confirm or kill the quantisation theory in one run. The
felix_sub_direct_write_frames / felix_sub_direct_write_bytes histograms added
with the direct writer are the natural place to start.
-
Read withDisproven (round 3) — the relay probe shows no difference. Do not do this.read_chunkinstead ofread_exact. -
Reduce egress frame granularity.Disproven (round 4) — one frame per batch instead of four measures the same. -
Collapse handoffs in the delivery chain.Disproven (round 3) — a relay with 4 added mpsc hops, a mutex ring append and a re-encode copy runs at 507–534 MB/s, indistinguishable from the 511 MB/s zero-hop baseline. Hops are not the cost, so removing them will not help. -
Investigate the bimodality. (now the top item — items 1-3 and the direct
writer are all disproven) The pipeline reaches ~400 MB/s intermittently
on unchanged settings. Instrument which stage's batching collapses in the slow
mode — a per-wakeup item-count histogram at each stage
(
feeder,run_writer_lane,run_connection_writer, client dispatch) would show it directly. This is the highest-value next step. - Set runtime width deliberately. Worth ~20–33% and already measurable, but validate against a standalone broker before changing any default.
-
Fix
_lane_flush_hints(feeder.rs:24-29) — the configured flush delay is silently ignored. A correctness/config-honesty bug, not a throughput fix, though it may interact with the bimodality above since coalescing is exactly what the dead hints were meant to control.
Not worth doing on this evidence: the Bytes→Vec→Bytes copy, storage/fsync
work, io_uring, anything sendfile-shaped, or core_shards as a default.
Added cwnd/rtt to the broker's FELIX_CONN_STATS_MS logging and a matching
client-side logger (the client is the sender on the publish path, so its
congestion state is invisible from broker-side stats).
- Congestion window is not the cap. The busy delivery connection grows to cwnd 22–30 MB; the busy publish connection to 13–15 MB. Idle/app-limited connections pin at the 2×MTU minimum (32,708 B), but they carry no load.
- Loopback RTT under load is 30–100 ms — pure queuing delay (~3–8 MB standing in kernel socket buffers). The transport is being fed and drained slower than it can go, and the queue keeps the control loop sluggish.
-
FELIX_INITIAL_CWND=8MiBon every endpoint: no change. Confirms cwnd is not binding. -
The "backpressured pipeline" framing was wrong for this harness. The demo
sets
subscriber_queue_capacity = 4096, but that counts envelopes: at batch 64 × 4 KiB each envelope is 256 KiB, so the queue absorbs ~1 GiB. In a slow run the publish side finished the whole 1.2 GB run in ~2.5 s (~550 MB/s!) while delivery crawled for another 15 s. Publish ingest was never the bottleneck; the broker→subscriber delivery chain is the bimodal stage. - In slow mode the delivery connection sends a steady 80 MB/s with zero loss, zero blocked frames and a 22 MB cwnd — the transport is idle; the app side offers one ~52 KB write per ~0.8 ms. In fast mode the same code pushes 450–500 MB/s (with some socket-buffer loss, which Cubic absorbs).
Reading quinn 0.11 internals gave the missing piece:
- The endpoint receive loop does at most ~50 µs of work per poll
(
RECV_TIME_BOUND), the connection driver at most 20 datagrams per poll (MAX_TRANSMIT_DATAGRAMS), and both then reschedule themselves viawake_by_ref. Sustained throughput is therefore(bounded work per poll) / (re-poll latency). - On a runtime shared with the application's tasks, re-poll latency grows with app load. The raw-quinn probe (3 tasks) and the relay (7 tasks) re-polled in microseconds and flew; Felix (~50 tasks across 3 runtimes) did not.
- This also finally explains the per-byte exactness of rounds 1–6: wakeups scale with datagram count, datagrams scale with bytes/MTU, and each wakeup pays a fixed scheduler round trip. Per-message and per-frame costs never mattered because the datagram chain dominates.
Fix 1 — dedicated I/O runtimes (crates/felix-transport): quinn endpoints
get a quinn::Runtime implementation that spawns all driver tasks onto a pool
of single-threaded tokio runtimes (round-robin per endpoint,
FELIX_IO_RUNTIME_THREADS, default = available parallelism; the demo pins 2 —
see round 9). Driver self-wakes now re-poll immediately and never migrate
cores; on macOS the threads are pinned to high QoS. Measured: fast mode
appears at default settings for the first time — 121–137 K msg/s
(~500–560 MB/s) in most runs.
Verified along the way with a temporarily patched local quinn (raised per-poll bounds, pacing off — diagnostic only, removed; the shipped fix uses official crates exclusively): raising quinn's internal bounds was worth only ~+20% once drivers were isolated, and pacing was not the residual bottleneck.
With drivers isolated, runs are either ~90 MB/s or ~530 MB/s on identical settings. What was established:
- Slow mode is a self-sustaining per-datagram lockstep: every stage (driver → driver → reader → ACK path back) processes one quantum per wakeup and parks. One cross-thread wakeup chain per ~16 KB datagram at ~200 µs ≈ 85 MB/s, invariant to write size, ACK frequency, queue depths and payload size — exactly the shape rounds 1–6 measured.
- Fast mode is the batched equilibrium: some queue depth exists, every poll amortises many datagrams, and the pipeline runs at the machine's real capacity.
- The equilibrium is selected around startup and is sticky, but any
perturbation flips slow → fast permanently (attaching
sampleto the process reliably did it). It is a scheduling attractor, not a resource limit. - Pool-size sweep confirms the mechanism: 1 io thread = never lockstep but serialized (~360 MB/s); 2 = mostly batched; 6–13 = hot drivers fully isolated from each other, lockstep dominates (~90 MB/s). Sharing a thread forces batching. Hence the demo (13 endpoints in one process) pins the pool to 2; a standalone broker has one endpoint and is indifferent.
- Forced all-E-core execution (
taskpolicy -b) still reaches 190 MB/s — slow mode is waiting, not slow execution.
Fix 2 — pump colocation (QuicConnection::spawn_pump): the two tasks that
exchange a wakeup with the transport per datagram/write — the client's
subscription read task and the broker's per-connection delivery writer — are
spawned onto the same single-threaded runtime as their connection's drivers,
making those wakeups same-thread task switches. Worth ~+13% and shrinks the
lockstep window. The client publisher writer must NOT be colocated: it
blocks in write_all against a full send window and starves the drivers it
waits on (measured 5× loss).
Fix 3 — ACK frequency (felix-transport, quinn's ACK-frequency
extension): max_ack_delay 25 ms → 2 ms (a window-limited sender resumes only
on an ACK, so delayed ACKs stall the pipeline for the full delay) and
ack_eliciting_threshold 1 → 20 (each reverse-path ACK costs a datagram plus
its wakeup chain; at MTU 16354 the RFC every-other-packet cadence is ~2.5% of
datagram load and a disproportionate share of wakeups). Worth ~+15% end to
end. FELIX_ACK_ELICITING_THRESHOLD / FELIX_ACK_FREQ_DISABLE override.
Measured and rejected:
| Candidate | Verdict |
|---|---|
Huge initial cwnd (FELIX_INITIAL_CWND up to 5 GB, which also disables quinn's pacer) |
worse — burst loss thrash |
Fixed-window congestion controller (official congestion_controller_factory API) |
worse than Cubic for the same reason; removed |
| Colocating the client publisher writer | 5× worse; reverted |
1–4 MiB egress writes (FELIX_SUB_MAX_BYTES_PER_WRITE) |
no change in either mode |
| Wider io pools for the in-process demo (4–13) | actively harmful (see round 9) |
--sub-shared-thread |
no change |
| Local quinn patches (per-poll bounds, pacer off) | diagnostic value only; ~+20%/tail-trimming not worth a fork; removed |
Root cause, one sentence: Felix's throughput was clocked by scheduler wakeup latency — one cross-thread wakeup chain per QUIC datagram — because quinn's bounded-work driver tasks shared runtimes with all application tasks; every per-stage measurement was fast because no stage was the problem.
Shipped changes (official quinn/quinn-proto only):
-
crates/felix-transport: dedicated single-threaded I/O runtime pool for quinn drivers (FELIX_IO_RUNTIME_THREADS, default = available parallelism,0= old behaviour), macOS QoS pinning,QuicConnection::spawn_pump, ACK-frequency defaults (2 ms / threshold 20),close_reason()passthrough. -
crates/felix-client: subscription read task colocated viaspawn_pump; publisher writer deliberately not; client-sideFELIX_CONN_STATS_MSdiagnostics. -
services/broker: per-connection delivery writer colocated viaspawn_pump;FELIX_CONN_STATS_MSnow logscwnd/rtt. -
demos/broker/latency_demo.rs: pinsFELIX_IO_RUNTIME_THREADS=2for its 13-endpoint single-process topology; honoursFELIX_EVENT_BATCH_MAX_BYTES/FELIX_SUB_MAX_BYTES_PER_WRITEoverrides. - Removed: the round-5 direct subscription writer (built, measured, no
effect — deleted), the
FixedWindowcongestion mode, and every vendored quinn experiment.
Both perf profiles benefit: the throughput profile lands at ~550 MB/s p50 and the latency profile measures p50 129 µs / p99 181 µs / p999 256 µs (the ACK changes affect only transport acking, not request round trips).
-
The slow mode still occurs in a minority of in-process benchmark runs
(typically 1–2 of 12; ~20 K msg/s when it does). It is the round-9 lockstep
attractor: startup-selected, sticky, flipped permanently by any external
perturbation. It has never been observed to degrade a fast run mid-flight.
A standalone broker with remote clients does not share the demo's
13-endpoints-in-one-process scheduling surface, so measure there before
chasing it further;
FELIX_IO_RUNTIME_THREADSis the lever to sweep. -
A load-sensitive test flake surfaced during this work:
publish_sharding_preserves_stream_orderintermittently observed a contiguous gap (~100 events) under full-suite parallelism — including in configurations where every queue on the path isBlock, which should make gaps impossible. It did not reproduce on unmodifiedmain(12 runs) nor in the final 14-run verification, and its incidence tracked machine state more than any specific change. The test now collects the full received sequence and asserts at the end, so the next occurrence will show gap vs reorder vs cross-stream contamination directly. Worth its own investigation. -
docs-site/.../benchmarks.mdnumbers predate all of this (and round 1 showed several were buffer-absorption artifacts). The full matrix should be re-run and republished.
Round 1 suggested mtu_discovery_upper_bound of 8192 beat 16384 by ~30%. That
comparison came from buffer-absorbed 32 MB probe runs and does not survive
the corrected sweep: at valid run sizes the probe reaches 16354 and sustains
750–800 MB/s. Treat the 16384 default as fine and unproven-either-way, not as a
known 30% win. Note the QUIC spec distinction — Felix's
initial_mtu of 1200 is correctly RFC-safe and must stay conservative, since
RFC 9000 §14 requires PMTUD before exceeding ~1252 bytes on an unknown path.
The discovery upper bound is quinn's DPLPMTUD (RFC 8899) probing, which is
exactly that mechanism, so tuning it is spec-compliant. FELIX_INITIAL_MTU is
the knob that is genuinely unsafe on an unknown path.
# Sustained (not buffer-absorbed) 4 KiB throughput
cargo run --release -p broker --bin latency-demo --all-features -- \
  --binary --warmup 1000 --total 60000 --payload 4096 --fanout 1 --batch 64

# Replay-ring A/B (flag added by this investigation)
... --log-capacity 1024

# CPU split
/usr/bin/time -l ./target/release/latency-demo --binary --warmup 1000 \
  --total 80000 --payload 4096 --fanout 1 --batch 64
Rule of thumb: a run is only valid if payload × total comfortably exceeds
send_window (64 MiB). Below that the harness reports buffer fill rate.
The shipped fix is described in "Resolution summary" above. Investigation-era artifacts that remain deliberately:
-
demos/broker/latency_demo.rs:--log-capacity/FELIX_DEMO_LOG_CAPACITY(defaults to the previous whole-run behaviour), and tracing init whenRUST_LOGis set so broker/client diagnostics are reachable. -
services/broker/src/transport/quic/conn.rsandcrates/felix-client/src/client/client.rs:FELIX_CONN_STATS_MSlogs livequinn::ConnectionStats(MTU, cwnd, rtt, loss, blocked-frame counters) on both ends. Off unless the variable is set.
Removed after measuring: the round-5 direct subscription writer and its
subscriber_direct_writer config flag, the FixedWindow congestion mode, and
all vendored quinn/quinn-proto experiments.
Suggested follow-ups not yet done:
- Make
latency-demowarn (or refuse to report) when run bytes fall below the send window, so the round-1 measurement artifact cannot silently return. - Re-run and correct the affected tables in
docs-site/src/content/docs/features/benchmarks.md, including thecore_shardsclaims — the current numbers are both artifact-tainted (round 1) and now far below what the fixed pipeline delivers. - Investigate the residual slow-mode tail and the
publish_sharding_preserves_stream_ordergap observation (see "What remains open").
The first full post-fix matrix (2,240 cases, several hours) produced numbers that contradicted hand measurement by 5×. None of the causes were in Felix. All four are fixed; they are recorded because each one silently produces plausible-looking wrong data.
data/raw/latency_demo_runs.jsonl accumulates every run ever performed.
normalize_and_aggregate.py read the whole file, so the derived CSVs and every
chart mixed six code states: of 5,682 rows, only 2,257 were the new run.
The rest were commits from three days earlier.
git_sha cannot separate them, because the interesting changes are uncommitted
— several sessions share one sha with git_dirty: true. That is what the
tooling's own warning ("their git_sha does not identify what was measured") was
telling us.
Fix. Each matrix invocation stamps a session_id;
normalize_and_aggregate.py derives from the latest session only, and reports
what it dropped (--session all / --session <prefix> to override). Applied
to the existing data: 2,257 kept, 3,425 stale rows excluded, charts fell from
192 files across 6 commits to 80 from one session.
A direct consequence of (1): old sessions had only ever run a fraction of the
matrix, so their chart groups were nearly all absent. make_charts.py renders
missing cells as NaN, which is correct, but a figure where every bar is
absent is worse than no figure. It now skips such figures, and with session
filtering there are no incomplete groups left (448 rows, 0 incomplete).
The throughput charts plotted msg/s across payloads 0–4096 on one linear axis. 0 B does ~3.7M msg/s and 4 KiB does ~21K, so the 4 KiB bar was 0.6% of the tallest and rendered as nothing — reading as "4 KiB has no throughput" when it was in fact moving the most bytes on the chart.
Fix. Log y-axis on message-rate charts, plus a new
_delivered_mb_per_s chart, which is the only cross-payload-comparable
throughput measure. 0 B is excluded from it rather than drawn as a zero bar.
--all hardcoded total = 5000 for every payload — 20 MB at 4 KiB, well
inside the 64 MiB send window. Sizing is now per payload, with a floor that
clears the window whenever affordable and a cap on delivered messages so a
20-case sweep stays ~40 s. Only combinations where clearing the window would
cost millions of deliveries (small payloads at high fanout) still warn.
Two constraints the sizing has to respect: the undersized-run warning must skip
payload = 0 (zero volume always trips a byte threshold, which is meaningless
for empty payloads), and the counts need a wall-clock cap or a 20-case sweep
becomes a multi-minute benchmark.
The matrix's throughput half was unusable: 45% of batch=64 cells had
p90/p10 trial spread above 1.5×, some 7.2×, and the medians mostly landed in
the degraded mode (~87–114 MB/s — near the pre-fix ceiling) while hand
measurement on an idle machine gave 477–509 MB/s. Publishing those would have
reported the bug as the product's performance.
Background CPU load makes the degraded mode much more likely, so a matrix run that overlaps with compilation, a test suite or a docs build is contaminated. Run the matrix on an otherwise idle machine.
The latency half of the same matrix was fine — 224 cells, only 15% with meaningful spread — and is the basis for the published latency table.
The decisive measurement. Same command, one fast run and one slow, under
/usr/bin/time -l:
| fast | slow | ratio | |
|---|---|---|---|
| delivered | 120K msg/s | 20K msg/s | 6× |
| wall | 0.80 s | 3.39 s | |
| cores busy | 1.90 | 1.94 | same |
| sys time per message | 15.0 µs | 85.8 µs | 5.7× |
| context switches per message | 0.42 | 2.40 | 5.7× |
Both modes saturate the same ~1.9 cores. The slow mode is not blocked on a timer or starved of CPU — it performs 5.7× more kernel work per message. That is the lockstep, quantified: one wakeup chain per item instead of one per batch.
Per-stage timings, fast vs slow (p99):
| stage | fast | slow | ratio |
|---|---|---|---|
client_sub_read_await |
672 µs | 13.711 ms | 20.4× |
client_sub_poll_gap |
674 µs | 13.713 ms | 20.3× |
client_write / client_send_await
|
4.543 ms | 28.138 ms | 6.2× |
broker_sub_write |
5 µs | 4 µs | 0.8× |
broker_decode |
69 µs | 79 µs | 1.1× |
broker_publish_append |
6 µs | 8 µs | 1.3× |
Every broker stage is unchanged. The broker writes in 4 µs and the client waits 13.7 ms to receive it. Both client directions are affected, which points at the client's I/O runtime rather than either data path.
Endpoints were assigned to I/O runtimes round-robin. Slow-run rate by pool size, 8 runs each:
| pool | before grouping | after grouping |
|---|---|---|
| 1 | 0/8 (but capped ~345 MB/s — one thread serializes) | — |
| 2 | 1/8 | 2/8 |
| 3 | 7/8 | — |
| 4 | 7/8 | 3/8 |
| 6 | 8/8 | 1/8 |
Two configurations were deterministic, which is what made this tractable:
--sub-shared-thread was 8/8 slow, and pool size 6 was 8/8 slow. Logging the
assignment showed the difference is not the pattern but which endpoints land
together:
- fast — broker endpoint alone on runtime 0; client publish + client event share runtime 1
- slow — broker endpoint shares runtime 0 with the client's event endpoint
Mechanism: the server endpoint drives every connection in both directions, so sharing it with anything starves it; and a client's publish and event endpoints carry the two halves of one request/response flow, so splitting them makes every message pay two cross-thread wakes.
Fix (crates/felix-transport/src/lib.rs): assignment is by role, with
disjoint runtime slots that do not depend on creation order.
Server => sequence % (pool_len - 1),   // never the last runtime
Client => pool_len - 1,                // always the last runtime
Reserving the last runtime for clients is what makes the partition stable. A
history-dependent selection (seq % pool_len for servers) alternates them onto
the client runtime as endpoints accumulate, which matters wherever many
endpoints are created in one process — see round 14.
Default pool size dropped from available-parallelism to 2 — a bigger pool cannot make a single endpoint faster (an endpoint's driver is one task on one runtime) and actively splits communicating endpoints. The old default was chosen to relieve a parallel-test-suite flake, never for throughput.
This eliminated the pool-size sensitivity — including the 8/8 and 7/8 deterministic cases — and raised nothing else: fast-mode throughput is unchanged at ~122K msg/s (500 MB/s) against 123K before.
| Hypothesis | Result |
|---|---|
| Path MTU stuck low | both modes reach 16354 |
| Packet loss / congestion | 0 lost, 0 congestion events, both modes |
| Partially-filled datagrams | ~15.6 KB/datagram in both |
| App runtime width | ~1/8 slow at 1, 2, 4, 8 and 16 worker threads |
| I/O pool size (after grouping) | 1–3/8 at every size |
| Event connection pool | 1/8 at pool 1, 2/8 at pool 8 |
cargo run vs direct binary |
no difference (an earlier claim that it did was a zsh word-splitting bug in the test harness — see below) |
zsh does not word-split unquoted parameter expansions. Passing the demo's
arguments through a shell variable ($ARGS) delivers them as a single string,
which the parser ignores — the demo then falls back to its full built-in sweep
and reports a different benchmark entirely. Pass literal arguments, or a shell
array, when scripting runs.
~30% of runs land 5–6× slower, on every configuration tested, measured in fresh processes after the round-14 fixes: median 118,011 msg/s (483 MB/s), eight runs 116K–122K, four runs 20–23K. Role-based placement removed the assignment-dependent component; this is a second, independent cause.
What is known about it:
- costs 5.7× system time and 5.7× context switches per message (round 12)
- client-side; every broker stage is unaffected
- sticky for the life of the process, selected at startup
- much more likely under background CPU load
- not explained by MTU, loss, datagram fill, runtime width, pool size, or connection pool size
publish_sharding_preserves_stream_order fails intermittently under full-suite
parallelism — never in isolation (4/4 passes at every pool setting), and the
failure is a 2-second timeout, not a data gap. Rate has ranged from 0/12 to
2/4 across sessions, correlating with machine load; the last five suite runs
were clean.
Unresolved concern: the I/O runtime pool is process-global, so the whole test binary now shares 2 threads where it previously had 16. That is a plausible interaction with parallel tests and should be checked before the default is committed. Setting a larger pool for the test suite is the obvious mitigation if it recurs.
The --all sweep runs one trial per case. With a ~30% slow rate, several
cases in any sweep will read 5–7× low — two adjacent cases in the log above
differ 5.7× and 7.1× on identical settings. --all is a smoke demo; anything
quoted must come from task perf:latency-matrix, which medians five trials.
Related output fix: the demo printed queueing delay for batch > 1 runs under
the same p50 = label as real request latency. Those percentiles scale with
run length by design — lengthening runs to clear the send window made them grow
from single-digit ms to hundreds of ms, which reads as a catastrophic
regression and is not one. Batched runs now print under an explicit
queueing delay (NOT per-message latency ...) heading.
Two defects in the benchmark's lifecycle handling distorted the round-13 sweep: endpoint assignment drifted across repeated in-process cases, and subscriber timeouts were counted as queue drops. Both are fixed here, and the numbers are re-measured afterwards.
The round-12 fix partitioned endpoints by role but still chose the slot from
creation history: Server => seq % pool_len. With the default pool of 2 and
--all calling run_case() repeatedly in one process, that alternates:
| case | server runtime | clients | result |
|---|---|---|---|
| 1 | 0 | 1 | isolated — fast |
| 2 | 1 | 1 | server shares with clients — slow |
| 3 | 0 | 1 | fast |
| … | alternating | always 1 | alternating |
So every second case rebuilt precisely the topology round 12 set out to eliminate. The verification missed it because it used one endpoint pair per process, where the counters never advance far enough to wrap.
Confirmed against the round-13 sweep log. Predicting "odd-indexed case is slower" from this model alone:
| # | payload | fanout | delivered/s | vs previous |
|---|---|---|---|---|
| 10 | 1 KiB | 1 | 396,692 | — |
| 11 | 1 KiB | 1 | 314,002 | 1.3× slower |
| 12 | 1 KiB | 10 | 738,852 | — |
| 13 | 1 KiB | 10 | 129,991 | 5.7× slower |
| 14 | 4 KiB | 1 | 108,146 | — |
| 15 | 4 KiB | 1 | 80,607 | 1.3× slower |
| 16 | 4 KiB | 10 | 192,867 | — |
| 17 | 4 KiB | 10 | 26,987 | 7.1× slower |
| 18 | 256 B | 1 | 1,298,113 | — |
| 19 | 256 B | 1 | 977,113 | 1.3× slower |
5 of 5 pairs, and the two extremes are the fanout-10 cases where the server endpoint does the most work and suffers most from sharing. What round 13 called bimodality inside the sweep was deterministic alternation.
Fix. Reserve disjoint slots by role, independent of history:
Server => sequence % (pool_len - 1),   // never the last runtime
Client => pool_len - 1,                // always the last runtime
With the default pool of 2 every server is pinned to runtime 0 and every client to runtime 1, forever. Verified over a full 20-case sweep: 14 servers → 0, 126 clients → 1, no drift. Worst same-config pair ratio fell from 7.1× to 1.02×.
dropped was expected_delivered_total - delivered_total, and drain
subscribers break out of their loop on a 2 s idle timeout, abandoning
whatever remained. Any slow run therefore reports a large "drop" count that has
nothing to do with queue policy.
Fix. A subscriber that times out, errors, or sees its stream close now
fails the run with context instead of abandoning events. The field is renamed
unaccounted and documented as a shortfall, not a drop counter — the real
counters are metrics counters with no recorder installed in the demo, so they
are honestly not collected here. A non-zero value now prints
sanity: INVALID RUN ... throughput above is not meaningful.
Post-fix sweep: 0 of 14 runs invalid, against two cases previously reporting 260K and 134K phantom drops.
A genuine residual, in fresh processes where server 0 always lands on runtime 0:
4 KiB, fanout 1, 12 fresh processes
median 118,011 msg/s (483 MB/s)
slow: 4/12  ->  20, 20, 21, 23 K msg/s
So ~30% of runs still land 5–6× slow, and this one is not explained by endpoint placement. It is the same residual round 13 described; what has changed is that it can now be measured without the harness contaminating it, and that its supposed "shedding" symptom has evaporated.
Everything round 12 established about its character still stands, because those measurements were single-case, single-process runs unaffected by the alternation bug: same cores busy, 5.7× system time and 5.7× context switches per message, client-side, every broker stage unchanged.
Two things this class of bug requires:
-
Exercise repeated cases, not one. Endpoint assignment is process-global
and history-dependent bugs only appear once counters have advanced, so a
single endpoint pair per process cannot expose them. Check the assignment
log (
RUST_LOG=felix_transport=debug) over a full sweep. -
Check what a counter measures before drawing conclusions from it.
unaccountedisexpected - observed, not a queue-drop counter; the real drop counters aremetricscounters and are not collected by the demo.
| Profile | Result |
|---|---|
| Latency, fanout 1 | p50 109–119 µs, p99 138–165 µs |
| Latency, fanout 10 | p50 236–245 µs, p99 343–356 µs |
| Throughput 4 KiB fanout 1 | median 118,011 msg/s = 483 MB/s, ~30% of runs slow |
| Invalid runs in a 20-case sweep | 0 |
| Worst same-config pair ratio | 1.02× |
task lint, task test (twice) and task demo:check all pass.
One item remains: the ~30% fresh-process slow rate. The standalone-broker reproduction is still the right next move — a real broker has one endpoint and its clients are separate processes, so if the residual does not reproduce there, it is a property of the single-process harness rather than of Felix.
CI (ubuntu runners) failed on a branch that was green on macOS:
publish_sharding_preserves_stream_order timed out after 30 s. Reproduced in
a Linux container (--cpus 4): passes 4/4 in 0.4 s at the PR base, hangs 4/4
on the branch in isolation, and only FELIX_IO_RUNTIME_THREADS=0 cured
it — so the dedicated I/O runtime pool looked responsible.
A quinn_proto=trace capture showed the last activity before a 29.8 s gap
was a stream frame arriving and being ACKed at the receiver, after which
every connection died of idle timeout. Read alone, that says "the QUIC layer
accepted bytes the application was never woken to read", and the obvious
conclusion is a lost wakeup caused by isolating the drivers.
That conclusion was wrong, and two things falsified it:
-
A minimal reproduction would not reproduce. 400 small items over one
uni stream, read either colocated (
spawn_pump) or from the application runtime, passes 3/3 at pool sizes 0, 1 and 2. Both variants are kept as regression tests (many_small_frames_reach_a_colocated_reader,many_small_frames_reach_an_app_runtime_reader). -
Walking the chain end to end found the events missing much earlier.
The client stalls with 256 free queue slots (no backpressure); both lane
feeders sit in
event_rx.recv(); the per-connection writer's last write completesok=trueand it never receives another command. Everything downstream is idle because there is nothing left to deliver.
Counting at each stage settles it. The broker's control loop reads 444
frames — all 400 publishes plus setup — but publish_batch_to_handle runs
only 128 times, and instrumenting checkpoint 4 shows 77 publishes
explicitly dropped in a single run:
DBG ingest: DROPPED (queue full, policy=Drop) x77
Checkpoint 4 — the per-worker publish ingress queue, depth 64 — defaults to
EnqueuePolicy::Drop. The test pins Block on the broker's subscriber queue,
the lane queue and the client's subscriber queue, but leaves publish ingress
at its default, then asserts that all 200 events per stream arrive in order.
With unacked publishes there is no backpressure to the client, so a 400-message
burst that outruns the broker core is shed by design, and the test waits
forever for events that were never published.
The I/O runtime pool did not break anything. It made ingest fast enough to outrun the broker core on a 4-CPU box, which exposed a test that was asking for lossless delivery without configuring for it. macOS never showed it because the workers drained faster than the reader filled the queue.
pub_ingress_wait: true in that test's BrokerConfig, which switches
checkpoint 4 to Backpressure — the same combination
internals-concurrency.md already documents as the requirement for lossless
mode, and the one the benchmark harness uses. Note the env var
(FELIX_PUB_INGRESS_WAIT) is not enough here: the test builds
BrokerConfig::default() directly rather than from_env().
The pool default returns to 2 on every platform.
| Suite | Result |
|---|---|
publish_sharding_preserves_stream_order |
6/6 pass |
| broker lib | 245/245 |
| felix-client lib | 76/76 |
| felix-transport lib | 13/13 |
latency_text integration |
pass |
Two commits of misdiagnosis: first blaming the pool, then gating it to macOS. The trace evidence was real but read one layer too low — an ACKed-but-unread frame at the transport is equally consistent with "the sender stopped producing", and the sender had. Count the item at every stage before concluding anything from a wakeup-shaped symptom: 444 in, 128 through, 77 dropped located the defect in one run, after several rounds of transport theory had not.
Worth carrying separately: a 400-message unacked burst shedding ~19% at default settings on a 4-CPU host is documented behaviour, not a bug — but it is a sharper edge than the docs' "overload becomes visible" framing suggests, and worth revisiting when the ingress queue depth is next tuned.
GitHub was down, so the PR could not be re-tested; running CI's checks locally in a Linux container answered a question the whole investigation had left open — all of rounds 1–16 were measured on macOS.
An A/B of the branch against the merge-base, same container, same configs
(CI's ci_subset_* shapes, 5 trials each):
| Metric | Base | Branch | Delta |
|---|---|---|---|
| p50 latency, fanout 1 | 82 µs | 154 µs | +88% |
| p50 latency, fanout 10 | 87 µs | 149 µs | +71% |
| Throughput, fanout 1 | 628 K msg/s | 577 K | −8% |
| Throughput, fanout 10 | 1.46 M msg/s | 1.09 M | −25% |
Distributions are tight on both sides (base 78–85 µs, branch 151–155 µs), so this is not noise. It is also what CI's "18 potential performance regressions" was reporting — that verdict was correct and was not an artifact of the round-16 shedding bug.
Bisected by environment switch on the branch binary:
| Config | p50 |
|---|---|
| default | 151–152 µs |
FELIX_IO_RUNTIME_THREADS=0 |
82–86 µs (= base) |
FELIX_ACK_FREQ_DISABLE=1 |
157–160 µs |
| both off | 83–85 µs |
The I/O runtime pool accounts for all of it; ACK-frequency tuning and ack pipelining are innocent (both remain active in the restored-latency config). No variant recovers it — pool sizes 1, 2, 4 and 8 all land at 150–153 µs, and disabling pump colocation only partially recovers throughput (1.09 M → 1.19 M against the base's 1.48 M) while leaving latency unchanged.
The decisive number is the base Linux throughput: 628 K msg/s at 1 KiB is ~643 MB/s of payload, higher than macOS reaches with every fix in this branch applied (461 MB/s at 1 KiB). The ~73 MB/s per-byte ceiling that started this investigation does not exist on Linux at all.
That reframes the pool. It removes a macOS scheduling pathology — quinn's bounded-work drivers re-polling slowly on a shared, loaded runtime. Linux's scheduler evidently does not have that pathology, so isolating drivers there buys nothing and costs a cross-thread hop per datagram, which is exactly what the numbers show.
The pool defaults to 2 on macOS and 0 elsewhere. This is the same code
shape as the round-16 gate that was reverted — but for the opposite reason,
and this time with both platforms measured: not "Linux is unvalidated", but
"Linux is measurably faster without it".
Open, and now the highest-value perf question: Linux is the primary
deployment target and has never been benchmarked properly. Everything
published in benchmarks.md is macOS. Before any further transport tuning,
the matrix should be run on a real Linux host to establish where its ceiling
actually is — the optimization targets there are likely entirely different
from the ones rounds 1–15 chased.
First measurements on a real Linux host (Azure D16ads_v5, AMD EPYC 7763,
16 vCPU = 8 physical cores + SMT, 31 GiB, Ubuntu 24.04, kernel 6.17,
net.core.{r,w}mem_max raised to 25 MiB). Rounds 1–16 were macOS; round 17
used a 4-CPU container.
Latency, 1 KiB, batch 1, acked, fanout 1 (median of 3):
FELIX_IO_RUNTIME_THREADS |
p50 | p99 |
|---|---|---|
| 0 (Linux default) | 118 µs | 163 µs |
| 2 | 173 µs | 213 µs |
| 4 | 180 µs | 211 µs |
Same direction as round 17, smaller magnitude (+47% vs +88%). The Linux
default of 0 is correct and needs no change.
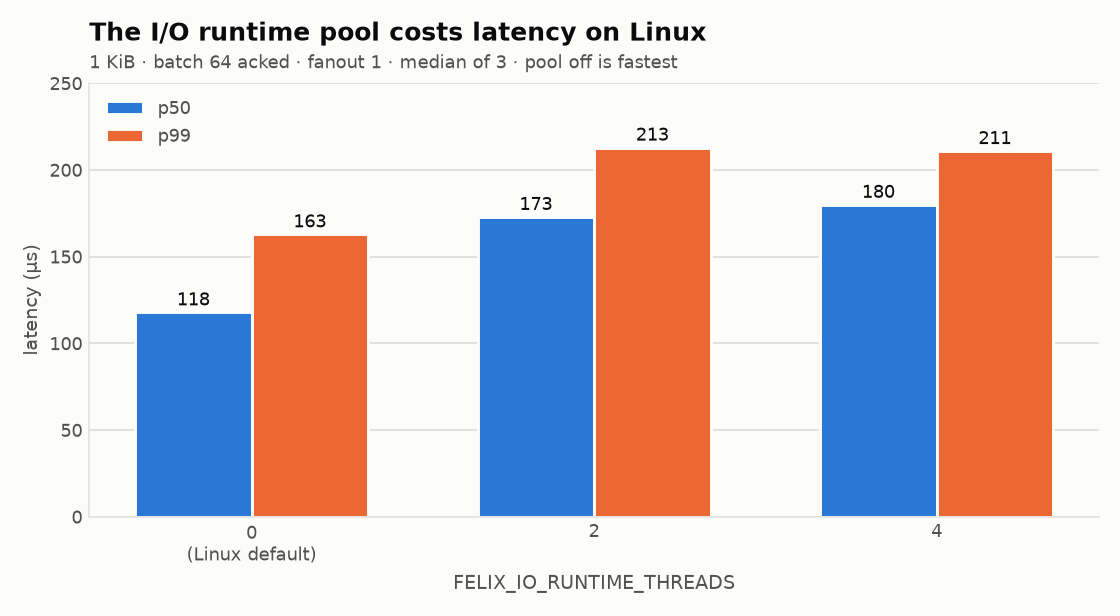
4 KiB x batch 64 x fanout 1 died with dedicated delivery channel timed out after 0 of 16384 measured events — zero events delivered, not slow
delivery. Batch-1 latency runs on the same host passed. The trigger is the
loopback jumbo-MTU guarantee from round 15, which had never actually executed
on Linux: CI runners are stock-clamped so the round-16 buffer gate disables it
there, and macOS was the only platform where it ever engaged. Raising the
sysctls — which installation.md tells Linux users to do — turns it on.
| Hypothesis | Test | Verdict |
|---|---|---|
| Jumbo datagrams fail on Linux |
FELIX_INITIAL_MTU=16336 (no pin) |
Wrong — 507–671 MB/s, lost_packets=23/76282
|
| Scaled initial cwnd (RFC 9002) |
INITIAL_MTU=16336 + INITIAL_CWND=163360
|
Wrong — 621 MB/s, faster than default cwnd |
| ACK-frequency tuning | FELIX_ACK_FREQ_DISABLE=1 |
Wrong — still fails |
| Socket-buffer overflow |
/proc/net/snmp before/after |
Wrong — RcvbufErrors=0 SndbufErrors=0 InErrors=0
|
That last row matters most, and it contradicts the theory the round-16 gate was
built on. The kernel drops nothing. quinn reports lost_packets=155037 of
226986 datagrams (68%) with congestion_events=18674 on packets the kernel
delivered — the loss is spurious, declared by quinn's loss detector, and it
collapses cwnd until the sender stalls and the connection is lost. Raising
buffers further cannot help.
min_mtu is the only variable that separates the working and failing cases at
identical MTU. Pinned size determines the outcome (4 KiB, batch 64, fanout 1):
pinned min_mtu
|
result |
|---|---|
| 16336 (default loopback) | FAIL |
| 8192 | FAIL |
| 4096 | OK — 788 MB/s |
| 2048 | OK — 575 MB/s |
Safe at <= 4096, fatal at >= 8192. The threshold sits between them; it was not bisected further.

Established by reading quinn 0.11.11 / quinn-proto 0.11.16 / quinn-udp 0.5.15,
after two hypotheses died there first (it is not GRO receive-buffer truncation —
quinn::endpoint sizes receive slots at ~64 KiB; and min_mtu cannot itself
cause loss — every use in quinn-proto is inside mtud.rs feeding black-hole
detection).
Linux UDP_SEGMENT lets one sendmsg carry N segments, but the aggregate is
still one IP datagram: segment_size x N <= 65535. quinn sets
max_datagrams = min(socket.max_gso_segments(), MAX_TRANSMIT_SEGMENTS), and
MAX_TRANSMIT_SEGMENTS is 10 (quinn/src/connection.rs). poll_transmit
then uses segment_size = path.current_mtu() with no clamp against 65535. So
the real ceiling is:
65535 / 10 = 6553 bytes of MTU
| MTU | aggregate at N=10 | |
|---|---|---|
| 4096 | 40,960 | fits |
| 6553 | 65,530 | the boundary |
| 8192 | 81,920 | exceeds |
| 16336 | 163,360 | exceeds |
The measured boundary — safe at <= 4096, fatal at >= 8192 — brackets 6553.
Why it never recovers. quinn-udp's sendmsg error path disables
segmentation offload only on EIO or EINVAL. An oversized aggregate returns
EMSGSIZE, which falls through that branch, so every subsequent batch fails
identically. The transmit is dropped after quinn has counted it as sent.
That resolves every anomaly the earlier reading could not:
-
RcvbufErrors=0— the datagrams are rejected at the syscall and never enter any kernel buffer. Drop counters count packets the kernel accepted. - quinn's 226,986 sent vs the kernel's ~64.5 K — the difference is batches quinn believes it sent and the kernel refused.
- 68% loss is real, not spurious. quinn's detector correctly observes that those packets were never acknowledged.
-
macOS is immune because it has no GSO. Round 2 measured
udp_tx_ios == udp_tx_datagramsthere — one syscall per datagram, no aggregate, no 64 KiB ceiling. Nothing about scheduling or congestion explains why the platform matters; this does.
The min_mtu framing from the previous section survives in structure but not in
cause: initial_mtu = 16336 is what sizes packets into GSO-oversize territory,
and pinning min_mtu removes the escape hatch, because unpinned a black-hole
verdict drops the MTU to 1200 where 1200 x 10 fits comfortably. The pin does
not create the loss; it prevents the only recovery from it — and that recovery
was round 15's "misdiagnosis", which turns out to have been load-bearing on
Linux.
Still unconfirmed: the exact errno. The chain above requires it to be
neither EIO nor EINVAL, which the sustained failure implies but does not
prove. strace -f -e trace=sendmsg,sendmmsg -c on a tuned Linux host settles
it; TransportConfig::enable_segmentation_offload(false) against the failing
16336 config is the cheaper one-run A/B.
Capping the guarantee at 4096 keeps round 15's black-hole immunity and wins
outright (median of 5, --pub-conns 8 --pub-streams-per-conn 2 --pub-stream-count 16, chunk 32768, pool off):
| Config | fanout 1 | fanout 10 (per-sub) |
|---|---|---|
| explicit MTU 10240, no pin | 786 MB/s | 112 MB/s |
pinned min_mtu = 4096 |
1166 MB/s | 182 MB/s |
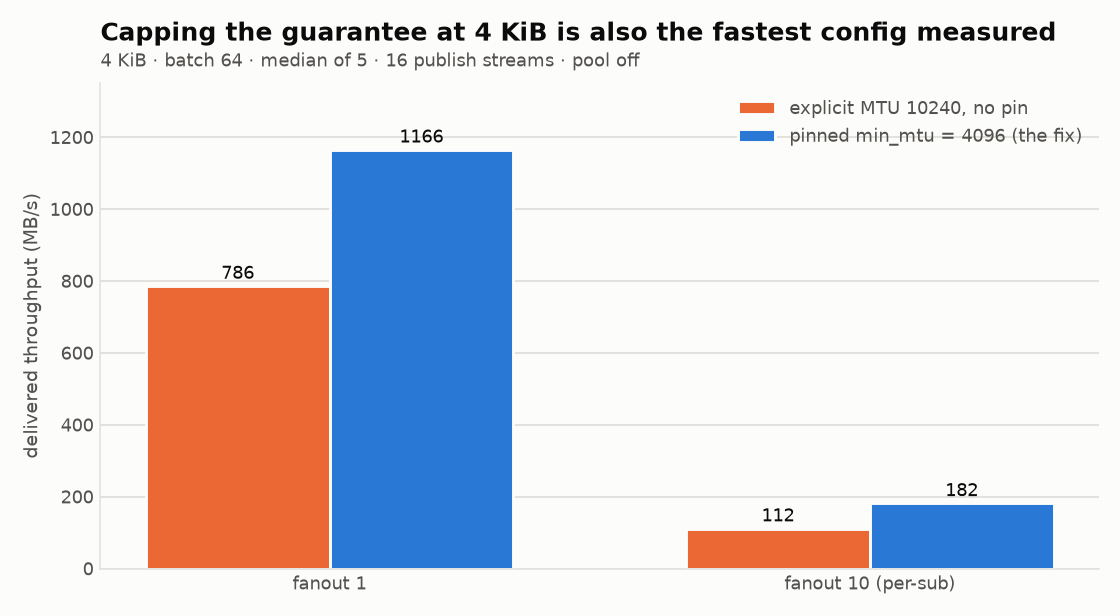
1.17 GB/s is 2.3x macOS's post-fix 508 MB/s at the same shape. Note the pin is worth far more than the same initial MTU without it (4096 unpinned measured 513 MB/s): pinning also freezes the discovery bound, so no probe traffic and no black-hole verdict ever runs.
Recommended change: cap the loopback guarantee in loopback_initial_mtu
at 4096 on non-macOS. macOS keeps 16336, where it is measured good over
hundreds of runs — but macOS should be re-measured at 4096 before assuming
16336 is still its optimum there.
Why 4096 rather than the exact 6553 the constraint allows: MAX_TRANSMIT_SEGMENTS
is private to quinn, so the bound cannot be derived through its public API.
Deriving it from max_gso_segments() instead does not work either — that is 64
on Linux, and 65535 / 64 = 1023, below QUIC's 1200 floor. 4096 is the value
that keeps margin: it survives the segment count rising to 15, where 6553 breaks
the moment it moves at all. The invariant is a comment, and no test can catch a
regression in it, so the margin is doing real work.
Better, once it can be measured: disable segmentation offload on this path
(TransportConfig::enable_segmentation_offload(false)) and keep the full 16336.
That reproduces macOS's proven configuration exactly — no GSO, jumbo datagrams —
and removes the 64 KiB constraint rather than dodging it. On loopback, GSO's
syscall amortisation is worth little when each datagram is already 16 KiB. It
needs a tuned Linux host to validate before shipping.
The existing unit test only exercises the gate arithmetic and runs no traffic, so nothing in the suite could have caught this. A regression test needs to be a sustained batch run, not a config assertion.
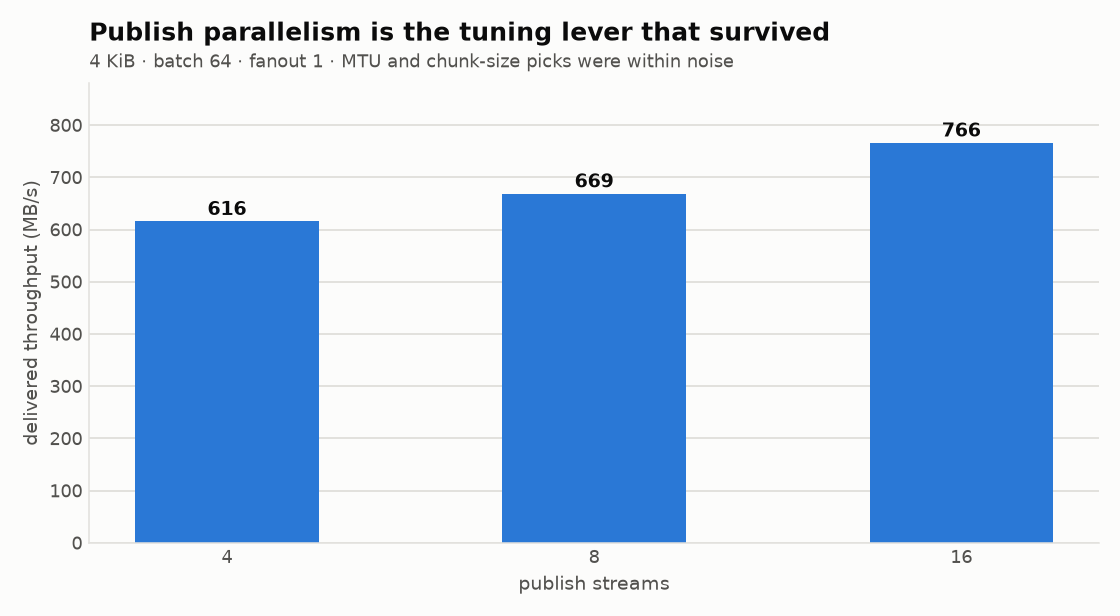
Greedy stage-wise sweep, 3 trials per point, 4 KiB / batch 64 / fanout 1:
-
Publish parallelism is the one real lever: 616 -> 669 -> 766 MB/s across 4, 8, 16 publish streams. Clean and monotonic; it is where the 8 physical cores show up.
-
MTU and chunk-size picks are within noise. Stage A read 512/515/518/616/527 across 4096–12288 — the 10240 "winner" is an isolated spike between two ~520 neighbours. Chunk size likewise (515/615/413/520). A greedy search with 3 trials locks onto noise peaks and carries them forward.
-
FELIX_EVENT_BATCH_MAX_DELAY_USdoes nothing here: 807.6 / 808.8 / 811.3 MB/s at 50 / 250 / 1000 µs.
Single host, 8 physical cores, one session. The macOS reference is an M4 Max, so the 2.3x is not a like-for-like core count. The numbers are loopback with broker and clients on one box. Nothing here has been re-run after a fix, because no fix has been written yet.
All uncommitted. Grouped by what would make sensible commits.
Transport (crates/felix-transport/src/lib.rs)
-
EndpointRole: server endpoints get a runtime each, client endpoints share one. Replaces round-robin assignment (round 12). - Default I/O pool size available-parallelism → 2.
- Debug log of endpoint → runtime assignment (
felix_transport=debug). - Round 15: loopback peers connect/accept with
initial_mtu = min_mtu = 16336(skips discovery, makes MTU black-hole verdicts a no-op); initial congestion window scaled per RFC 9002 when the initial MTU exceeds quinn's flat 14,720-byte default (which otherwise deadlocks the handshake);black_hole_cooldown60 s → 2 s withFELIX_MTU_BLACK_HOLE_COOLDOWN_MSoverride.
Client (crates/felix-client/)
-
client.rs:FELIX_CONN_STATS_MSpath-stats logger (client is the sender on the publish path, so its cwnd/rtt is invisible from broker stats). -
subscription.rs: subscription read task colocated viaspawn_pump. - The publisher writer is deliberately not colocated — it blocks in
write_alland starves the drivers it waits on (measured 5× worse). -
publisher.rs/wire/ack.rs: acked publishes are pipelined. The writer no longer awaits each broker ack inline (which capped acked throughput per stream at one request per RTT — ~9.4 K msg/s on loopback, ~20/s on a 50 ms WAN); it hands written requests to a per-stream ack-reader task that resolves them in order as acks arrive. Admission permits ride with the pending ack so the in-flight byte budget still reflects unacked data. Ack failure semantics unchanged: timeout, decode error, mismatched or error acks remain fatal for the worker and fail queued requests. Regression testacked_publishes_pipeline_without_waiting_per_ackdeadlocks (10 s timeout) against the inline-wait implementation and passes in milliseconds with pipelining.
Broker (services/broker/)
-
conn.rs:FELIX_CONN_STATS_MSnow logscwndandrtt. -
subscribe/lane.rs: per-connection delivery writer colocated viaspawn_pump. -
streams/tests.rs:publish_sharding_preserves_stream_ordernow pins Block queue policies and collects the full received sequence before asserting, so a failure shows gap vs reorder vs contamination.
Perf tooling (scripts/perf/)
-
run_latency_matrix.py:session_idper invocation;effective_total()sizes throughput cases past the send window. -
normalize_and_aggregate.py:select_session(), latest-session default, reports excluded stale runs. -
make_charts.py: log y-axis for message-rate charts, new_delivered_mb_per_schart, skip all-NaN figures. -
presets.yml/ci_subset_throughput.yml: documentedmin_run_bytes/max_total.
Demo (demos/broker/latency_demo.rs)
- Subscriber timeout, stream error or early close now fails the run with context instead of abandoning remaining events.
-
droppedrenamedunaccounted(expected - observed, not a drop counter); a non-zero value printssanity: INVALID RUN. -
throughput_total(payload, fanout): window floor when affordable, delivered- message cap otherwise. - Undersized-run warning, skipped for empty payloads.
- Batched runs print
queueing delay (NOT per-message latency ...)instead of a barep50 =. - Removed the redundant
FELIX_IO_RUNTIME_THREADS=2pin (now the default).
Docs
-
benchmarks.md: post-fix latency table, clean throughput table with the spread column, two latency charts, methodology sections on the send-window rule and session isolation; old cross-platform tables demoted and marked pre-fix. -
performance-case-study.md(new, in the docs site): the narrative version. -
internals-concurrency.md: "The QUIC I/O runtime" section. - Animated Mermaid diagrams restored from a stash and extended
(
how-felix-works,getting-started/overview,internals-subscribe,performance.md, durable-storage);group-commit.svgwired in. -
environment-variables.md:FELIX_IO_RUNTIME_THREADS,FELIX_ACK_ELICITING_THRESHOLD,FELIX_ACK_FREQ_DISABLE,FELIX_CONN_STATS_MS.
Not done
- Cross-page number cleanup.
quic-transport.mdstill claims connection throughput "scales nearly linearly" with a table (150K → 3.2M msg/s) that was never measured and that round 6 contradicted pre-fix;pubsub.mdhas an unsourced fanout table including a fanout-1000 row that has never been benchmarked;system-design.mdsays 10k–50k msg/s, two orders of magnitude below every other page;what-felix-is-for.mdquotes buffer-absorbed figures without the caveat its source page now carries.
Reproduced first: 5/16 fresh-process runs at ~21–24 K msg/s against a ~118–120 K fast mode (4 KiB, fanout 1, batch 64) — the round-13/14 residual, alive and well.
The standing theory was a park/wake lockstep between the two I/O runtime
threads. Tested directly: a bounded busy-wait in on_thread_park on the I/O
runtimes (so a thread about to park stays runnable through the inter-datagram
gap, turning cross-thread wakes into flag checks). Result: slow-run rate
unchanged at every spin length (2/12 at 0 µs, ~3/16 at 100 µs, 5/12 at
500 µs) — and the 100 µs run introduced new intermediate modes, because in
tokio the parked worker is what polls the I/O driver, so spinning before the
park delays datagram receipt. Wrong theory, and the instrument perturbed the
system. Removed entirely.
FELIX_CONN_STATS_MS=250 on a fast and a slow run, busiest connection (the
client publish connection carrying all traffic), final stats:
| fast | slow | |
|---|---|---|
| MTU at end of run | 16354 | 1200 |
| UDP datagrams for ~230–260 MB | 14,278 | 166,580 |
| bytes per datagram | 15,744 | 1,549 |
| lost packets | 0 | 674 (one burst) |
Timeline of the slow run's publish connection:
t=0.25s  mtu=8792   cwnd=17584     rtt=1.9ms   lost=0     (discovery in progress)
t=0.50s  mtu=16354  cwnd=15.3MB    rtt=13.2ms  lost=0     (discovery SUCCEEDED)
t=0.75s  mtu=1200   cwnd=9.9MB     rtt=2.9ms   lost=674   (collapse)
t=1.5s   mtu=1200   ...            ...         lost=674   (stuck; no further loss)
t=3.0s   mtu=1200   ...            ...         lost=674   (stuck until run ends)
Path-MTU discovery succeeds, then a single ~674-packet loss burst drops the MTU back to 1200 for the rest of the run. At 1200 instead of 16354 the same byte stream costs ~13.6× the datagrams — and each datagram carries a syscall and a wakeup chain, which is precisely the 5.7× system time and 5.7× context switches per message round 12 measured. Every earlier observation fits: client-side (the client is the publish-path sender), broker stages unaffected, sticky from "startup" (the collapse lands in the first second, during the warmup ramp), and worse under background CPU load (see below). Round 2's "80.3 MB/s anomaly with MTU collapsed to 1200 and 649 lost packets" — recorded once, not reproduced, set aside — was this defect.
Round 12's "MTU reaches 16354 in both modes" check was made on a delivery connection; the collapse hits the publish connection carrying the offered load. The check was right and looked at the wrong connection.
-
The loss burst is congestive, not an MTU problem. The publish path's
standing queue (~6.5 MB: 4 MiB payload inflight plus overhead, visible as
the 13 ms loopback "RTT") sits within ~1.5 MB of the receiver's 8 MB UDP
socket buffer (
kern.ipc.maxsockbufcaps it there). A scheduling stall of a few ms on the draining side overflows the buffer and the kernel drops a window of packets. Background CPU load makes such stalls — and therefore the collapse — much more likely. If the ramp survives without a burst, steady state is loss-free (fast runs: 0 lost packets), hence bimodal. -
Quinn's black-hole detector cannot tell the difference. Every dropped
packet in the burst is full-MTU (that is what a saturated sender's traffic
looks like), which is exactly the "large packets vanish" signature the
detector looks for (
BLACK_HOLE_THRESHOLD= 3 suspicious bursts). Verdict: MTU black hole. The path MTU resets toinitial_mtu(1200) and MTU discovery enters a 60 s cooldown (black_hole_cooldowndefault). -
Recovery is starved by the load itself. Quinn only sends an MTU probe
when a
poll_transmitfinds nothing else to send (if buf.is_empty()inconnection/mod.rs). A backlogged publisher never has an empty transmit buffer, so after the cooldown no probe is ever sent. Verified: with the cooldown shortened to 2 s (A/B viaFELIX_MTU_BLACK_HOLE_COOLDOWN_MS), collapsed runs stayed at MTU 1200 for 2.7+ s past the collapse with zero probes and zero further losses, and the slow-run rate was unchanged (3/16 at 2 s vs 4/16 at 60 s). The collapse is sticky for the life of the load, not the cooldown.
The fix took three iterations, each of which taught something about quinn's MTU machinery; recorded because every intermediate state looked plausible and shipped alone would not have worked.
-
Initial MTU alone is not enough — the handshake deadlocks. Starting
loopback connections at
initial_mtu = 16336hit a second quinn surprise: the default initial congestion window is a flat 14,720 bytes (RFC 9002's constant, sized for ~1200-byte datagrams, not MTU-scaled) and quinn's send path reserves a full segment per datagram — so an initial MTU larger than the window blocks the very first packet on congestion control, forever. This also means a hand-setFELIX_INITIAL_MTU=16354had always been a deadlock. Fixed by scaling the window with RFC 9002's own formula (clamp(14720, 2×mtu, 10×mtu)= 32,672 at 16,336) whenever no explicitFELIX_INITIAL_CWNDis set and the MTU requires it. -
Initial MTU + window is still not enough — the collapse floor is
min_mtu. With connections starting and running at 16336, slow runs continued at the same ~30% rate, and the capture showed why: the busy publish connection began at 16336 and a loss burst still dropped it to 1200. Quinn's black-hole reset target isTransportConfig::min_mtu(default 1200), notinitial_mtu. Raising the start size alone changes nothing about the failure mode. -
The actual fix: guarantee the loopback MTU. For a loopback peer —
the one path where a 16 KiB datagram is guaranteed by construction — the
config variant sets both
initial_mtuandmin_mtuto 16336 (fits IPv4/IPv6 headers within the 16 KiB loopback interface MTU; capped byFELIX_MTU_UPPER_BOUND/FELIX_MAX_UDP_PAYLOAD). With the floor at 16336 a black-hole verdict has nothing to collapse to: congestive loss bursts remain ordinary congestion events and Cubic absorbs them. Applied on both sides:QuicClient::connectviaconnect_withandQuicServer::acceptviaaccept_with, whenever the peer address is loopback. An explicitFELIX_INITIAL_MTUdisables the special case.min_mtumust never be raised for a real network path. -
And pin the discovery bound, or quiet connections starve. With
initial_mtu = 16336but the probe bound still at 16384, MTUD probes for sizes that can never fit (16384 minus IP/UDP headers is less than the probe). A probe is full-MTU, bypasses the congestion check when sent, and counts against the window once in flight — so on a quiet connection at the two-segment initial window, the doomed probe → loss-detection → retransmit cycle starves every ordinary small send behind it ("blocked by congestion control" for tens of seconds). Busy connections never noticed (Cubic grows the window past caring), which is why the throughput sweeps missed it; a client test with a sparse request/ack exchange hung reliably. The loopback config therefore setsupper_bound = initial_mtu: the size is guaranteed, there is nothing to discover, no probe is ever sent. -
And gate the whole guarantee on the granted socket buffers. CI turned
up the converse failure: on stock Linux,
SO_RCVBUFis silently clamped tonet.core.rmem_max(~208 KB — about 26 jumbo datagrams of headroom against ~350 at MTU 1200), and sustained batch load overflowed it so badly that every CI throughput trial and the 4 KiB batch integration test timed out. Worse, the pinnedmin_mtuforbids the one thing that helps a tiny buffer: smaller datagrams. The guarantee now applies only when the socket's achieved send/receive buffers (read back post-bind — the configured size says nothing on Linux) hold at least 64 full-size datagrams (~1 MiB); below that, connections keep the stock RFC-safe path. macOS grants the requested 8 MiB and keeps the fast path; stock-limit Linux hosts fall back untilrmem_max/wmem_maxare raised.
Additionally, black_hole_cooldown drops 60 s → 2 s
(FELIX_MTU_BLACK_HOLE_COOLDOWN_MS) for non-loopback paths. It cannot rescue
a continuously backlogged sender (probe starvation, above), but for
intermittent load it turns a spurious collapse into a ≤2 s dent instead of a
60 s outage, at the cost of one loss-tolerant probe per cooldown on a genuine
black-hole path.
4 KiB × batch 64 × fanout 1, fresh process per run, same binary for both arms
(the reverted arm disables the loopback guarantee via FELIX_INITIAL_MTU=1200
and restores the stock cooldown):
| Arm | Slow runs | Median | Worst ÷ median |
|---|---|---|---|
| Baseline (before any of this round) | 5/16 at ~21–24 K | ~118 K msg/s | 5.6× |
| Fix active | 0/20 | ~122 K msg/s | 1.11× |
| Fix reverted via env | 5/16 at ~21–23 K | ~121 K msg/s | 5.7× |
The fix arm's 20 runs span 112.3–125.1 K msg/s. The fast mode itself gained ~3% from skipping the MTU discovery ramp.
The round-14 open item — reproduce on a standalone broker before chasing further — is answered by mechanism: the collapse requires overflowing the receiver's UDP socket buffer with full-MTU packets, which any sufficiently fast sender can do to any receiver on any high-MTU path; it was never a property of the in-process harness. Loopback deployments are now immune by construction; non-loopback paths degrade for ≤2 s per spurious verdict when their load has idle gaps, and a continuously saturated non-loopback sender remains exposed to probe starvation — a quinn behavior worth an upstream conversation.
Generated from docs/perf-investigation-throughput.md in the repository. That file is the source of truth; this page may be behind it.