Portfolio performance attribution, contribution, and ex-post risk analytics.
ppar compares a portfolio with a benchmark, explains active return by classification, and produces reviewable HTML tables and PNG charts. It runs locally and accepts vendor-neutral CSV files or Axys/APX exports.
ppar supports Python 3.11.9 through Python 3.14.
ppar is available under a 45-day, single-user internal evaluation license.
Production, commercial, multi-user, or continued use requires a separate agreement;
contact jjjkreynolds@gmail.com. Review the license before installing.
python -m pip install pparThen choose one demonstration.
Vendor-neutral (the default):
ppar setup ./my_ppar
python ./my_ppar/ppar_demo.py
Axys/APX:
ppar setup ./my_ppar --axys-apx
python ./my_ppar/ppar_demo.py
Either setup command creates a demonstration directory:
my_ppar/
  README.md
  ppar_demo.py
  input/
  output/
The extensively commented ppar_demo.py is both a tutorial and the executable
workflow. Edit its Python values to choose input paths, calculation assumptions, and
reports, then replace the demonstration files under input/ with your data.
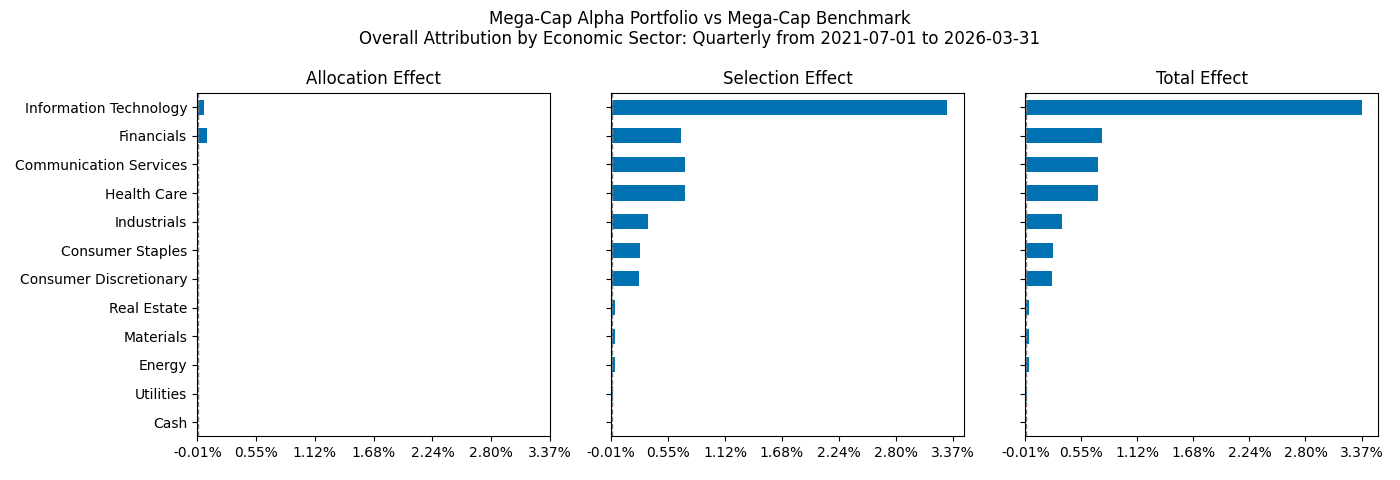
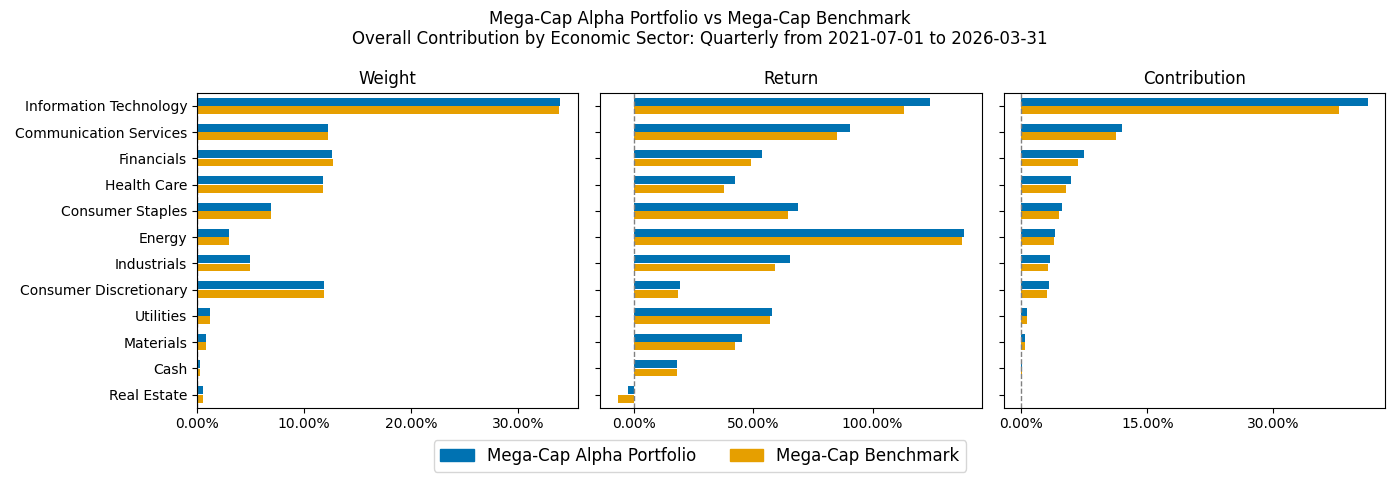
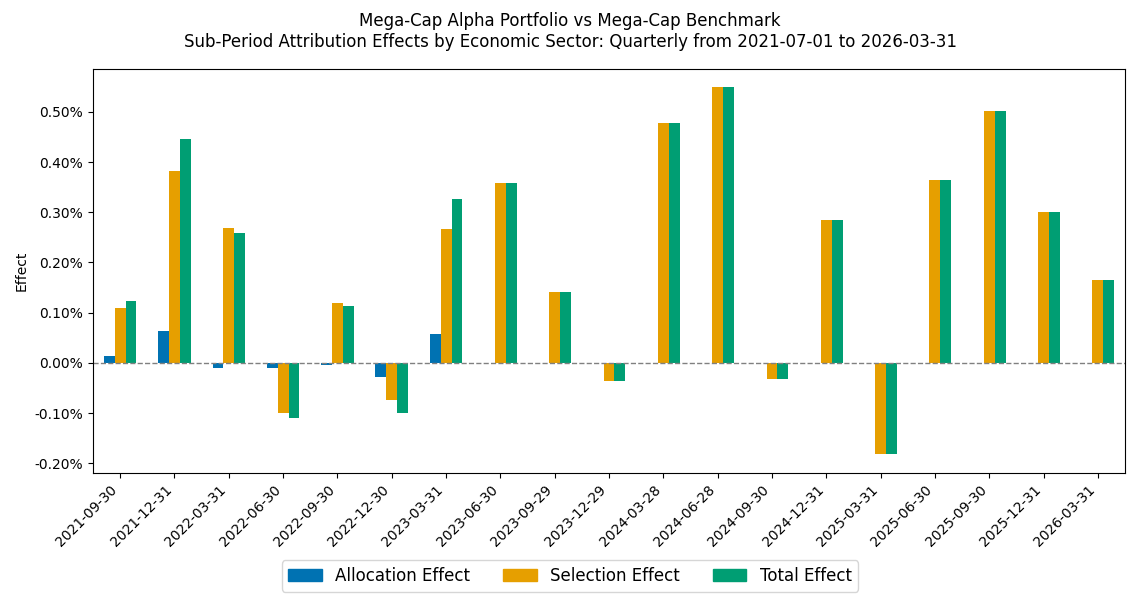
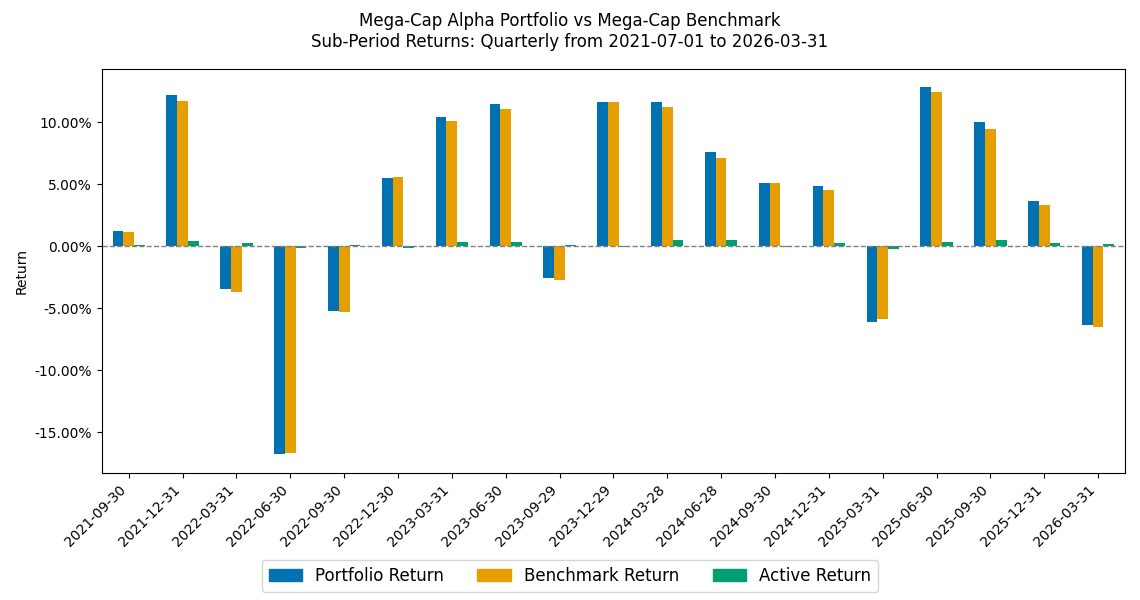
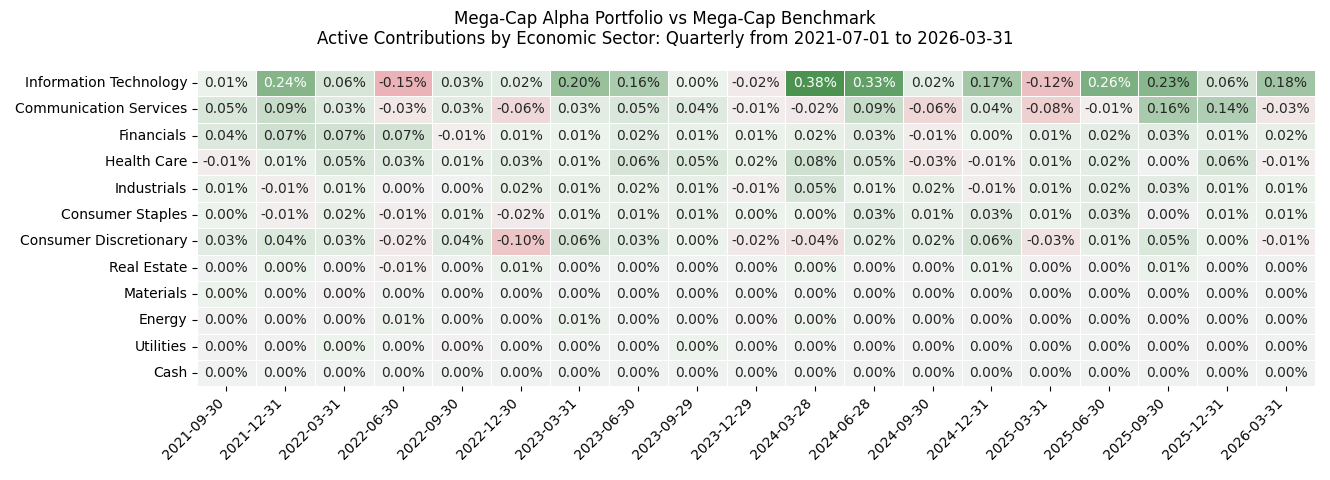
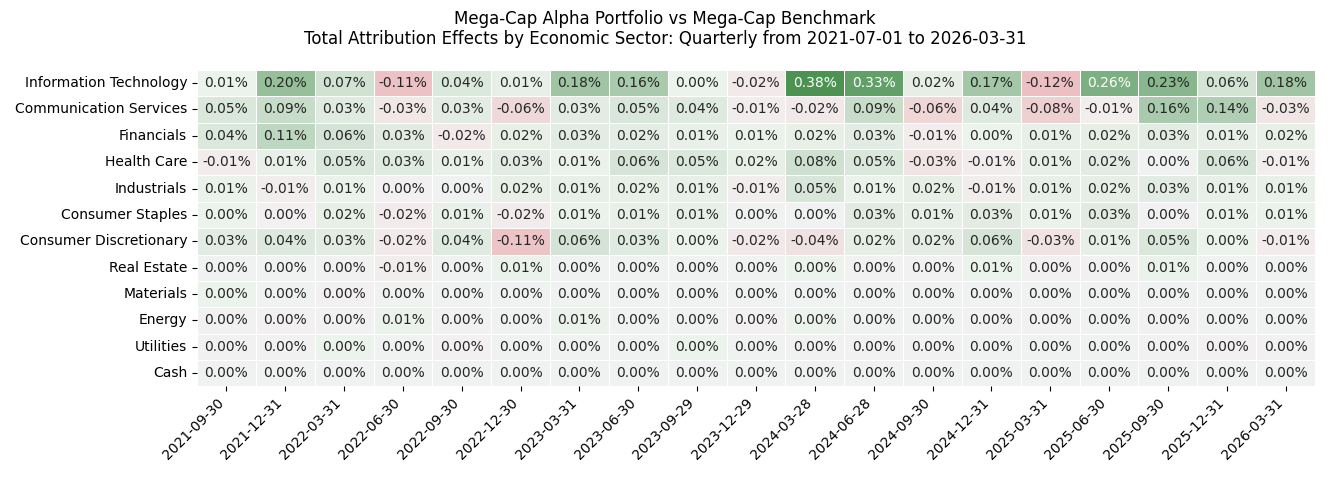
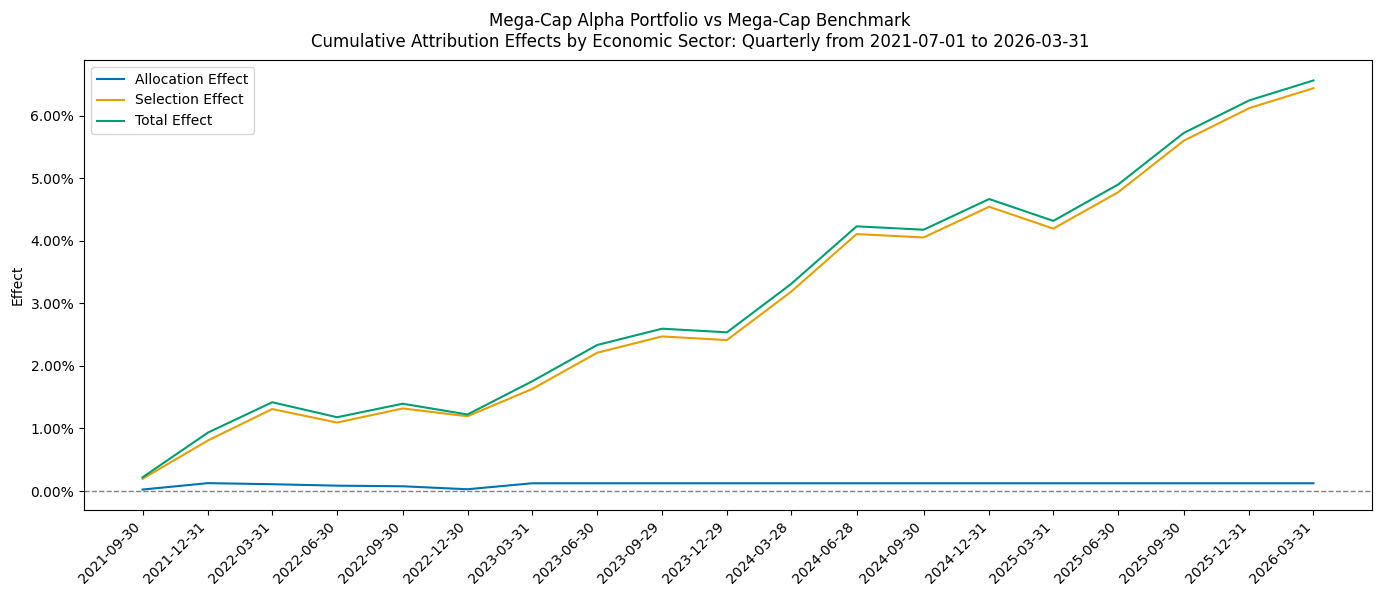
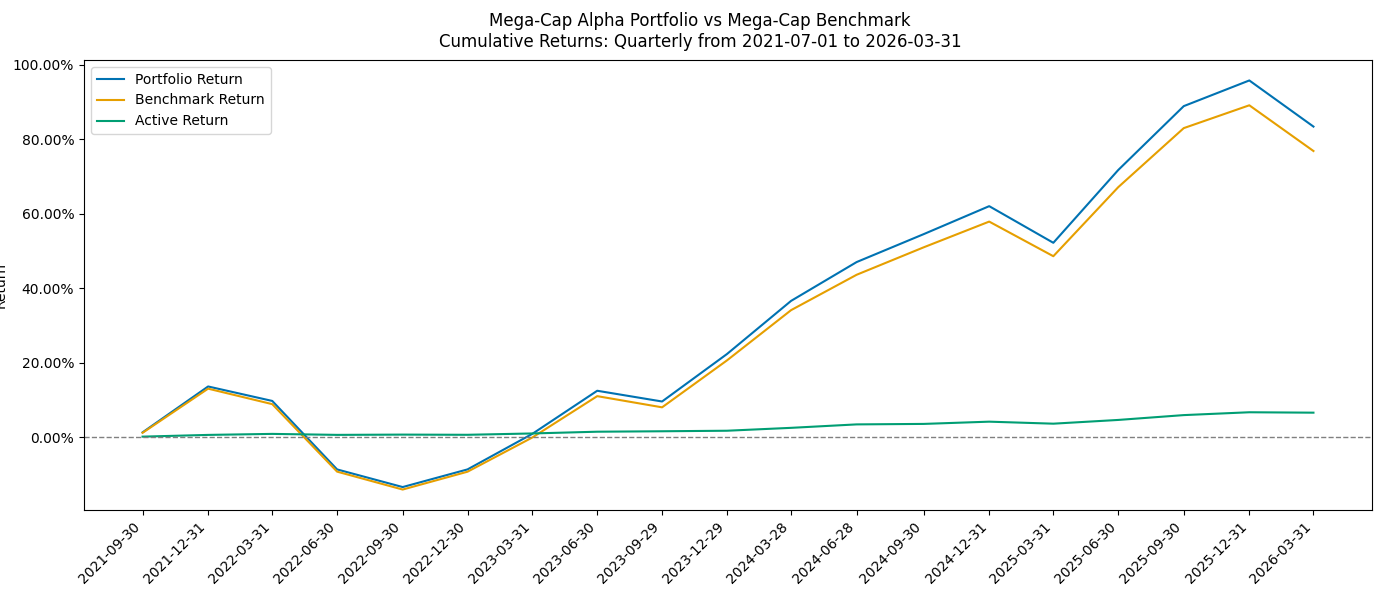
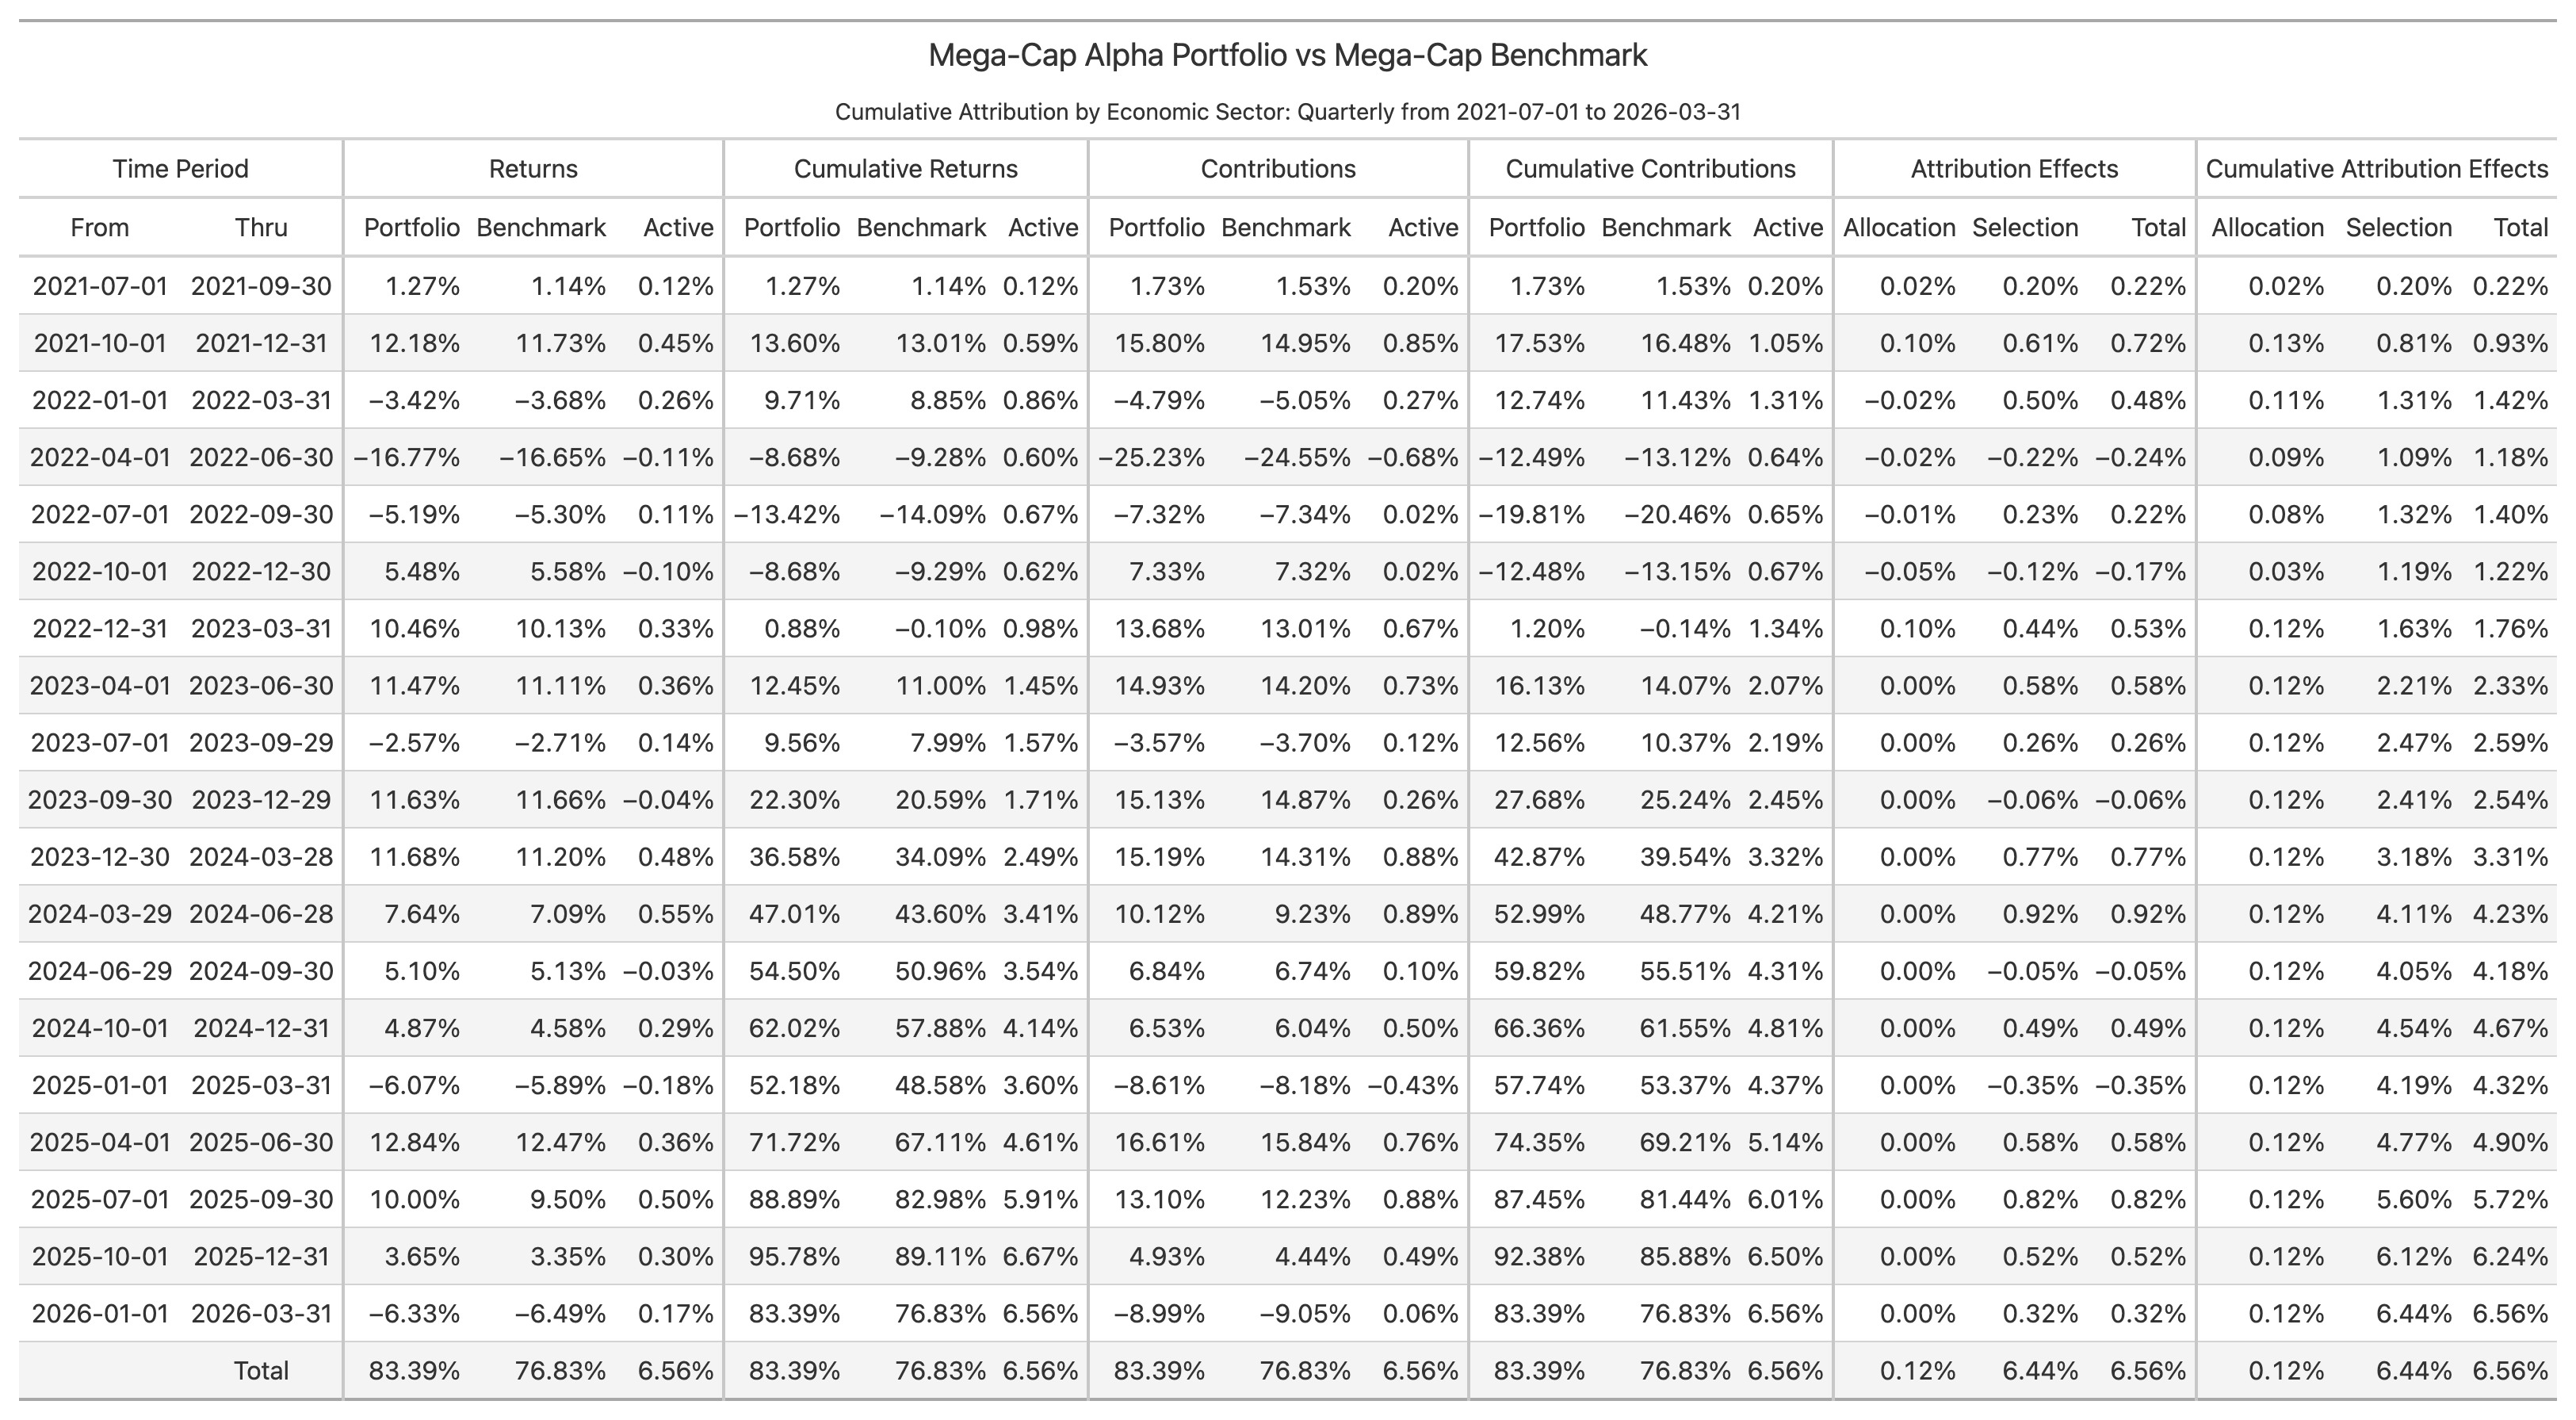
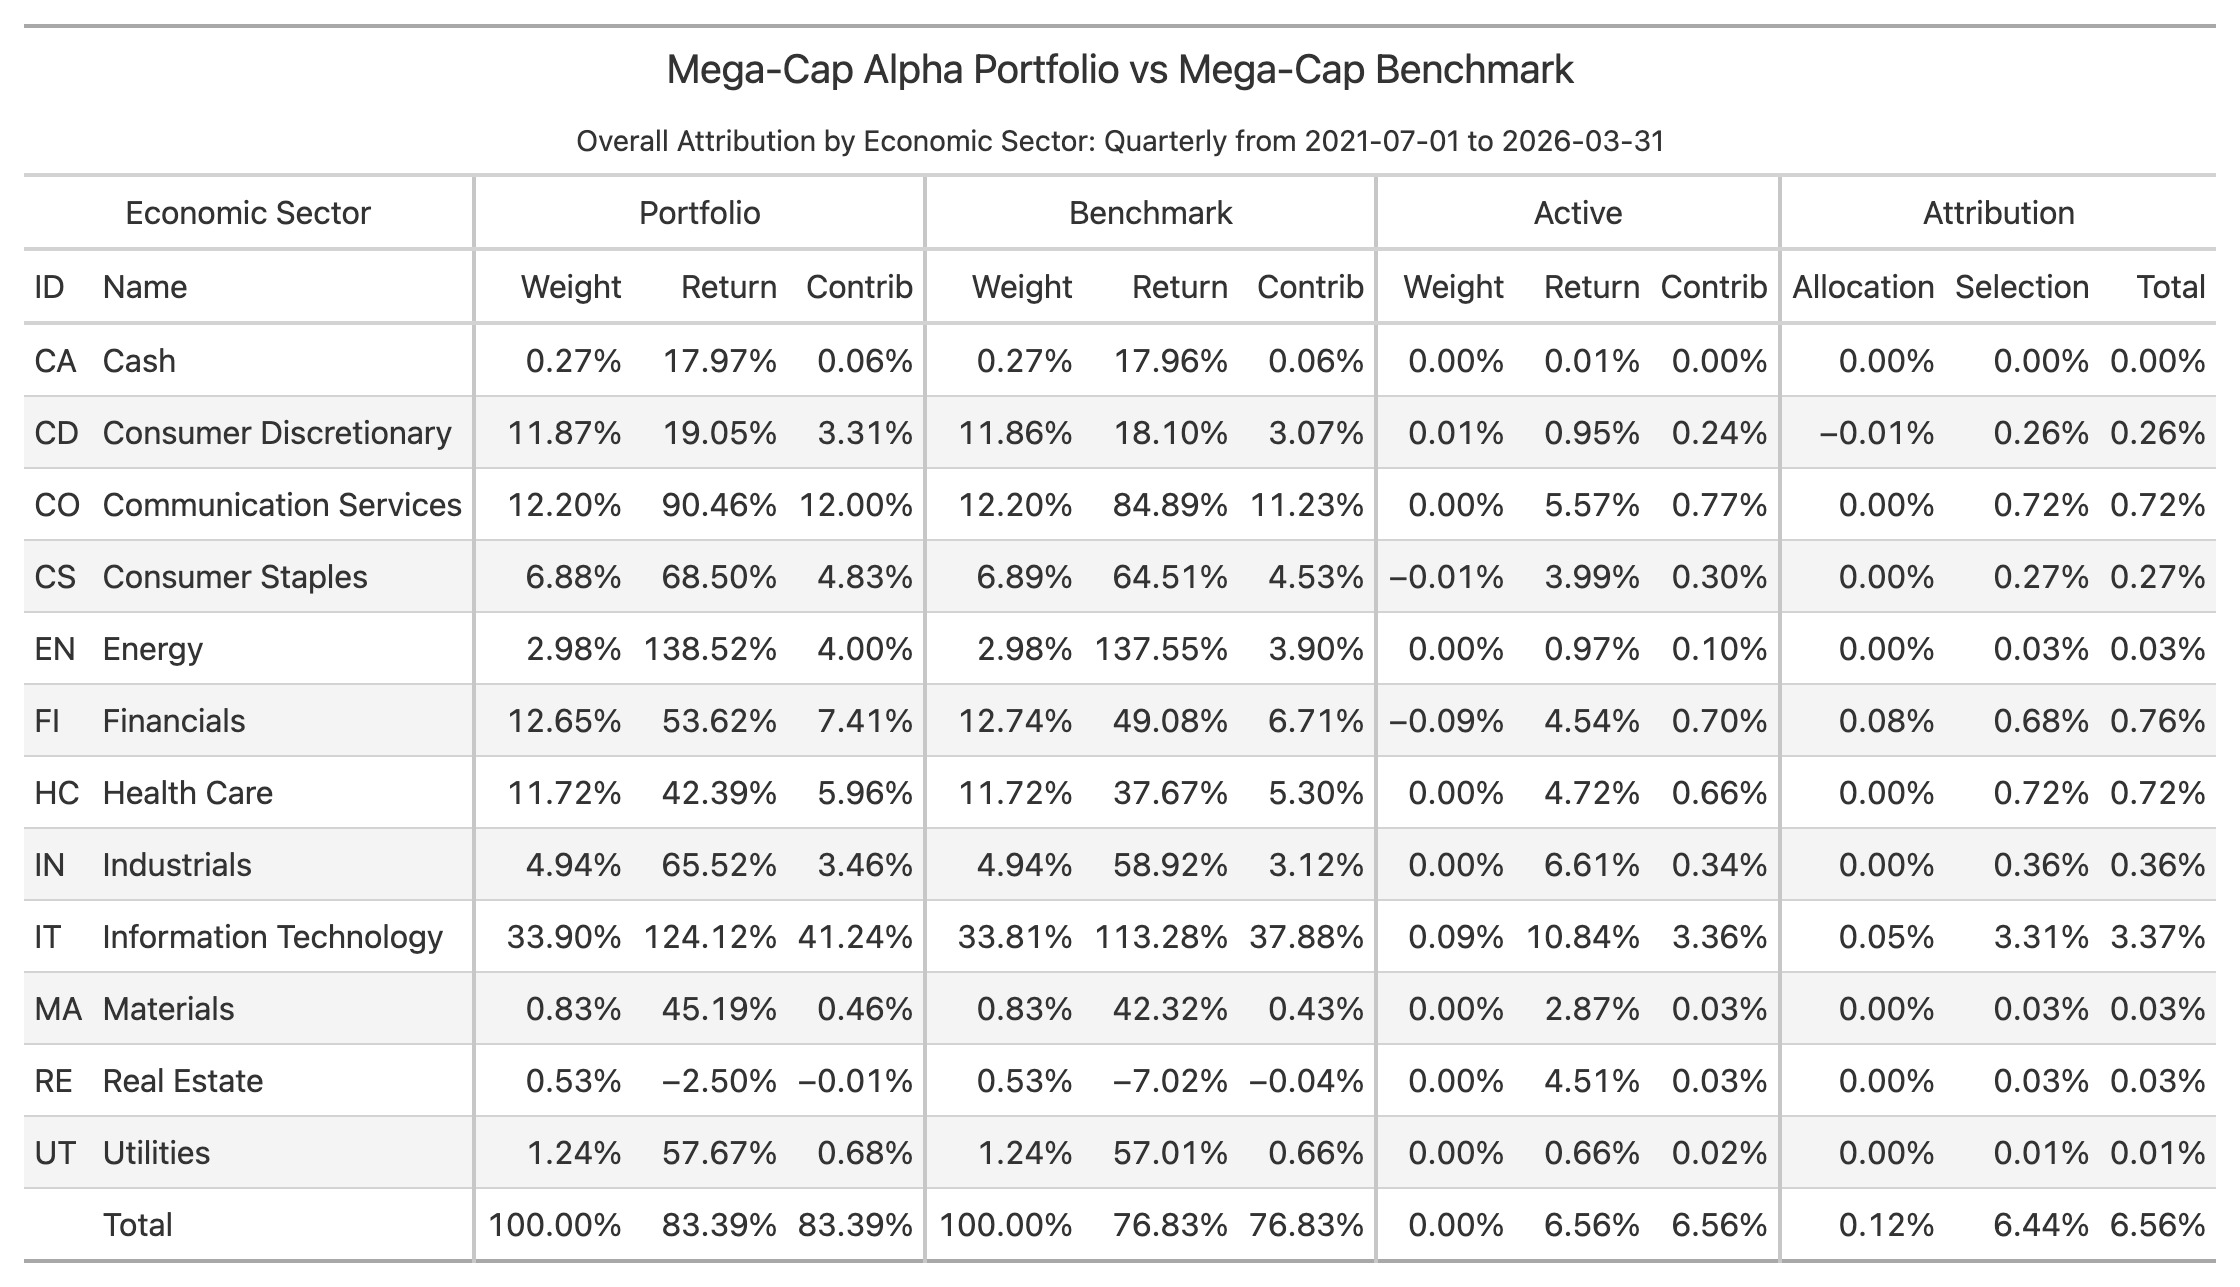
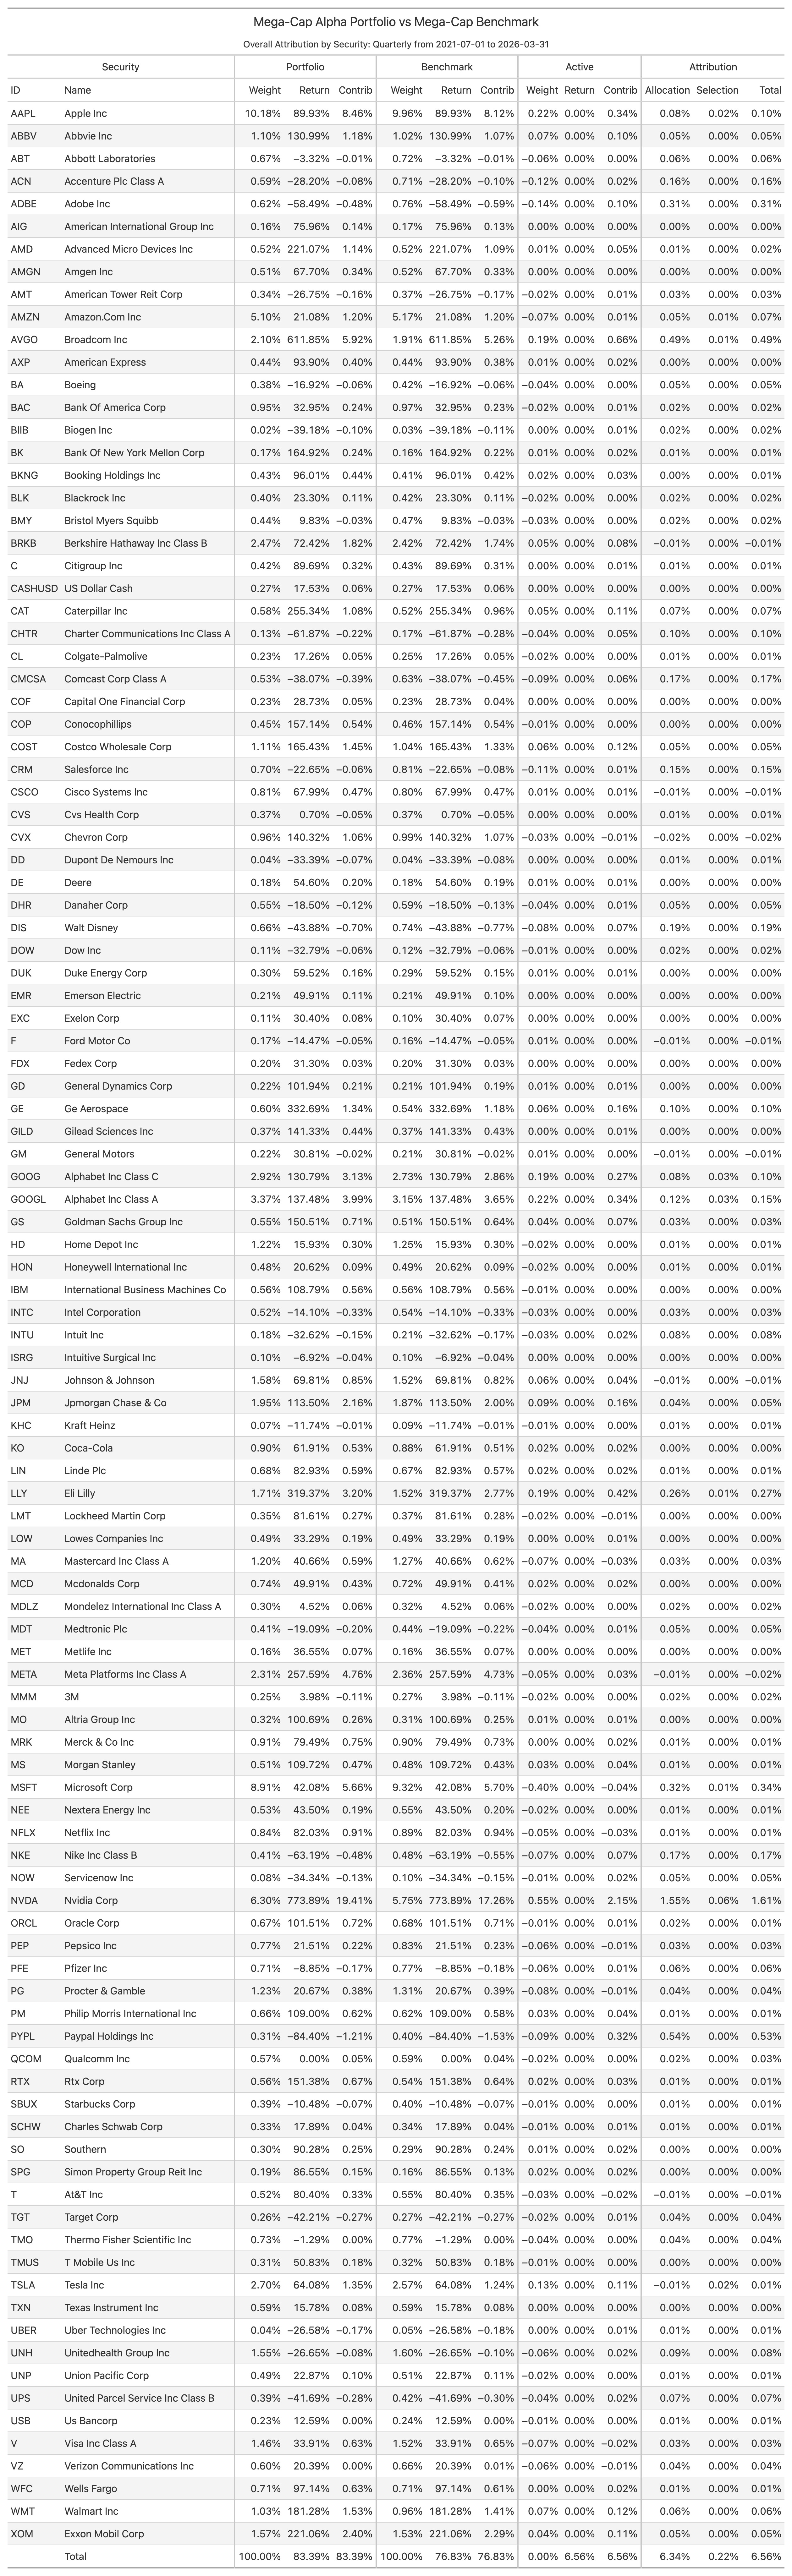
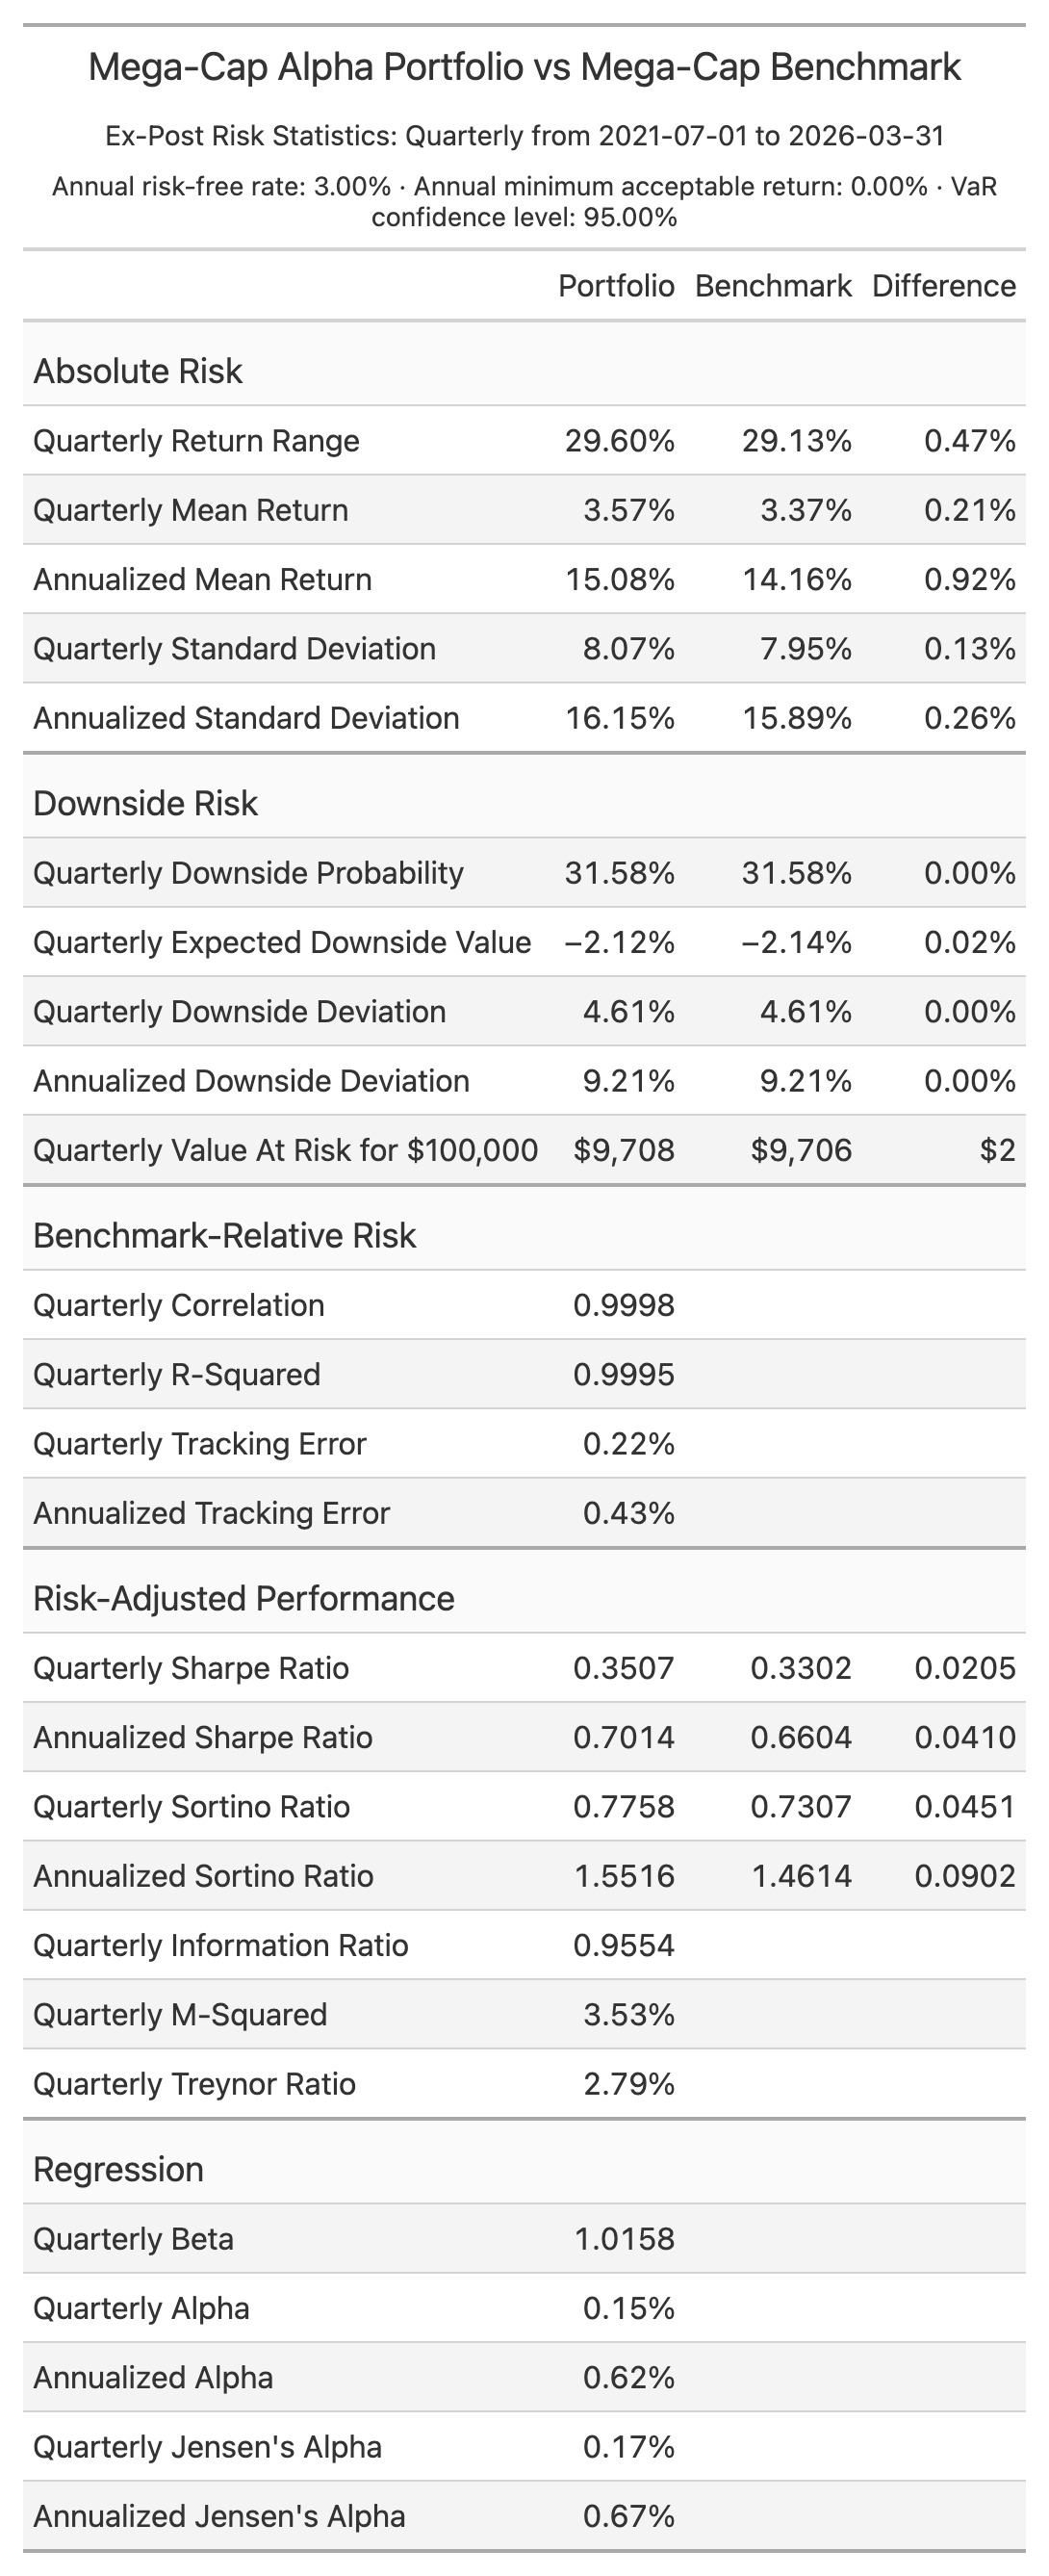
The standard demonstration writes security and classification attribution tables, attribution and contribution charts, cumulative return charts, heatmaps, and an ex-post risk-statistics table.
The gallery below shows examples of available output, including reports that can be
selected by editing ppar_demo.py.
This prints up to ten of the largest overall attribution effects as decimals:
from pathlib import Path

import polars as pl

from ppar import Analytics
from ppar.attribution import View

# Use the performance files created by: ppar setup ./my_ppar
performance_input_directory = Path("./my_ppar") / "input" / "performance"

# The portfolio is the first file and the benchmark is the second.
analytics = Analytics(
    performance_input_directory / "Mega-Cap Alpha Portfolio.csv",
    performance_input_directory / "Mega-Cap Benchmark.csv",
)

# Calculate security-level attribution and return the overall results as a
# Polars DataFrame. Select the most useful introductory columns, then show the
# ten largest effects first.
largest_effects = (
    analytics.attribution()
    .to_polars(View.OVERALL_ATTRIBUTION)
    .select(
        "Classification_Name",
        "Portfolio_Weight",
        "Portfolio_Return",
        "Benchmark_Weight",
        "Benchmark_Return",
        "Active_Contribution_Smoothed",
        "Total_Effect_Smoothed",
    )
    .sort("Total_Effect_Smoothed", descending=True)
    .head(10)
)
# Widen the printed table so the column names remain readable.
with pl.Config(tbl_width_chars=160):
    print(largest_effects)
The generated ppar_demo.py is the complete reporting example. Results are available
as Polars DataFrames, HTML text, PNG bytes, or CSV files.
Downloading, installing, accessing, copying, or using ppar constitutes acceptance of the license.