Resource Usage Testing with Gen2 pipe_tasks
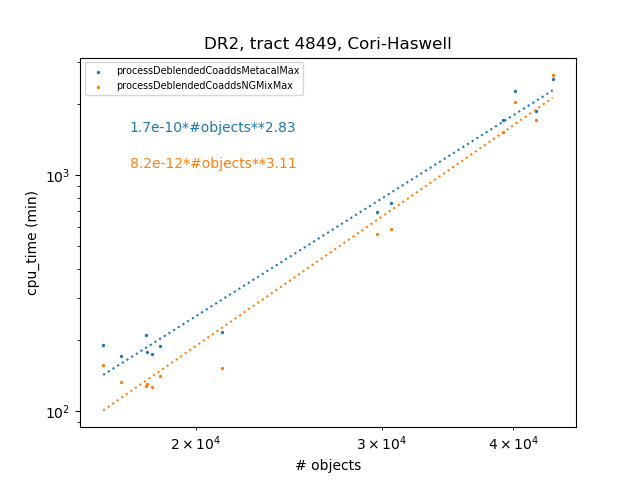
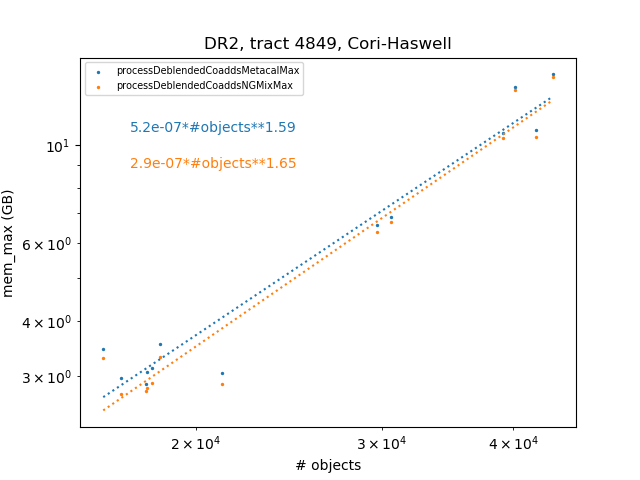
I've run the processDeblendedCoaddsMetacalMax.py and processDeblendedCoaddsNGMixMax.py tasks in the /opt/lsst/software/stack/meas_extensions_ngmix package in the shifter image lsstdesc/desc-drp-stack:v19-dc2-run2.2-v3 on the 13 complete patches for tract 4849. These patches have numbers of objects in the merged object catalogs ranging from ~16k to ~42k objects.
In the plots below, I've fit power-laws to the cpu time and maximum memory used as a function of number of objects for each of these two tasks:
I've run the coadd/multiband pipe tasks through measureCoaddDetections for a subset of patches in tract 4849. This tract overlaps the DDF and so has a range of exposure times across the tract. Here's the exptime_sum map showing the integrated exposure time as a function of location for the patches that were processed:
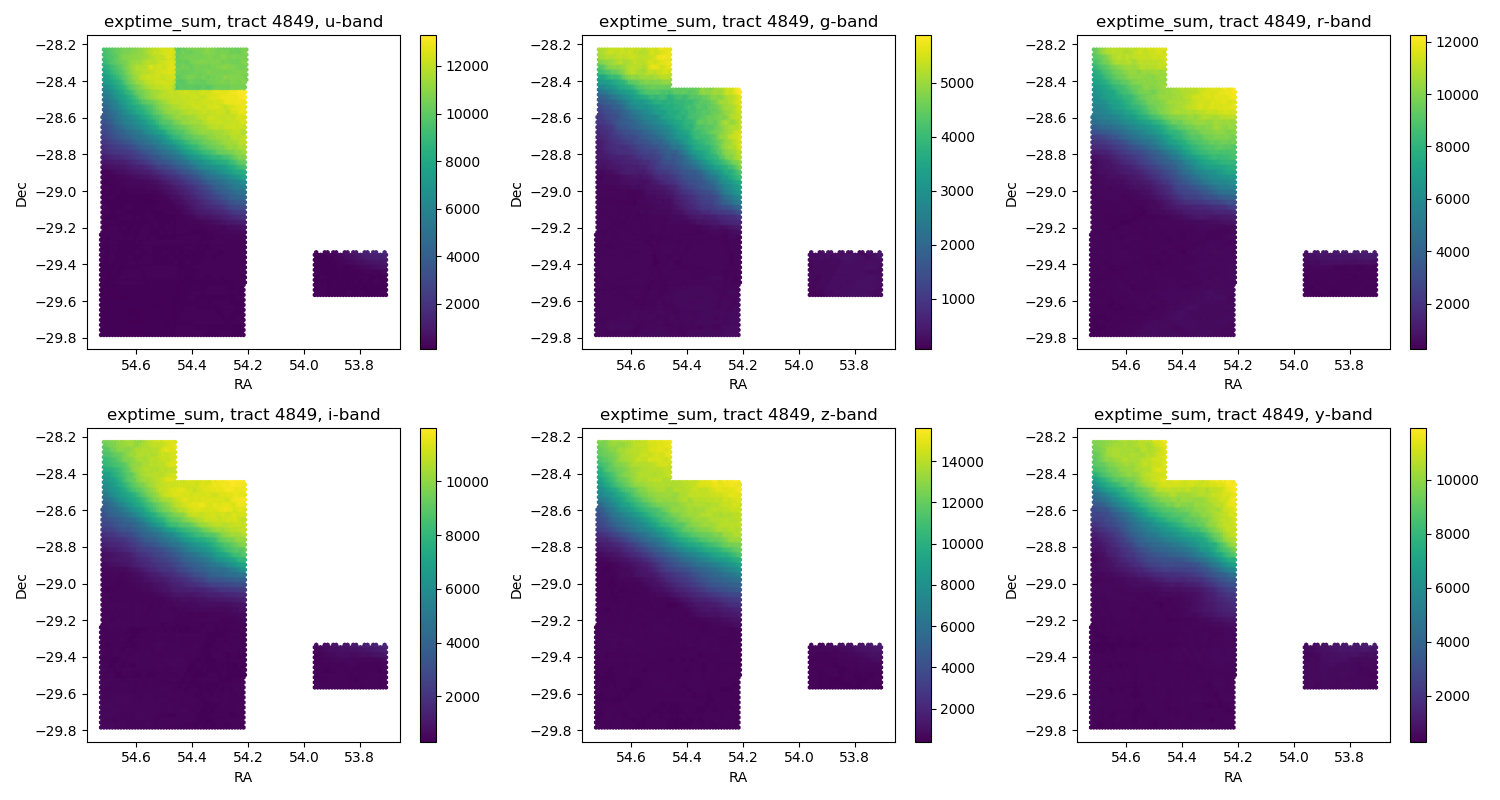 These data are for patches
 0,0 0,1 0,2 0,3 0,4 0,5 0,6 1,0 1,1 1,2 1,3 1,4 1,5 3,1 (1,6 was only partially processed for the u-band and was omitted from the results below.)
Here are tables of visits per patch and band:
         u    g    r    i    z    y                  u    g    r    i    z    y
0,0      8    7   24   20   25   19         4,0      8   10   16   21   21   23
0,1      7    7   21   19   27   18         4,1    109   42   88  154  153  147
0,2      9    9   29   24   28   20         4,2    371  185  345  387  487  407
0,3    108   49  126  108  149  108         4,3    481  220  434  443  567  448
0,4    355  113  306  320  421  266         4,4    484  221  437  440  569  447
0,5    458  166  391  420  519  412         4,5    483  222  438  439  571  446
0,6    473  214  432  436  563  445         4,6    483  221  439  439  572  446

1,0      7    9   26   21   23   18         5,0     15   12   21   22   31   23
1,1      8    8   25   21   24   19         5,1    196   66  158  207  284  169
1,2    112   60   92   52  111   65         5,2    468  198  401  417  560  419
1,3    320  163  279  274  368  277         5,3    483  219  436  445  567  447
1,4    457  204  385  416  534  411         5,4    484  220  435  443  571  448
1,5    483  216  439  439  563  445         5,5    483  221  438  442  571  448
1,6    483  219  436  440  568  447         5,6    483  222  441  440  572  450

2,0      7   11   25   18   22   20         6,0     14   14   20   28   42   23
2,1     12   11   42   34   30   24         6,1    219   86  208  218  296  163
2,2    183  112  187  156  180  155         6,2    449  211  437  427  547  414
2,3    454  211  386  419  514  420         6,3    483  220  438  446  569  447
2,4    478  219  427  440  567  444         6,4    483  221  438  441  571  447
2,5    485  219  439  439  569  446         6,5    483  221  441  442  573  447
2,6    485  220  438  439  568  447         6,6    483  222  441  439  574  448

3,0      8   12   22   21   23   22
3,1     72   25   63   72   69   69
3,2    275  148  269  302  337  293
3,3    480  216  427  421  552  430
3,4    485  220  438  439  570  445
3,5    484  219  439  438  570  446
3,6    484  220  438  438  568  447
Patch 0,6 has a comparable number of visits as the deepest parts of the tract and should be somewhat representative of the performance for the deeper patches, although there is a factor of two gradient in exposure time across that patch.
Here are figures of cpu time and maximum memory usage for the detectCoaddSources, deblendCoaddSources, and measureCoaddSources plotted versus nImage_mean.
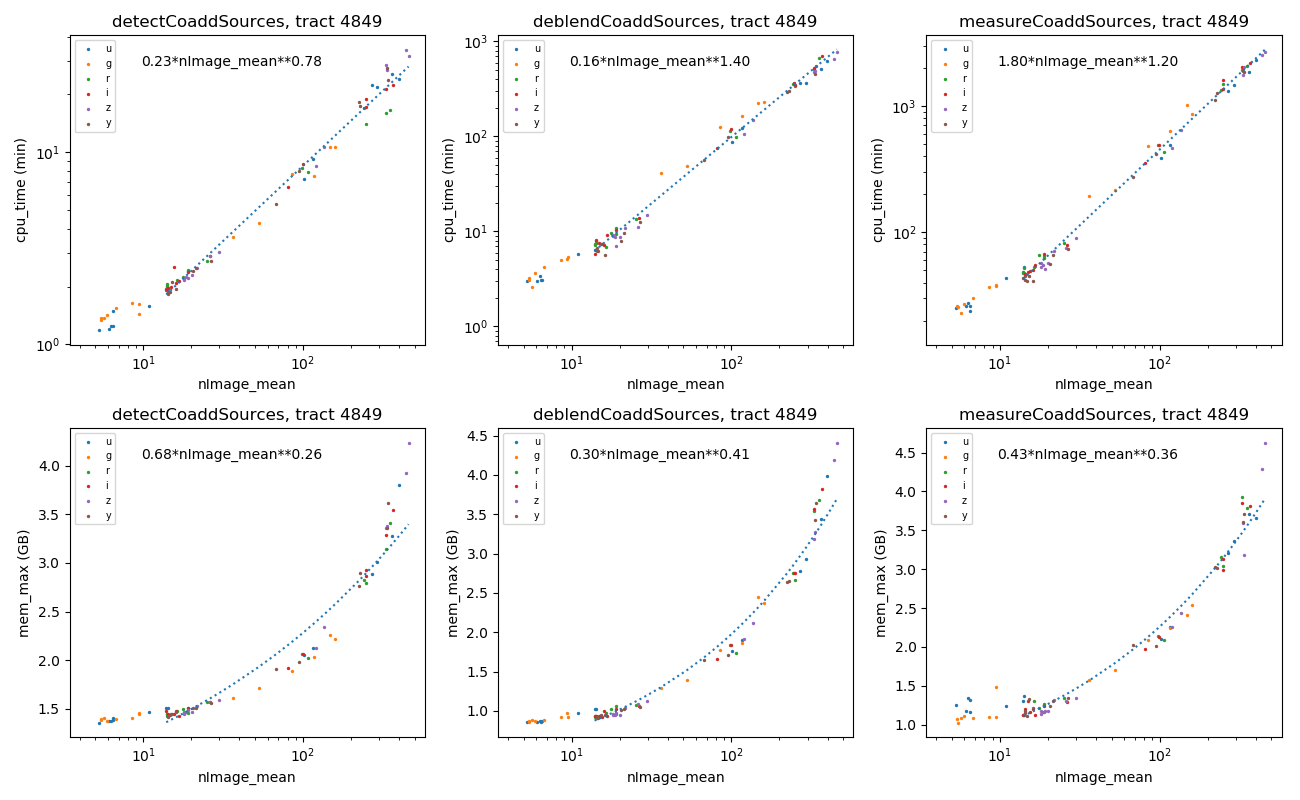
nImage_mean is the mean of the pixel values computed from the deepCoadd/{band}/4849/{patch}_nImage.fits files, which give the number of warped images that contribute to each pixel in the coadd image for that patch. The power-law fits to each dataset are meant to give some idea how cpu time and memory scale with image depth.
In this entry, I'm reporting on the coadd/multiband processing of the DC2 Run2.2i Y01 data for tract 3828.
I've run the individual pipe tasks underlying the coaddDriver.py and multibandDriver.py scripts at NERSC on Cori-Haswell in the interactive queue and gathered memory usage and runtime statistics. The scripts in PR #6 were used to parallelize the pipe task execution.
The numbers shown below are per patch for all pipe tasks except makeCoaddTempExp and assembleCoadd. For makeCoaddTempExp, the task can be trivially parallelized over filter-tract-patch-visit combinations, so the numbers below reflect that level of parallelization. For assembleCoadd, the runtimes are proportional to the number of visits being combined, so those numbers are divided by the number of visits.
pipe task                  mem_max  mem_avg   wall time (min)   cpu time (min)  avg #visits
                             (GB)    (GB)       max     avg       max     avg
makeCoaddTempExp        u     3.6     1.6       8.1     4.0       3.5     2.6       6.2
makeCoaddTempExp        g     3.6     1.4       6.0     3.3       3.3     2.0      10.1
makeCoaddTempExp        r     3.7     1.6       6.5     3.8       3.8     2.5      18.7
makeCoaddTempExp        i     3.7     1.6       6.4     4.0       4.2     2.6      23.6
makeCoaddTempExp        z     3.6     1.4       5.6     3.4       3.7     2.2      16.5
makeCoaddTempExp        y     3.7     1.5       8.0     3.7       4.2     2.4      17.1

assembleCoadd           u     1.2     0.6       1.9     1.5       0.5     0.5       6.2
assembleCoadd           g     1.2     0.6       1.5     1.2       0.5     0.4      10.1
assembleCoadd           r     1.4     0.6       1.7     1.4       0.4     0.4      18.7
assembleCoadd           i     1.5     0.6       2.0     1.6       0.4     0.4      23.6
assembleCoadd           z     1.3     0.6       2.3     1.9       0.4     0.4      16.5
assembleCoadd           y     1.4     0.6       2.3     1.8       0.4     0.4      17.1

detectCoaddSources      u     1.4     0.9       1.8     1.3       1.6     1.2       6.2
detectCoaddSources      g     1.4     0.9       2.1     1.7       2.0     1.6      10.1
detectCoaddSources      r     1.5     1.0       2.7     2.2       2.3     2.0      18.7
detectCoaddSources      i     1.5     1.0       3.2     2.5       2.8     2.3      23.6
detectCoaddSources      z     1.5     1.0       2.4     2.0       2.2     1.7      16.5
detectCoaddSources      y     1.5     1.0       2.5     1.8       2.2     1.7      17.1

mergeCoaddDetections          0.6     0.5       2.3     1.6       2.2     1.5

deblendCoaddSources     u     0.9     0.7       4.8     3.1       4.6     2.9       6.2
deblendCoaddSources     g     1.0     0.8       7.3     4.9       7.1     4.6      10.1
deblendCoaddSources     r     1.0     0.8      10.9     8.1      10.7     7.9      18.7
deblendCoaddSources     i     1.0     0.8      14.2    10.4      14.0    10.1      23.6
deblendCoaddSources     z     1.0     0.8       8.1     6.6       7.9     6.3      16.5
deblendCoaddSources     y     1.0     0.8       8.5     6.5       8.3     6.2      17.1

measureCoaddSources     u     1.4     1.0      34.3    25.5      34.1    25.1       6.2
measureCoaddSources     g     1.3     1.1      46.3    34.5      45.9    33.9      10.1
measureCoaddSources     r     1.4     1.1      67.7    53.1      67.1    52.2      18.7
measureCoaddSources     i     1.5     1.1      81.9    63.0      81.3    61.9      23.6
measureCoaddSources     z     1.6     1.1      51.1    44.2      50.4    43.4      16.5
measureCoaddSources     y     1.6     1.1      53.6    43.7      52.7    43.0      17.1

mergeCoaddMeasurements        1.4     0.3       3.7     3.0       0.6     0.6

forcedPhotCoadd         u     1.2     1.1      43.6    29.4      40.8    28.8       6.2
forcedPhotCoadd         g     1.2     1.1      63.6    40.0      60.4    39.4      10.1
forcedPhotCoadd         r     1.3     1.2      89.5    62.4      87.3    61.9      18.7
forcedPhotCoadd         i     1.3     1.2     109.4    76.8     106.9    76.2      23.6
forcedPhotCoadd         z     1.2     1.1      65.9    53.8      64.9    53.3      16.5
forcedPhotCoadd         y     1.2     1.1      76.5    54.9      73.3    54.4      17.1
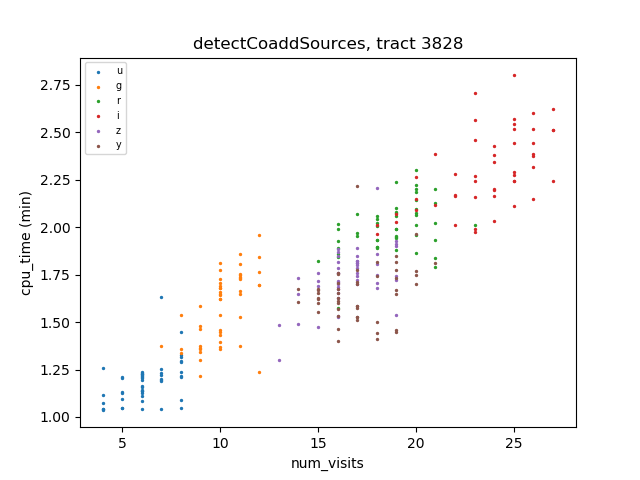
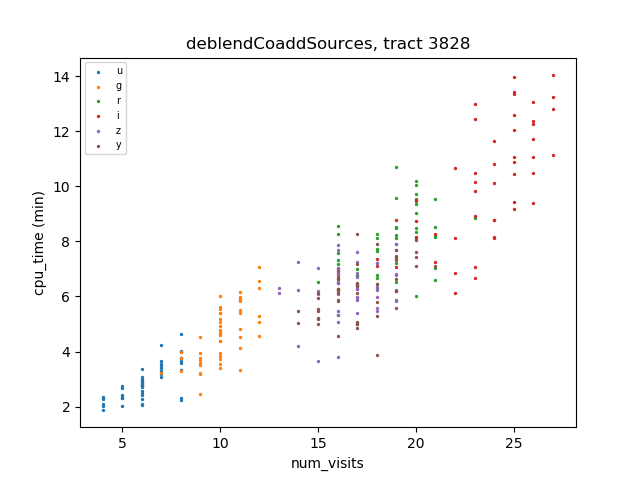
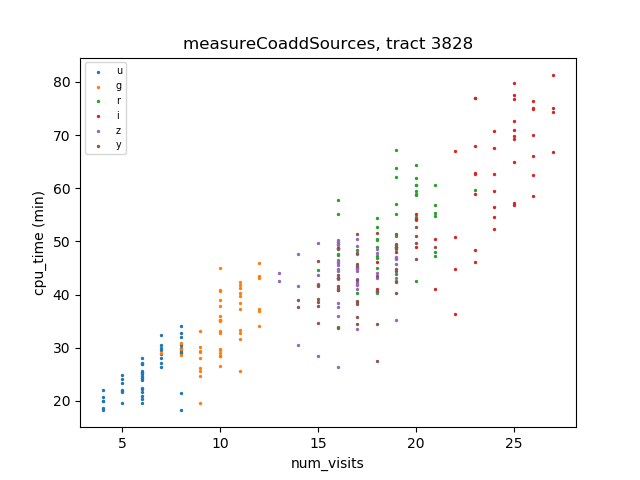
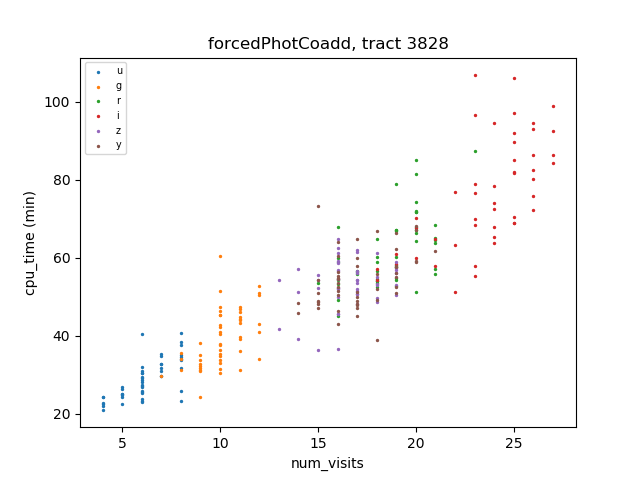
The detectCoaddSources, deblendCoaddSources, measureCoaddSources, and forcePhotCoadd pipe tasks will have runtimes that will roughly scale with the number of detections, and so those runtimes should also depend on the depth or number of visits in the coadd. Here are plots of CPU time vs number of visits for the 294 patch-band combinations (= 6 bands x 49 patches) for this tract:
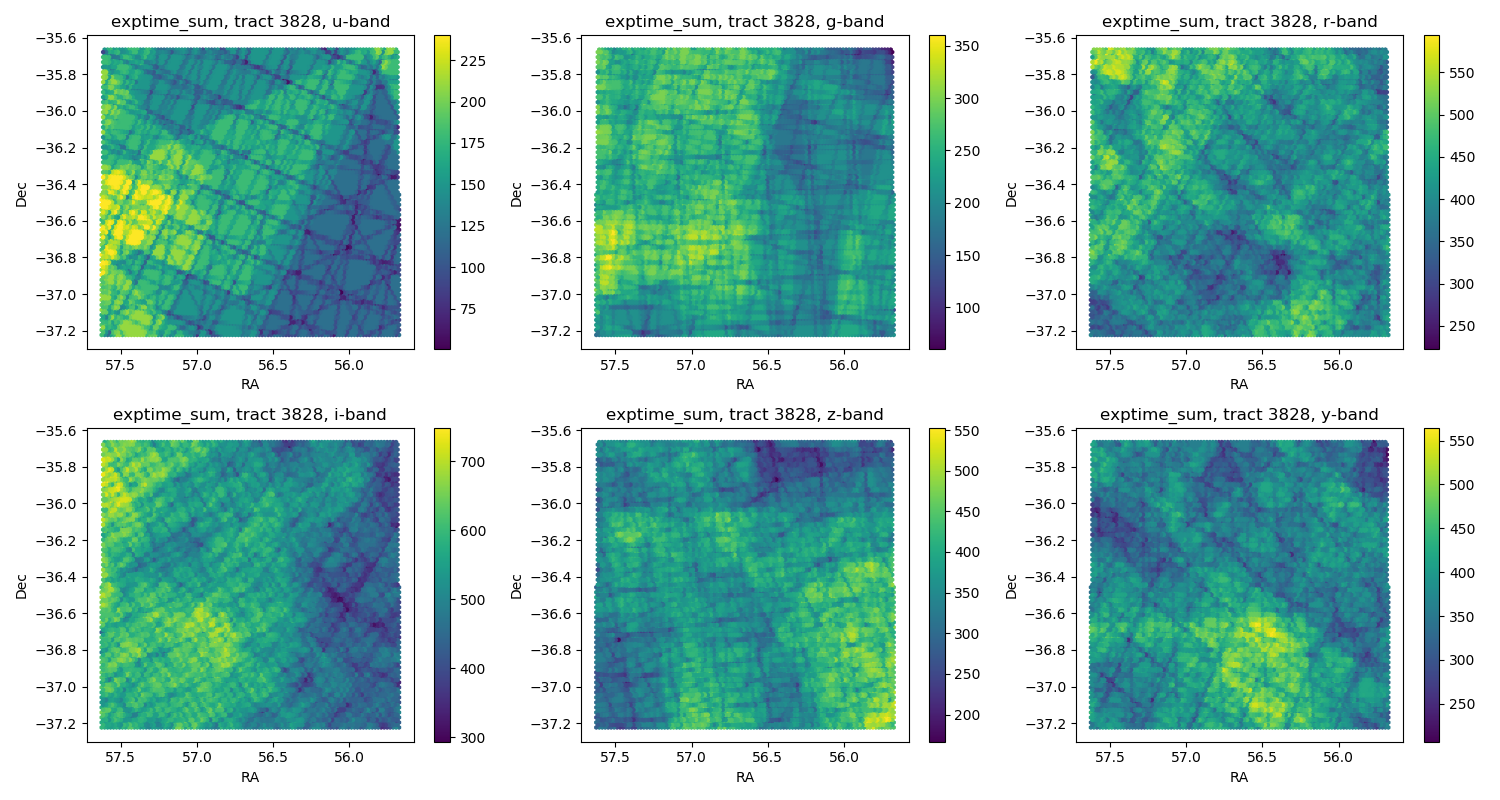
Here are exposure time maps for this tract (created with suprême):
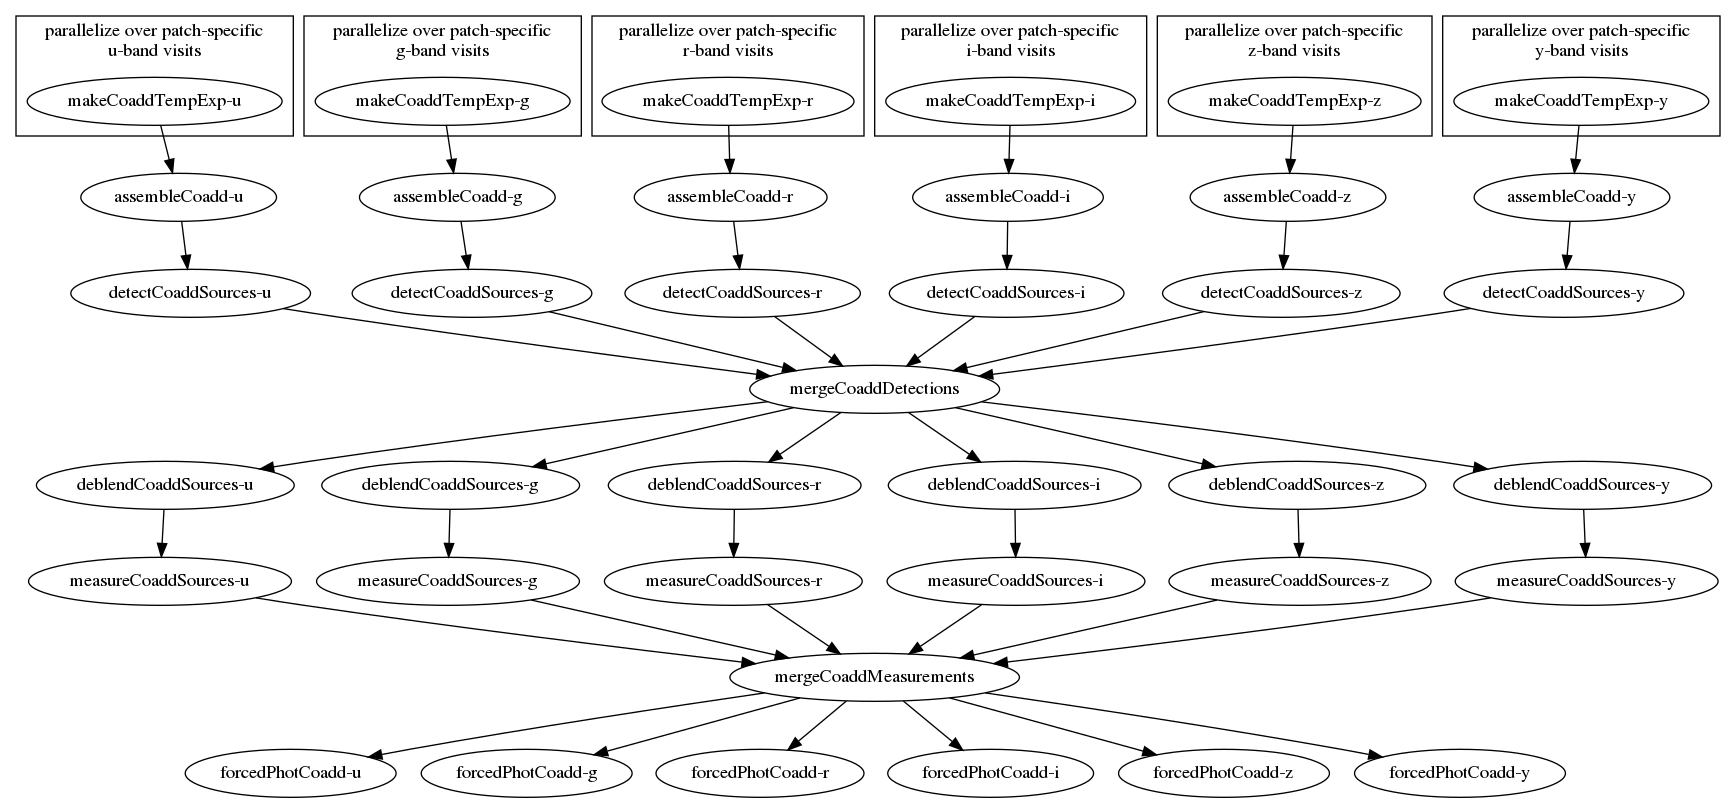
For the record, here is a DAG showing the dependencies between different pipe tasks in the coadd/multiband processing: