Repository navigation
Performance
Across 3,405 package versions, the unweighted means are 0.162 s elapsed and 30.0 MiB peak RSS.
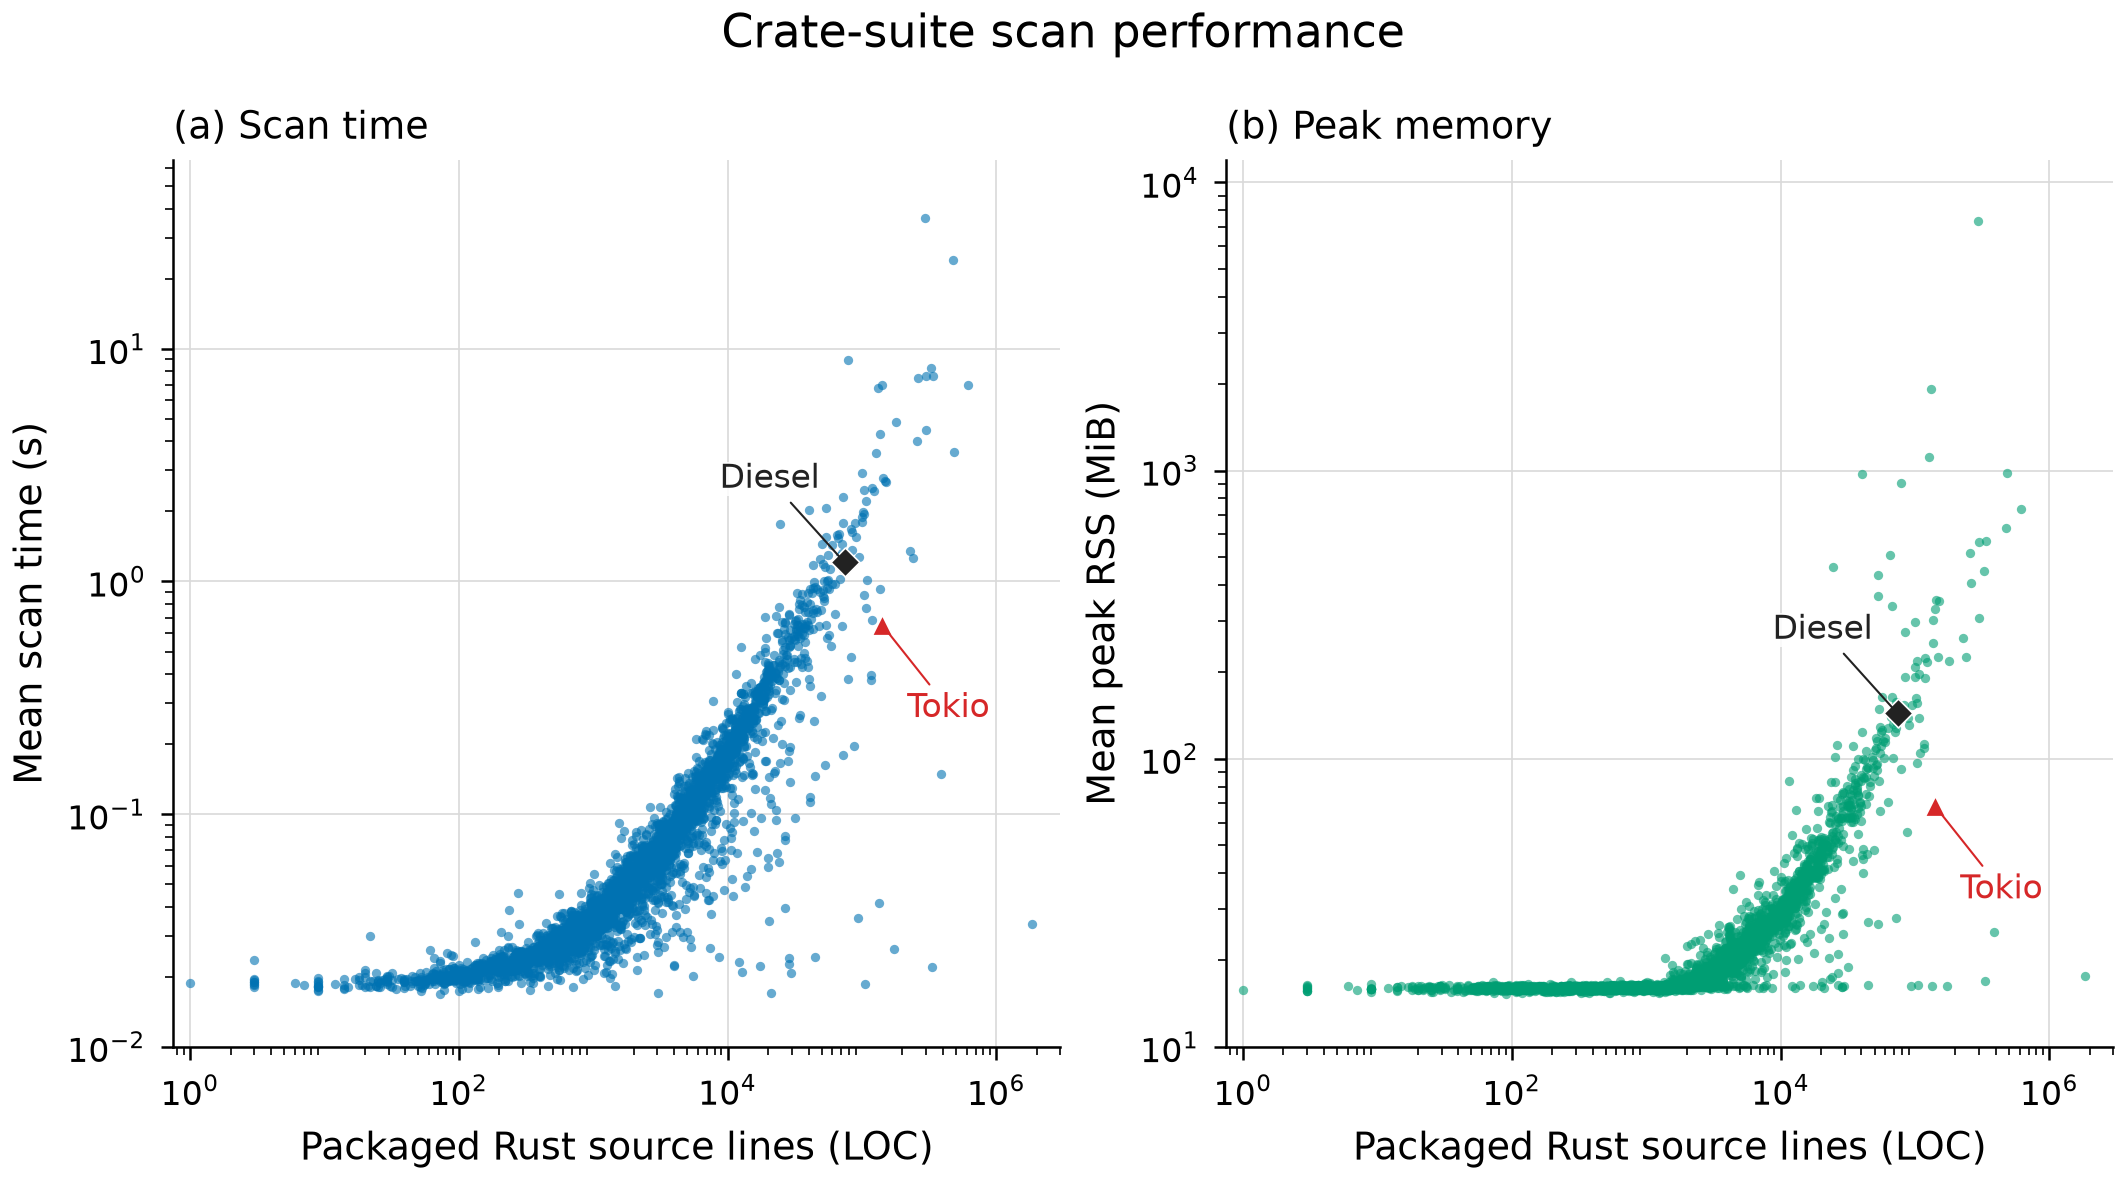
Each point averages three scans of one package version. Axes are logarithmic. dioxus-free-icons 0.10.0 averages 36.44 s and 7,324.7 MiB.
Red triangles highlight tokio 1.53.3, and black diamonds highlight diesel 2.3.14.
Scans use dejadoc at c11dfd804 with --functions --context-blocks --all-targets --json --no-fail on two logical CPUs of an AMD Threadripper PRO 5975WX. Runs are serial, with nice -n 10, an isolated CARGO_HOME and a populated offline registry.
Each batch is scanned in three permuted passes without clearing the operating-system cache.
LOC counts physical lines in packaged .rs files, including comments, tests and examples, excluding target, .git and symlinks. Some files lie outside scanned targets.
Elapsed time includes process launch, timing wrappers and cargo metadata, excluding compilation and installation. Peak RSS averages GNU time measurements across three runs without summing process-tree memory.
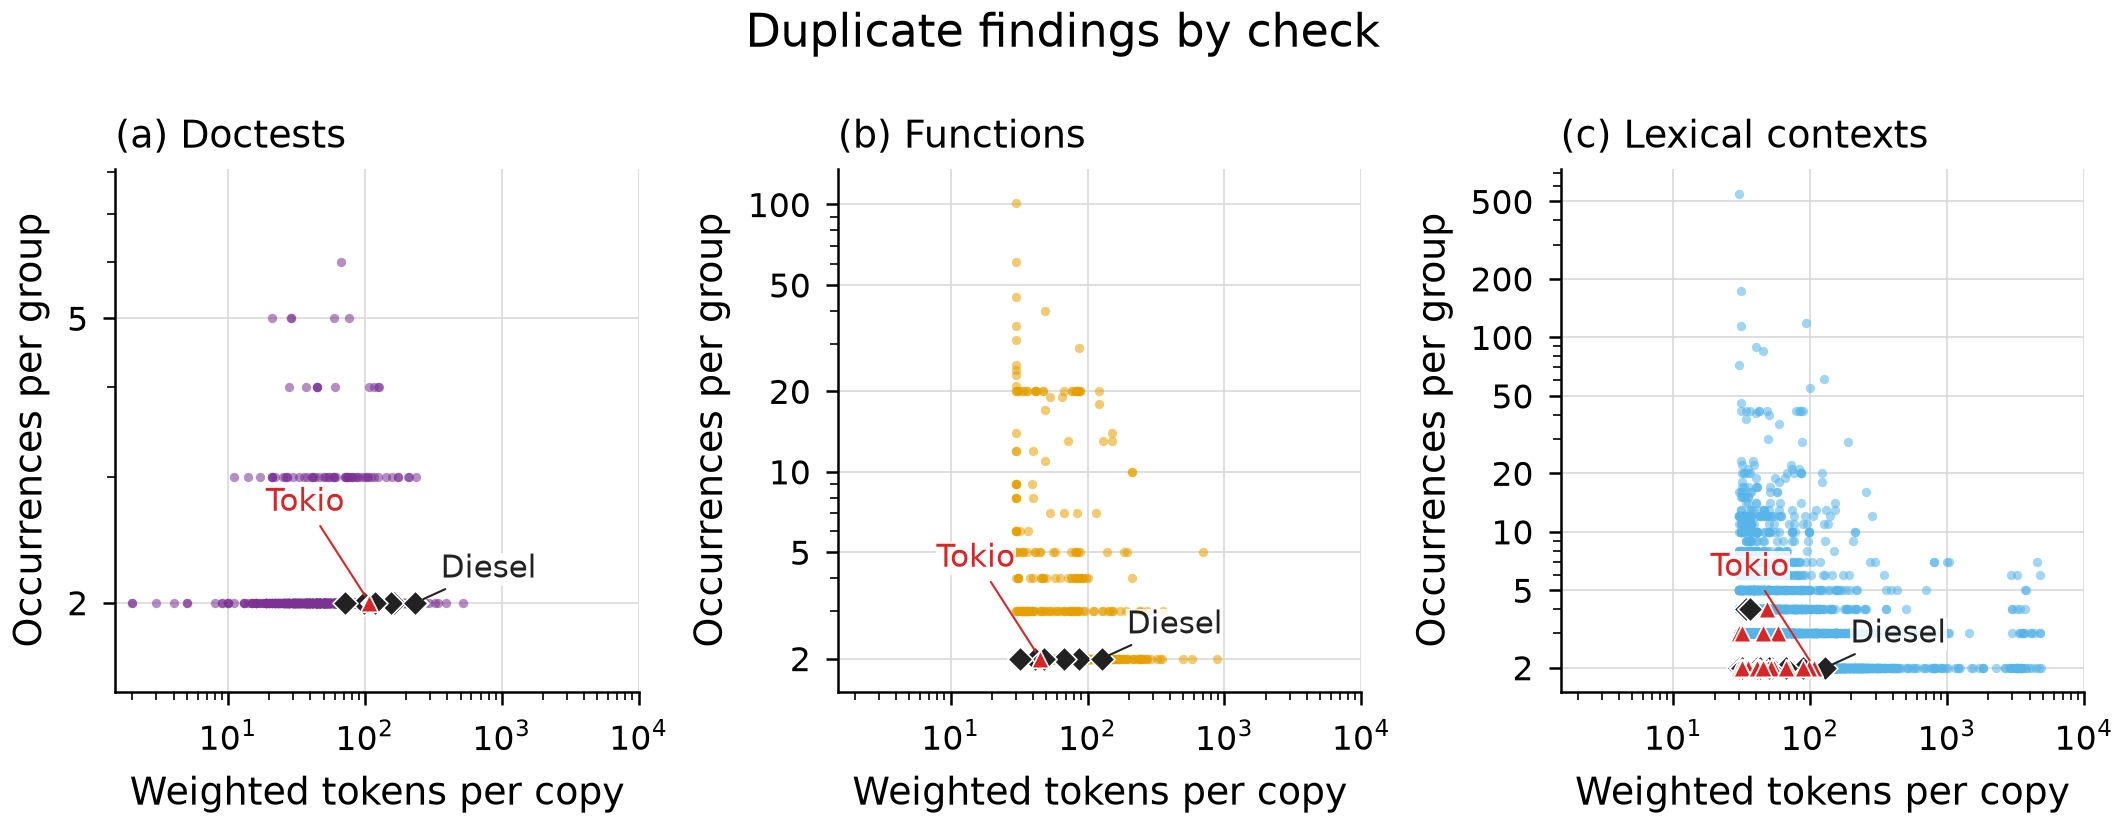
Each point is one canonical duplicate group, measured in weighted tokens per copy and occurrences. Both axes are logarithmic.
Functions and contexts have a 30-token floor. The 23 word-count fallback doctest groups are excluded. Findings from different checks can overlap.
Measured on Diesel at a429c50c8 with the crate-suite binary and host.
Elapsed times are medians of three runs, except for single empty-cache runs. Peak RSS is the largest GNU time measurement. Cargo uses an isolated CARGO_HOME, stable Rust and a populated offline registry, without clearing the filesystem cache.
All configurations include doctests. The full scan covers 537 doctests, 5,503 functions and 12,354 contexts.
| Configuration | Elapsed | Peak RSS |
|---|---|---|
| Default | 0.76 s | 196 MiB |
--functions |
1.66 s | 257 MiB |
--context-blocks |
1.88 s | 234 MiB |
| Both syntax checks | 2.77 s | 257 MiB |
Both plus --all-targets
|
2.78 s | 257 MiB |
Both, restricted with -p diesel
|
1.68 s | 184 MiB |
| Both, explicit workspace context selection and search | 2.93 s | 372 MiB |
Both, select transaction_manager.rs against the workspace |
2.92 s | 372 MiB |
Both, function and context minimum sizes set to 100
|
2.77 s | 257 MiB |
Explicit scopes use --all-targets, selecting either workspace or file:diesel/src/connection/transaction_manager.rs against workspace.
-p limits discovery unless explicit context scopes require more targets. Those scopes filter a workspace index and retain a copied target set, so file and workspace selections can have similar costs.
Token floors apply after canonicalization, reducing reports without avoiding analysis. --all-targets adds work when a workspace has additional binaries or examples.
All rows use --functions --context-blocks --all-targets. Only the final row enables latest-version checks. Empty-cache runs start with a fresh dejadoc cache, which warm runs reuse.
| Configuration | Reached packages | Empty cache | Warm cache | Peak RSS | Coverage |
|---|---|---|---|---|---|
Depth 1
|
87 | 10.22 s | 6.53 s | 516 MiB | Complete |
Depth 2
|
155 | 19.26 s | 9.76 s | 694 MiB | Partial |
Depth 3
|
186 | 23.99 s | 13.43 s | 1,572 MiB | Partial |
Depth 5
|
213 | 24.50 s | 14.19 s | 1,592 MiB | Partial |
Depth 1, include development and build dependencies |
92 | 10.39 s | 6.28 s | 533 MiB | Complete |
Depth 1, all Cargo features |
90 | 10.69 s | 6.29 s | 525 MiB | Complete |
Depth 1, explore all optional dependencies |
90 | 11.50 s | 7.00 s | 526 MiB | Complete |
Depth 1, latest-version checks enabled |
87 | Not measured | 30.44 s | 527 MiB | Complete |
Depths 2, 3 and 5 exit with 2 and report reuse.coverage.complete = false. The scanner cannot resolve the build-script-selected rustix backend. Warm runs rebuild the failed package, so these rows measure partial analyses.
Latest-version and source-provenance checks can require HTTP even with warm indexes. Cargo's offline mode does not control dejadoc's HTTP client.
See Dependency reuse for depth, feature, cache and coverage semantics.
- Discovery retains source text and syntax trees, including doctest-only scans.
- Dependency traversal visits each package once.
- Dependency records and canonical strings remain in memory. Warm indexes still require parsing, hashing and deserialization.
- Common canonical forms can produce many candidate pairs, and containment suppression compares duplicate groups.
- Canonical analysis caps regions at 16,384 nodes, nesting at 64 levels and expanded search at 4,096 states.
- The scan pipeline is largely serial.
There is no whole-scan memory or time budget. Use -p and --context-check-latest false to reduce work.
Run from the workspace root on Linux with CPU IDs 0,1 available and a dependency-exploration build.
cache=$(mktemp -d)
taskset -c 0,1 nice -n 10 /usr/bin/time \
  -f '%e s elapsed, %M KiB peak RSS' \
  cargo-dejadoc dejadoc --functions --context-blocks --all-targets \
  --context-dependency-depth 1 --context-check-latest false \
  --context-cache-dir "$cache" --json --no-fail > report.json
Reuse the cache for warm runs and create a fresh one for each cold configuration. Check reuse.coverage.complete, indexed-file counts and exit status. Record the tool version, source revision, features and network settings.