How to use?
The Gui is separated into tow steps:
In this step you can quickly remove any points that are not densely packed. Distances between points are calculated based on:
- Neighbors: How many neighboring points to use in calculating a cells distance to other points.
- Magnitude: Threshold for the distance (in order of magnitude), how large of a distance is accepted.
- If there are a large amount of points it might take too long, recommend skipping this step if that's the case. -

Once you have chosen your values click 'Plot', this will label any point that will be kept as green.

If satisfied with the selected points click 'Clean' to remove all other points.

Now let's color each cluster/colony. In this step, the points will be given a color and a unique colonyID that will represent its clustering, this can be used later on to plot and extract the colony information.
Buttons:
- 'Estimate colonies': Estimates how many colonies there are, or you can type in your guess on the right of the button.
- 'Plot predicted colonies': to, you know, plot the predicted colonies.
This should color the colonies based on the number in the 'estimated colonies' text window. I recommend inserting an overestimation and fixing it by hand.

At any point, while using the GUI you can use The Lasso. The lasso allows the user to circle any points and say whether those points are a colony (give the points a unique colonyID) or should be ignored/discarded (label the cells as grey and with a -1 as their colonyID, this can then be used later to discard the points).

To use the Lasso you will need these hotkeys:
- 'Shift' on your keyboard and drag the mouse over the region you want to circle.
- 'A' = Accept (all points inside the circle are called a colony)
- 'D' = Delete (label the cells as grey and with a -1 as their colonyID)

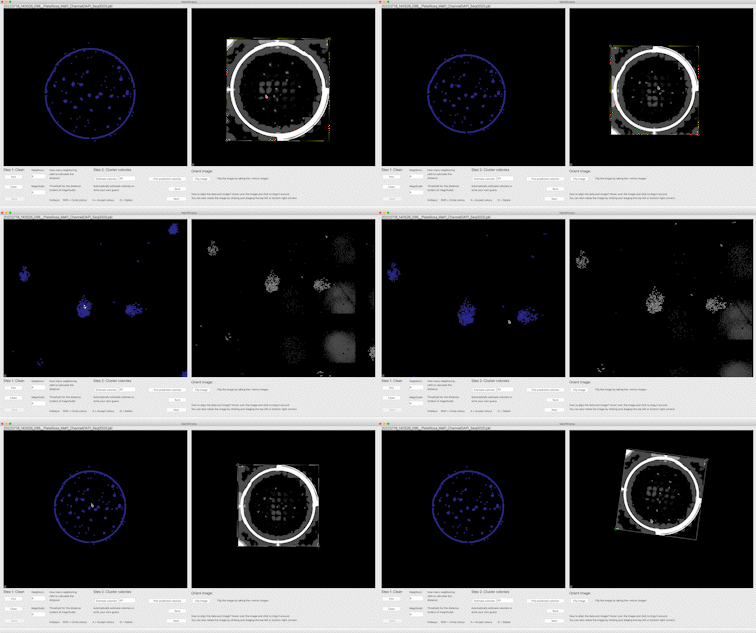
The image can be moved, spun, and flipped to align it to the data. Below is an example of this:
- You can skip Step1 and Step2 and go straight to circling colonies, or use the Gui in any order you want.
- The data can be zoomed in and out with the scroll wheel.
- The data can be dragged to move around.
- The data can be returned to the original size by clicking on the "A" that shows up on the bottom left when hovering over the plotting window.
- The number of estimated colonies controls the gradient of colors that will be used.