Screenshots
All screenshots come from a running instance with four example proxies in front of simulated devices. The numbers in them are measured, not drawn: during the capture period the inverter answered 110 of 115 requests from the cache and asked the device only five times.
The example installation is fictional — solaredge.fritz.box, waermepumpe.fritz.box, and the other names do not belong to any real installation.


The state of all proxies and their throughput at a glance. The tiles can be arranged by dragging.
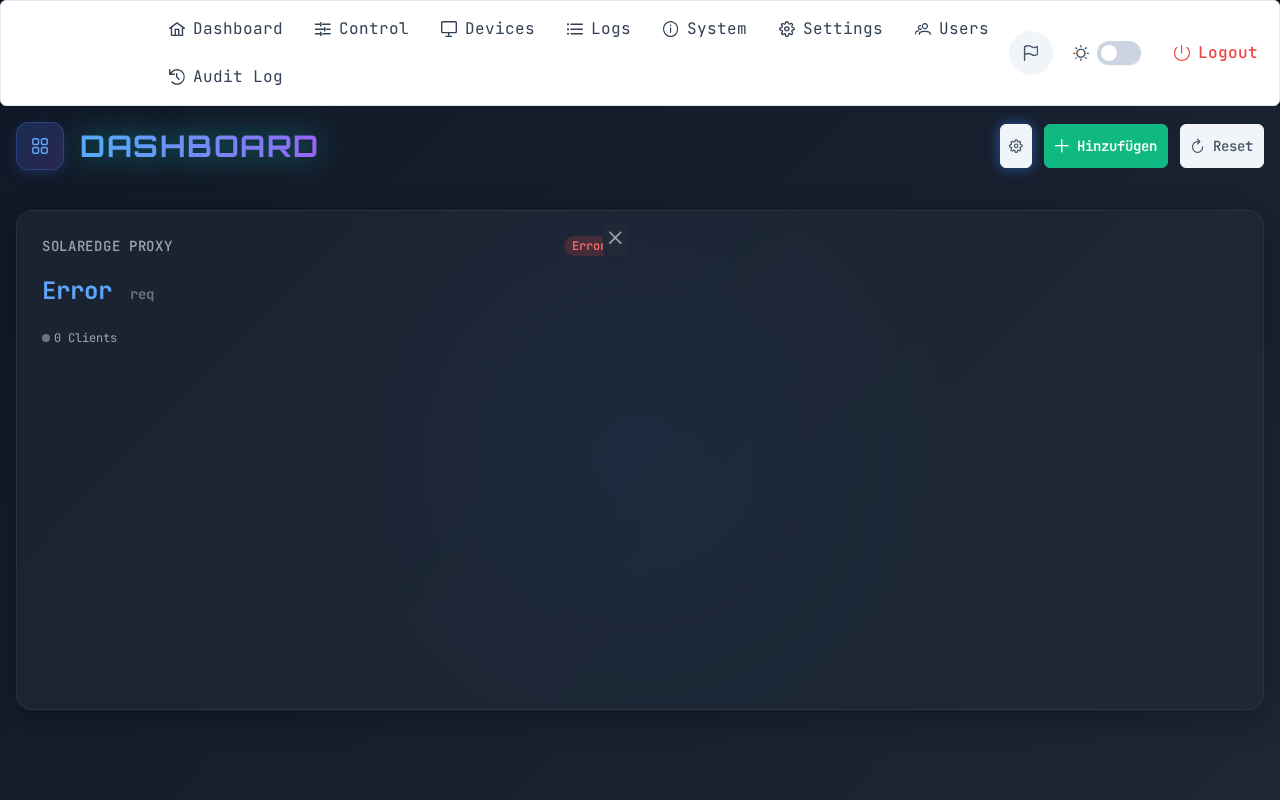
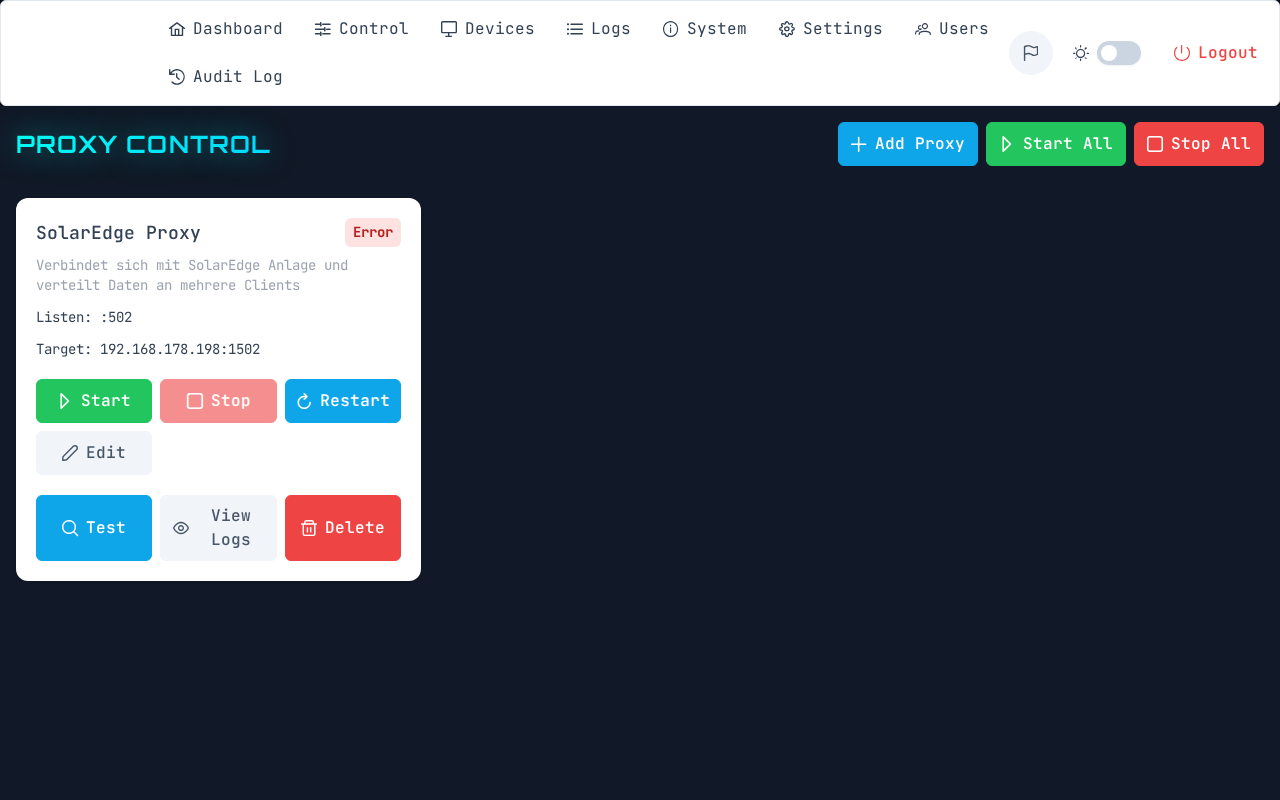
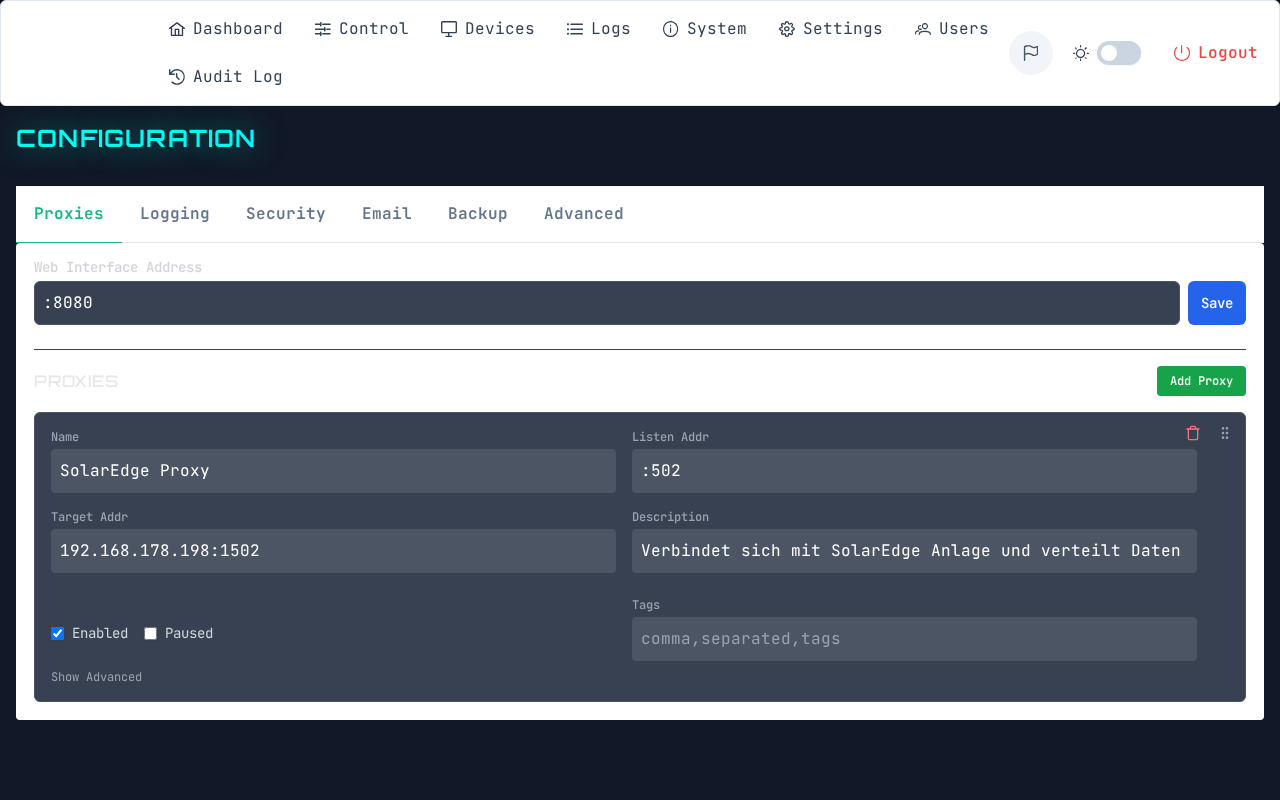
Create, start, stop, group, and sort proxies by dragging.
Device profile, gap, session limit, protocol, and cache in one dialog. What a profile sets is shown in the individual fields afterwards and can be overridden there.

The box further down in the proxy dialog. It states up front what the measurement costs — up to 90 seconds during which no clients are served — and records when the last measurement happened. Via View last measurement the saved report comes back without measuring again.

The saved report: every gap step with error rate and runtimes, the connection levels tested, and below that in words what follows from it. Here the device tolerates 50 ms and gets 100 ms recommended; at 25 ms it discards requests, and it does not serve a second parallel session.
The report stays with the proxy so nobody has to repeat a measurement just to read it again — and apply values is a separate click; it measures, you decide.

Which clients have connected, when last, and through which proxy.
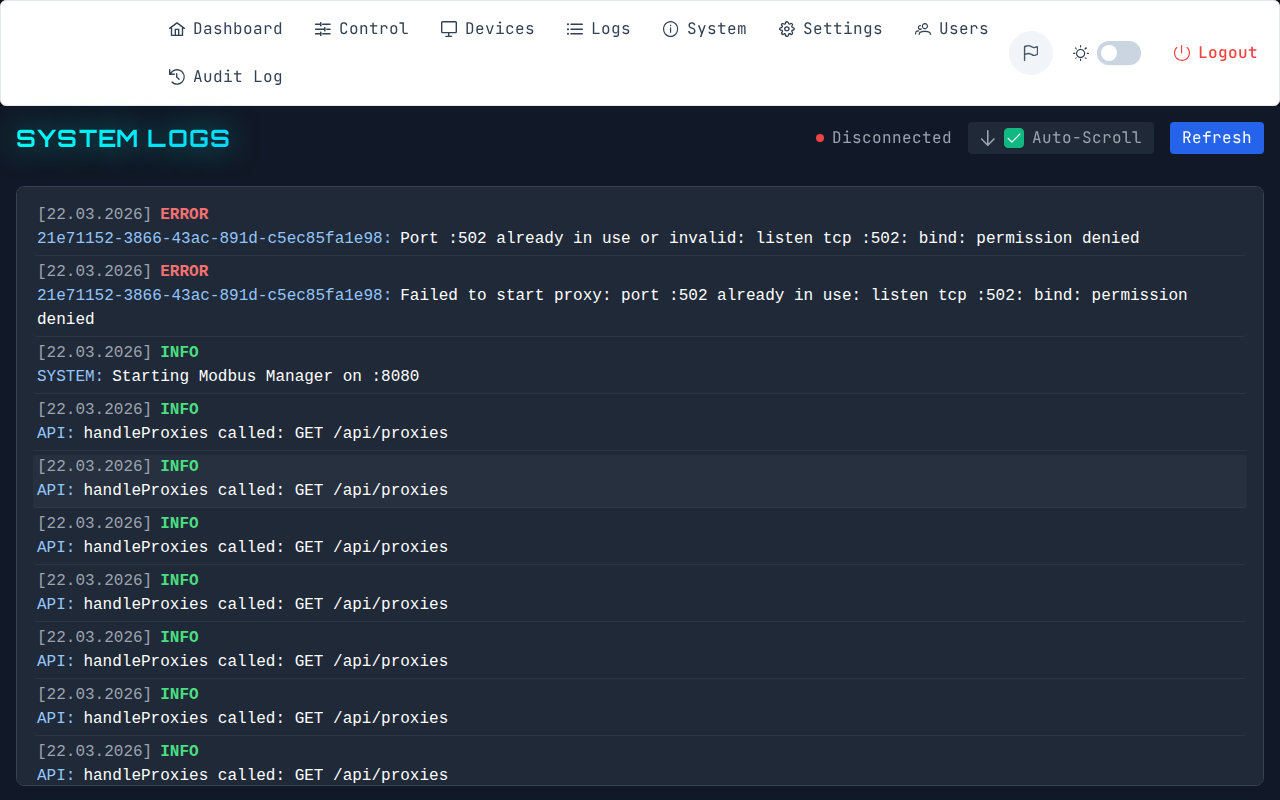
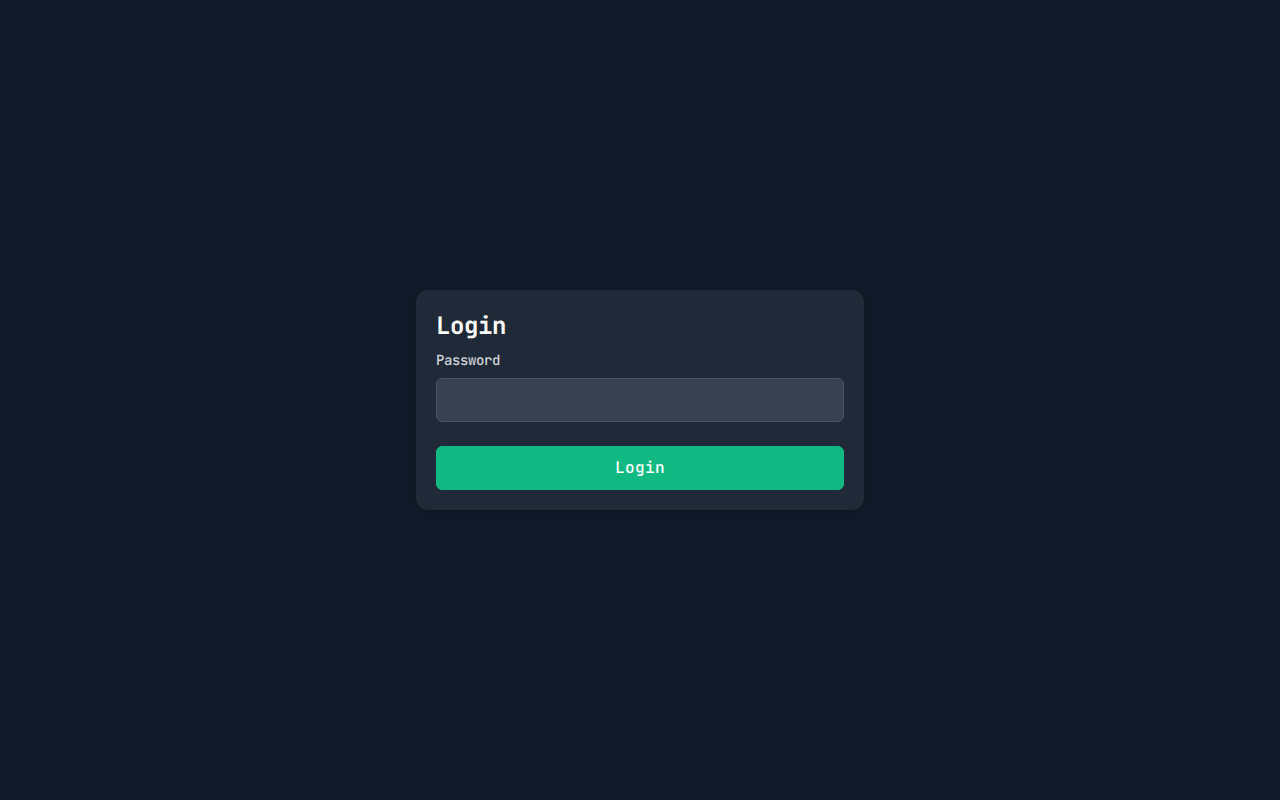
On first start ModBridge generates an admin password and writes it to the log; a change is then required.
Switchable at the bottom left of the sidebar, next to light and a high-contrast black-and-white theme.


The interface is built for narrow screens, not just shrunk down.
| Dashboard | Control |
|---|---|
 |
 |