Adding Plotly plots to your site
Academic Pages includes support for Plotly diagrams via a hook in the Markdown code elements for plotly.js, although those that are comfortable with HTML and JavaScript can also access it directly via those routes. Plotly is included via an npm package and is lazy loading is used in the template to retrieve the minimized JavaScript via a content delivery network (CDN) when a plot needs to be rendered on a page in the template.
In order to render a Plotly plot via Markdown the relevant plot data need to be added as follows:
    ```plotly
    {
      "data": [
        {
          "x": [1, 2, 3, 4],
          "y": [10, 15, 13, 17],
          "type": "scatter"
        },
        {
          "x": [1, 2, 3, 4],
          "y": [16, 5, 11, 9],
          "type": "scatter"
        }
      ]
    }
    ```
Important! Since the data is parsed as JSON all of the keys will need to be quoted for the plot to render. The use of a tool like JSONLint to check syntax is highly recommended.
Which produces the following:
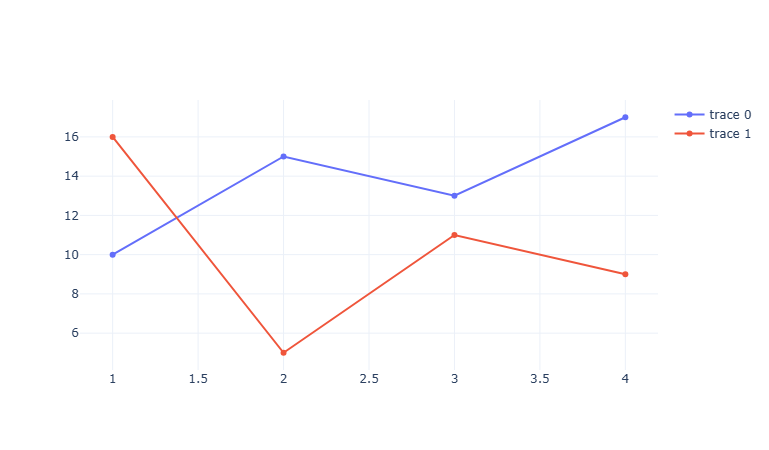
Essentially what is taking place is that the Plotly attributes are being taken from the code block as JSON data, parsed, and passed to Plotly along with a theme that matches the current site theme (i.e., a light theme, or a dark theme). This allows all plots that can be described via the data attribute to rendered with some limitations for the theme of the plot.
The advantage of this is that it is possible to ensure that complex Plotly plots can be incorporated into Academic Pages; however, since GitHub pages only supports static hosting, all of the data needed for the plot needs to be incorporated into the site itself. If you are working with the Python version of Plotly it is possible to access the figure data structure and to dump the JSON data via the to_json function call (see Plotly docs).