This repository was archived by the owner on Nov 24, 2025. It is now read-only.
This repository was archived by the owner on Nov 24, 2025. It is now read-only.
Add clarity to server stats displayed in TP #5708
Description
I'm submitting a ...
- improvement request (usability, performance, tech debt, etc.)
Traffic Control components affected ...
- Traffic Portal
Current behavior:
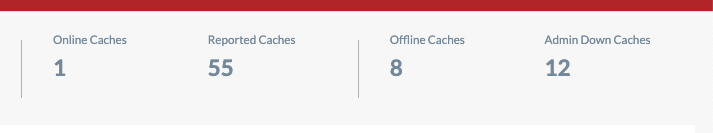
^^ these numbers are populated from the api call:
GET api/3.1/servers?type=EDGE
therefore, the labels "online caches", "reported caches", etc are misleading.
New behavior:
Labels should be:
- Online Edge Caches
- Reported Edge Caches
- Offline Edge Caches
- Admin Down Edge Caches
Or an even better solution would be to aggregate the numbers for ALL caches (edges* and mids*) which would require either making a few calls like:
GET api/3.1/servers?type=EDGE
GET api/3.1/servers?type=MID
and summing the results or making an api change to support something like:
GET api/3.1/servers?type=CACHE
which pulls numbers for any server of type EDGE* or MID*
Minimal reproduction of the problem with instructions:
Launch TP. View the cache status in the top right of the TP dashboard.