Repository navigation
Search and Export
Boltarr has one search box that finds any host or service, a Search page that lists every match, and an Export button that downloads a table as a spreadsheet. This page also covers the table controls (columns, pinning) that help on small screens.
The search box sits in the top bar: Search IP, host, MAC, service…. Press / or Ctrl+K (⌘K on a Mac) to jump to it from anywhere. On a phone it's the 🔍 button.
It searches as you type and finds:
-
Hosts by IP, alias IPs, hostname (also the name the network reports), MAC (with or without separators:
aabbcc,aa-bb-ccandaa:bb:ccall work), vendor, type, OS, notes and the services on open ports. - Services by name, description, port, URL, host and public name.
Results are grouped into Hosts, Services and, below Advanced, Features: things your view level hides right now, which open for this visit (see View Levels). Hosts and Services are listed best matches first (an exact IP or name comes before a partial one). Under each result, a grey line says what matched, for example "MAC aa:bb:…", "alias 192.168.1.21", "port 443 https" or "network name …", with the matching part in bold.
- Pick a result (click it, or use the arrow keys and Enter) to open its details panel.
- +N more hosts — show all in Hosts (or services) opens that page with its filter set to the same text. The Hosts and Services filter boxes use the same matching as the search.
- Esc closes the list.

The drop-down shows up to 8 results per group. To see all of them, click See all N results on the Search page at the bottom of the list, or press Shift+Enter in the search box.
The Search page lists every matching host (with its type) and service, with no limit. Keep typing in its box to narrow it down. Click a row — or Tab to it and press Enter — to open its details.

At Basic and Intermediate, Export sits in the ⋯ menu on the toolbar (see View Levels).
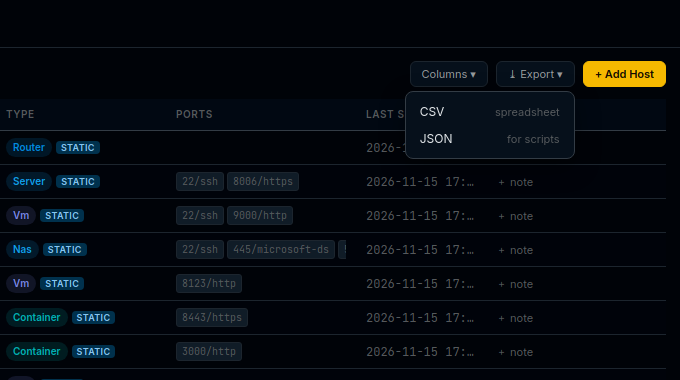
Use ⤓ Export ▾ to take your data into a spreadsheet or a script. It's on the Hosts list, Services and Hosts → IP History. Pick:
- CSV — for a spreadsheet (Excel, LibreOffice, Google Sheets).
- JSON — for scripts.
What you get:
- The rows you see — with your search, filters and sort applied. Filter first, then export, to get just the part you need.
- Every column, including ones you've hidden in Columns ▾. Hosts also get extra columns such as IP type (static/dynamic), Online, Aliases, Source and First seen; open ports include the second address they're on, if any.
-
Dates as
YYYY-MM-DD HH:MMin your timezone, so spreadsheets read them as dates. JSON keeps the stored values. -
Text safe for spreadsheets — accents and non-Latin letters (for example Arabic) open correctly in Excel. A cell that starts like a spreadsheet formula (
=,+,-,@) gets a'in front, so a device can't sneak a formula into your sheet.
The file is named after the table and the date, for example boltarr-hosts-2026-11-15.csv. The export is built in your browser from what's on screen, so nothing extra is sent to the server.
The Hosts and Services tables keep one line per cell. A long value ends with "…"; hover over it to see it in full.
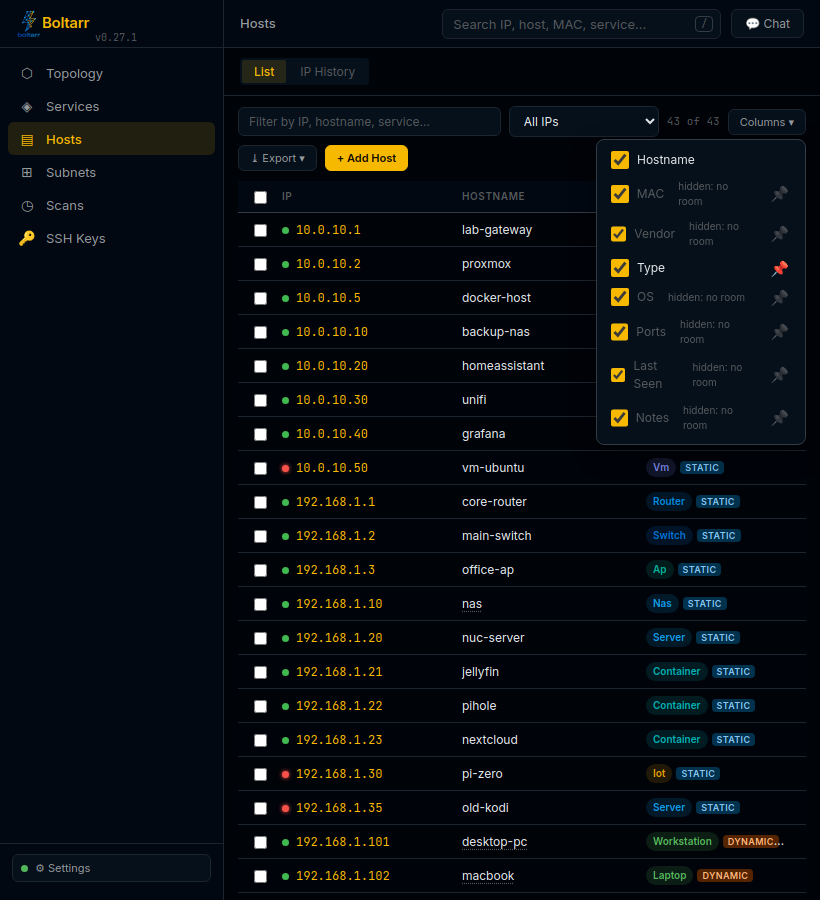
- Columns ▾ — tick or untick columns to show or hide them. Your choice is kept in this browser. At Basic some columns start hidden and are listed under More at Intermediate (see View Levels).
- Hiding by itself — when there's not enough room (for example on a phone), the tables hide their least useful columns first. For Hosts the order is OS → Vendor → Notes → Ports → MAC → Last Seen → Type. They come back when there's room again. A column hidden this way is greyed out in Columns ▾.
- 📌 Pin — click the pin next to a column in Columns ▾ to always show it. If the pinned columns don't fit, the table scrolls sideways instead.
- IP History scrolls sideways on narrow screens.
- Table headers, and the toolbars on Topology → Hierarchy, Scans → Schedules and Scans → Changes, stay in place while the list scrolls.
- Hosts — filters, quick edits and the host panel.
- Subnets and IP History — the IP History table.
- Services and Monitoring — the Services table.