cli,ts: dump timeseries in debug zip#50432
Closed
tbg wants to merge 1 commit intocockroachdb:masterfrom
Closed
Conversation
This is a prototype to hopefully nerd-snipe @lunevalex.
The goal is to include, in each debug.zip, a relevant slice of time
series.

Beyond this PR, I locally played around with a Grafana+postgres
docker-compose setup that allows us to visualize these time series
easily (unfortunately it is hard to import historical data into an
existing prometheus instance, so we have to reinvent the wheel a little
bit here).  I expect that given that we have a nice structured catalog
of timeseries charts in `pkg/ts/catalog`, we will be able to auto-
generate a nice dashboard for this. This is also generally desirable -
if we treat dashboards as code (as we already do, including a lint
that all metrics are represented in the catalog) and make full use of
that (as we don't), we can provide dashboards with each version that
are "known to work".

I expect that a further investment here will obviously be valuable
once we actually get timeseries in debug.zip.

Another immediate win from this grafana infrastructure would be
that we can use it to debug our roachtests.

Release note: None
Member
|
This change is |
tbg
added a commit
to tbg/cockroach
that referenced
this pull request
Jun 27, 2020
Add a docker-compose setup that starts a local Grafana backed by a local
Postgres along with a helper that can import timeseries data into the
Postgres instance which the Grafana instance is configured to display.

Consult scripts/localmetrics/README.md for a quickstart.

This isn't a valuable debug tool just yet, but with a bit of elbow
grease, I believe that it will become an invaluable tool to avoid
the many back-and-forth round-trips we have these days with customers
to exchange screenshots of the Admin UI.

To make it truly useful, we need

1. [timeseries in debug.zip](cockroachdb#50432)
2. auto-generate dashboards from `./pkg/ts/catalog`.

Both are totally doable, and even without 2) there's already some
utility as it's easy to make ad-hoc panels in Grafana thanks to the
built-in query builder.

Release note: None
craig Bot
pushed a commit
that referenced
this pull request
Jun 27, 2020
50702: localmetrics: add local Grafana timeseries tooling r=petermattis a=tbg Add a docker-compose setup that starts a local Grafana backed by a local Postgres along with a helper that can import timeseries data into the Postgres instance which the Grafana instance is configured to display. Consult scripts/localmetrics/README.md for a quickstart. This isn't a valuable debug tool just yet, but with a bit of elbow grease, I believe that it will become an invaluable tool to avoid the many back-and-forth round-trips we have these days with customers to exchange screenshots of the Admin UI. To make it truly useful, we need 1. [timeseries in debug.zip](#50432) 2. auto-generate dashboards from `./pkg/ts/catalog`. Both are totally doable, and even without 2) there's already some utility as it's easy to make ad-hoc panels in Grafana thanks to the built-in query builder. Finally, here's a screenshot of the one panel included here right now, the rate of DistSender batches, taken from `sample.csv`. 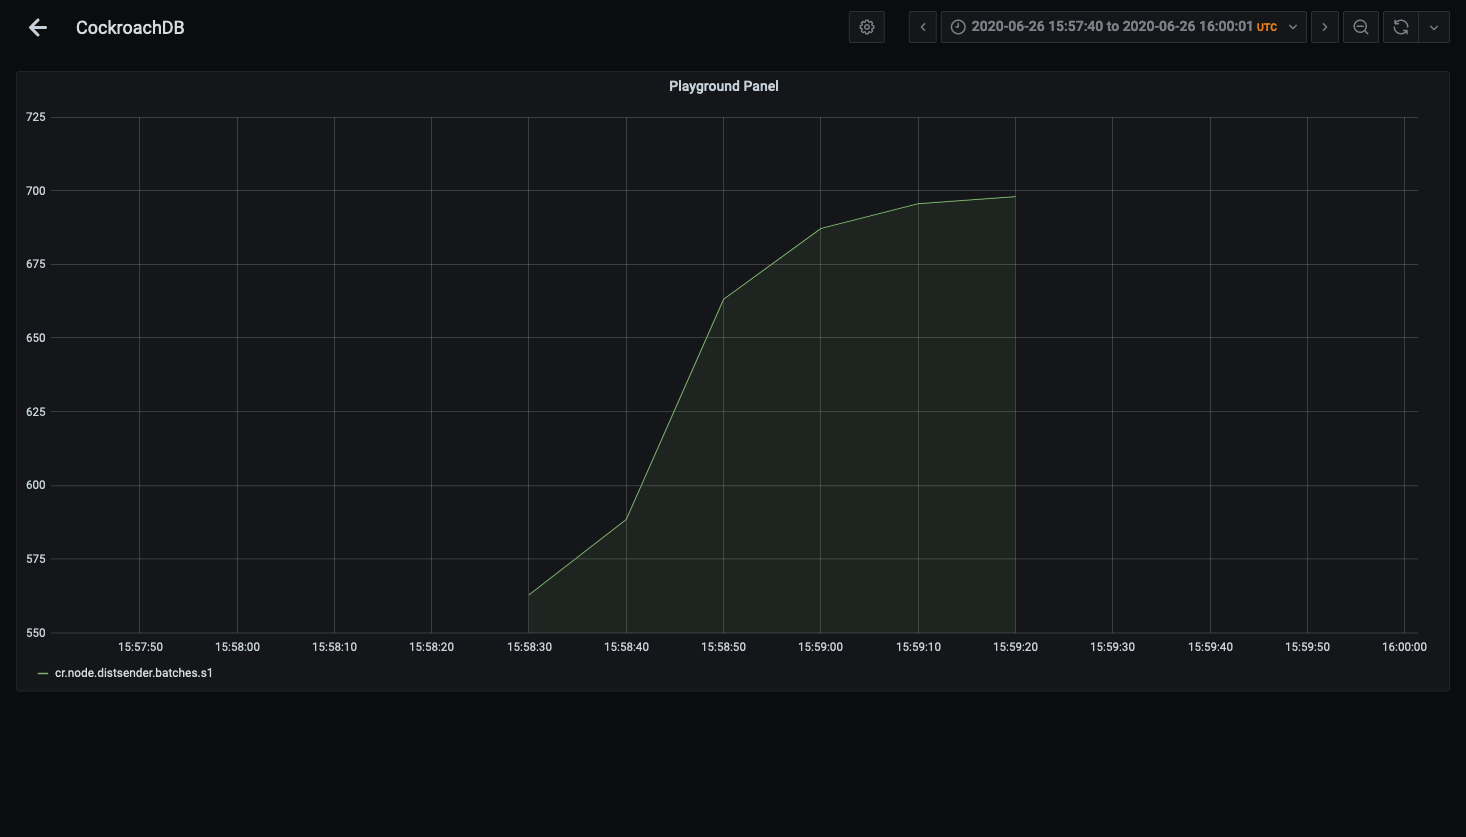 Release note: None Co-authored-by: Tobias Schottdorf <tobias.schottdorf@gmail.com>
tbg
added a commit
to tbg/cockroach
that referenced
this pull request
Jun 30, 2020
Add a docker-compose setup that starts a local Grafana backed by a local
Postgres along with a helper that can import timeseries data into the
Postgres instance which the Grafana instance is configured to display.

Consult scripts/localmetrics/README.md for a quickstart.

This isn't a valuable debug tool just yet, but with a bit of elbow
grease, I believe that it will become an invaluable tool to avoid
the many back-and-forth round-trips we have these days with customers
to exchange screenshots of the Admin UI.

To make it truly useful, we need

1. [timeseries in debug.zip](cockroachdb#50432)
2. auto-generate dashboards from `./pkg/ts/catalog`.

Both are totally doable, and even without 2) there's already some
utility as it's easy to make ad-hoc panels in Grafana thanks to the
built-in query builder.

Release note: None
craig Bot
pushed a commit
that referenced
this pull request
Jun 30, 2020
50654: geomfn: apply bounding box checks for DWithin/DFullyWithin r=sumeerbhola a=otan We are able to optimize DWithin/DFullyWithin by extended the bounding box for geometry types by distance units in each direction and checking if they intersect / covers. Also implement cartesian bounding box covers and use it for other relevant operations. Release note: None 50702: localmetrics: add local Grafana timeseries tooling r=petermattis a=tbg Add a docker-compose setup that starts a local Grafana backed by a local Postgres along with a helper that can import timeseries data into the Postgres instance which the Grafana instance is configured to display. Consult scripts/localmetrics/README.md for a quickstart. This isn't a valuable debug tool just yet, but with a bit of elbow grease, I believe that it will become an invaluable tool to avoid the many back-and-forth round-trips we have these days with customers to exchange screenshots of the Admin UI. To make it truly useful, we need 1. [timeseries in debug.zip](#50432) 2. auto-generate dashboards from `./pkg/ts/catalog`. Both are totally doable, and even without 2) there's already some utility as it's easy to make ad-hoc panels in Grafana thanks to the built-in query builder. Finally, here's a screenshot of the one panel included here right now, the rate of DistSender batches, taken from `sample.csv`.  Release note: None 50794: sql: disallow creation of schemas with the "pg_" prefix r=arulajmani a=rohany This is disallowed by Postgres, and will be useful when integrating user defined schema resolution with the temporary schema (which isn't backed by a descriptor). Release note: None Co-authored-by: Oliver Tan <otan@cockroachlabs.com> Co-authored-by: Tobias Schottdorf <tobias.schottdorf@gmail.com> Co-authored-by: Rohan Yadav <rohany@alumni.cmu.edu>
Member
Author
|
Carry over in #60611 |
This file contains hidden or bidirectional Unicode text that may be interpreted or compiled differently than what appears below. To review, open the file in an editor that reveals hidden Unicode characters.
Learn more about bidirectional Unicode characters
Sign up for free
to join this conversation on GitHub.
Already have an account?
Sign in to comment
3 participants
Add this suggestion to a batch that can be applied as a single commit.This suggestion is invalid because no changes were made to the code.Suggestions cannot be applied while the pull request is closed.Suggestions cannot be applied while viewing a subset of changes.Only one suggestion per line can be applied in a batch.Add this suggestion to a batch that can be applied as a single commit.Applying suggestions on deleted lines is not supported.You must change the existing code in this line in order to create a valid suggestion.Outdated suggestions cannot be applied.This suggestion has been applied or marked resolved.Suggestions cannot be applied from pending reviews.Suggestions cannot be applied on multi-line comments.Suggestions cannot be applied while the pull request is queued to merge.Suggestion cannot be applied right now. Please check back later.
This is a prototype to hopefully nerd-snipe @lunevalex.
The goal is to include, in each debug.zip, a relevant slice of time
series.
Beyond this PR, I locally played around with a Grafana+postgres
docker-compose setup that allows us to visualize these time series
easily (unfortunately it is hard to import historical data into an
existing prometheus instance, so we have to reinvent the wheel a little
bit here). I expect that given that we have a nice structured catalog
of timeseries charts in
pkg/ts/catalog, we will be able to auto-generate a nice dashboard for this. This is also generally desirable -
if we treat dashboards as code (as we already do, including a lint
that all metrics are represented in the catalog) and make full use of
that (as we don't), we can provide dashboards with each version that
are "known to work".
I expect that a further investment here will obviously be valuable
once we actually get timeseries in debug.zip.
Another immediate win from this grafana infrastructure would be
that we can use it to debug our roachtests.
cc @andreimatei
Release note: None