localmetrics: add local Grafana timeseries tooling#50702
localmetrics: add local Grafana timeseries tooling#50702craig[bot] merged 2 commits intocockroachdb:masterfrom
Conversation
Release note: None
|
This change is |
 petermattis
left a comment
petermattis
left a comment
There was a problem hiding this comment.
This is neat!
sample.csv is pretty large. Is it it worth including?
Reviewed 3 of 3 files at r1.
Reviewable status:complete! 1 of 0 LGTMs obtained (waiting on @lunevalex and @petermattis)
Don't think it would've mattered, but I moved it to a gist instead, so it's gone now. TFTR bors r=petermattis |
Build failed |
|
bors r=petermattis Lint |
Build failed |
|
lint fails with:
Probably @jordanlewis knows what to make of that, but it doesn't seem to be this PR's fault. |
|
bors r=petermattis master is probably fixed now. |
50702: localmetrics: add local Grafana timeseries tooling r=petermattis a=tbg Add a docker-compose setup that starts a local Grafana backed by a local Postgres along with a helper that can import timeseries data into the Postgres instance which the Grafana instance is configured to display. Consult scripts/localmetrics/README.md for a quickstart. This isn't a valuable debug tool just yet, but with a bit of elbow grease, I believe that it will become an invaluable tool to avoid the many back-and-forth round-trips we have these days with customers to exchange screenshots of the Admin UI. To make it truly useful, we need 1. [timeseries in debug.zip](#50432) 2. auto-generate dashboards from `./pkg/ts/catalog`. Both are totally doable, and even without 2) there's already some utility as it's easy to make ad-hoc panels in Grafana thanks to the built-in query builder. Finally, here's a screenshot of the one panel included here right now, the rate of DistSender batches, taken from `sample.csv`. 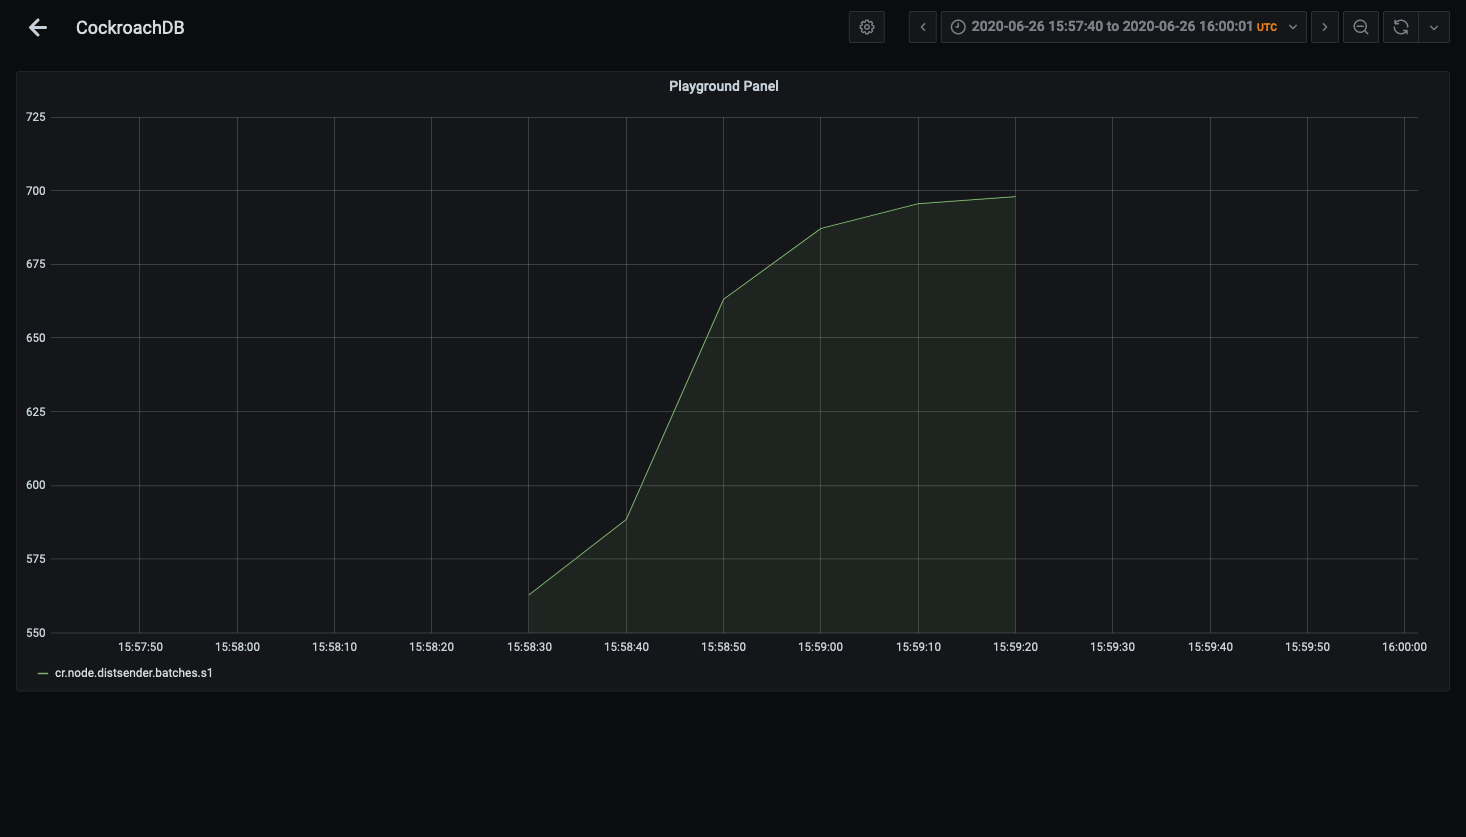 Release note: None Co-authored-by: Tobias Schottdorf <tobias.schottdorf@gmail.com>
Build failed |
Add a docker-compose setup that starts a local Grafana backed by a local
Postgres along with a helper that can import timeseries data into the
Postgres instance which the Grafana instance is configured to display.

Consult scripts/localmetrics/README.md for a quickstart.

This isn't a valuable debug tool just yet, but with a bit of elbow
grease, I believe that it will become an invaluable tool to avoid
the many back-and-forth round-trips we have these days with customers
to exchange screenshots of the Admin UI.

To make it truly useful, we need

1. [timeseries in debug.zip](cockroachdb#50432)
2. auto-generate dashboards from `./pkg/ts/catalog`.

Both are totally doable, and even without 2) there's already some
utility as it's easy to make ad-hoc panels in Grafana thanks to the
built-in query builder.

Release note: None
|
bors r=petermattis |
Build succeeded |
Add a docker-compose setup that starts a local Grafana backed by a local
Postgres along with a helper that can import timeseries data into the
Postgres instance which the Grafana instance is configured to display.
Consult scripts/localmetrics/README.md for a quickstart.
This isn't a valuable debug tool just yet, but with a bit of elbow
grease, I believe that it will become an invaluable tool to avoid
the many back-and-forth round-trips we have these days with customers
to exchange screenshots of the Admin UI.
To make it truly useful, we need
./pkg/ts/catalog.Both are totally doable, and even without 2) there's already some
utility as it's easy to make ad-hoc panels in Grafana thanks to the
built-in query builder.
Finally, here's a screenshot of the one panel included here right now,
the rate of DistSender batches, taken from
sample.csv.Release note: None