Music Visualizers
A 13.33:1 strip is an awkward shape for almost everything — and close to ideal for a spectrum analyser. The ratio that makes emulation hopeless on this panel is the same ratio a bar graph, a VU meter and a scrolling spectrogram already have.
32 modes ship, all holding 30 fps on hardware.
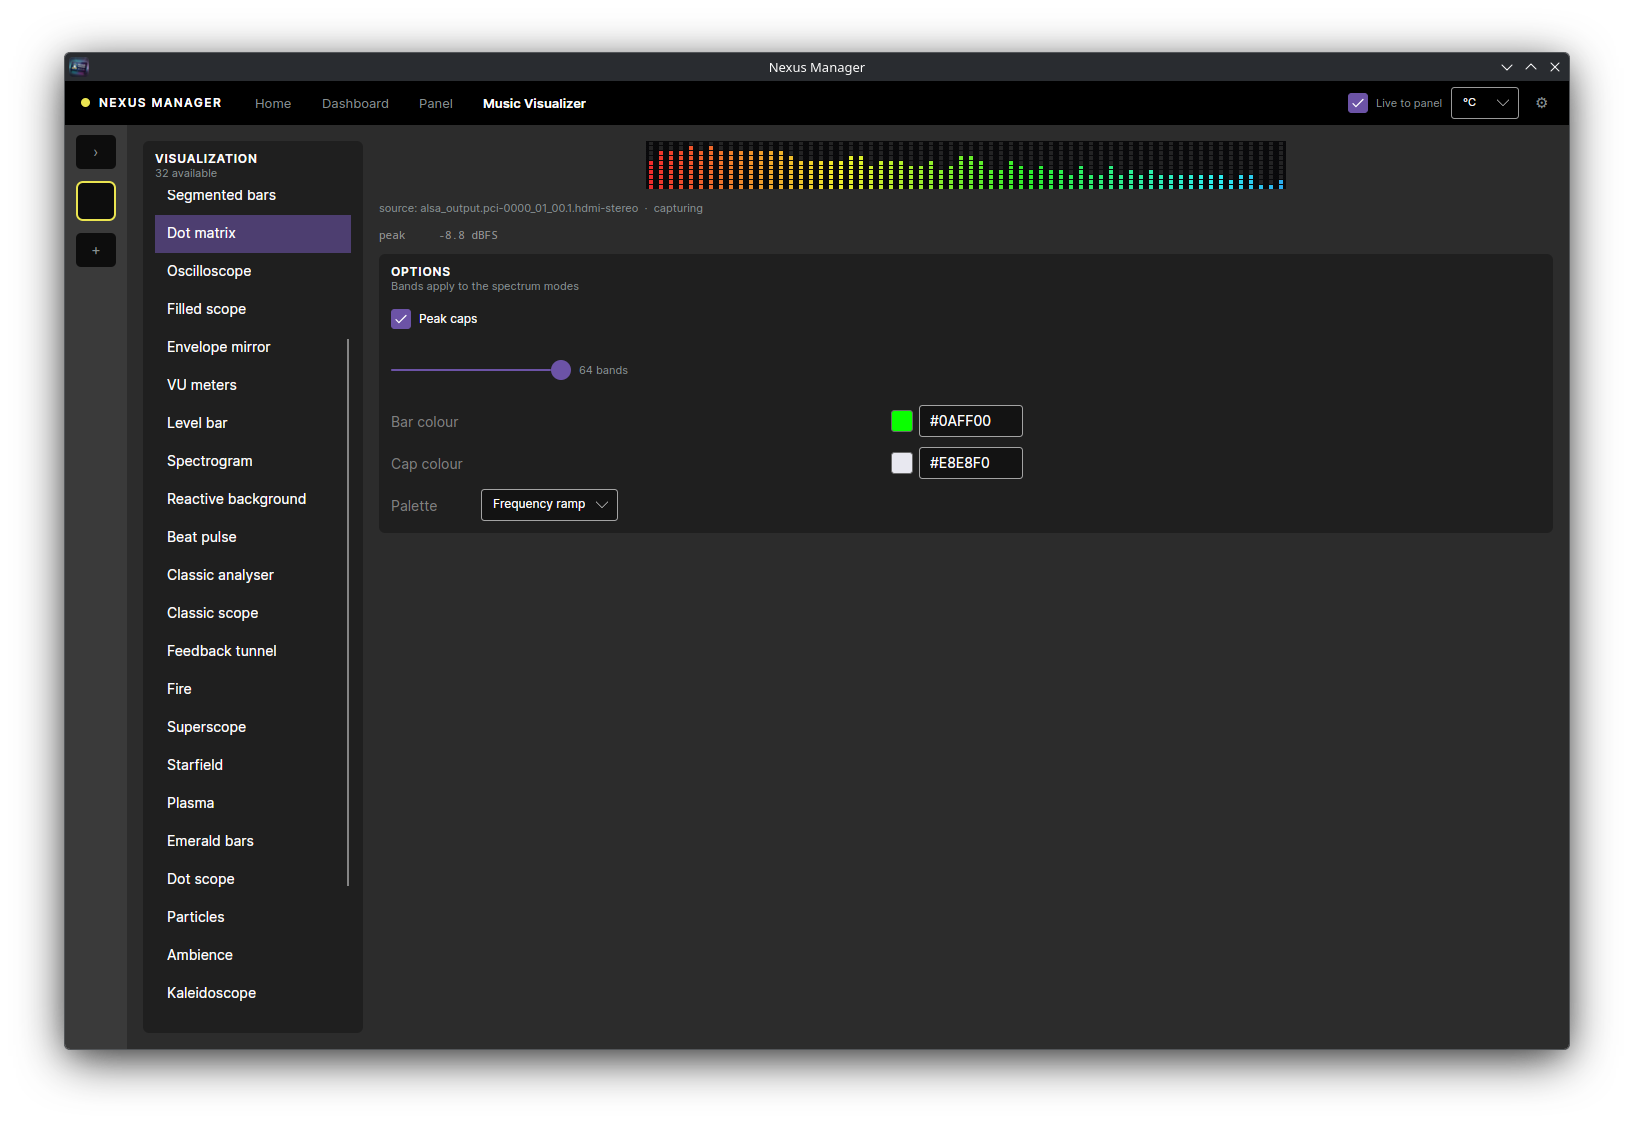
The visualizers read the default sink's monitor, so they react to whatever the machine is playing rather than to one application.
This cost real time and is worth stating loudly.
A PipeWire monitor is a port on the sink node, not a node of its own. The
.monitor suffix is a PulseAudio-shim concept. Given a name it cannot resolve,
pw-record does not fail — it silently falls back to another source. Measured:
five seconds against a RUNNING monitor with music playing gave 257536 samples,
peak 0, RMS 0.
parec -d <sink>.monitor works and is stable. Three consecutive 3-second
captures at the same moment:
| run | samples | wall | peak | RMS |
|---|---|---|---|---|
| 1 | 143040 | 2.98 s | −8.1 dBFS | −18.6 dBFS |
| 2 | 143040 | 2.98 s | −8.5 dBFS | −18.5 dBFS |
| 3 | 143040 | 2.98 s | −8.1 dBFS | −18.8 dBFS |
99.3% of each window delivered, levels repeatable to 0.4 dB.
A machine typically has several sinks — HDMI, SPDIF, speakers, headphones — each with its own monitor. Hardcoding one gives a visualizer that is silent whenever the output is switched, and the failure is silent correctness: it renders a perfectly good flat line. Re-resolve the default and restart capture when it changes.
Wrong sink, suspended sink, genuine silence, and broken capture all look
identical on the panel. A monitor on a suspended sink emits zeros, not an
error. That is why nexus-manager visualizer --probe exists: it prints the
resolved sink, whether its monitor is RUNNING or SUSPENDED, live peak dBFS, and
the delivered hop rate.
One chain feeds every mode, so a mode costs a draw routine rather than an analyser, and two modes can never disagree about what the audio was doing.
- 4096-point FFT, hop 1024, Hann window. At 48 kHz that is 11.7 Hz bins and 46.9 analysis hops per second. Bass is the reason to use a long window — at 23.4 Hz bins there are barely five bins under 120 Hz and the lowest bars flicker on and off. Overlap, not a short window, is the answer to transient response.
- Log-spaced bands. The most common way a spectrum analyser looks bad is linear bins: at 11.7 Hz spacing, everything up to 1 kHz — most musical fundamentals — occupies 4% of the display width.
- Summed band power, not mean. This is what an RTA does, and it matters more than it sounds. A geometric band's width scales with its centre frequency, so summed band power is spectral density × f. Music is roughly pink, so summed log bands render it close to flat with no correction at all. Mean power — density — would instead flatten white noise and slope music down to the right, needing a large cosmetic tilt to undo. Summing also means a pure tone reads at its true level in any band width, which is what makes the analysis chain testable at all.
- Instant attack, timed decay. Symmetric smoothing misses transients; no smoothing is unwatchable.
- A silence gate, so the display idles instead of twitching on a monitor's noise floor.
The detail that makes a bar display feel alive. Three things are required, and it reads as a plain chart without any of them:
- It holds — about 0.4 s at a new high, so there is a moment where the cap is visibly detached from a bar that has dropped away beneath it.
- It accelerates — velocity integrates a constant gravity. A constant fall rate looks like a decaying value; an accelerating one looks like a falling object.
- It collides — it lands on the bar and rides it, rather than passing through to the floor.
⛔ Gravity is applied in normalised display units, not decibels. The bar's own decay is correctly in dB — that is a level meter's job — but a constant fall in dB is not a constant fall in pixels, and an accelerating fall in dB is a different curve again once drawn. The cap has to accelerate in the space it is actually drawn in.
Cap colour is its own setting and defaults to white, because that is what the meters this imitates actually did.
Spectral flux against a rolling median of recent flux.
- Flux rather than loudness, because loudness cannot tell a beat from a sustained loud passage — a held chord is loud on every hop and would fire continuously, while a kick under a quiet passage would never fire at all.
- Only rises count; negative differences are discarded. That is what makes an onset an onset.
- Median rather than mean, because one crash cymbal drags a mean up far enough to swallow the next several beats.
Measured on hardware, 32 bands at 30 fps: p50 ≈ 26 ms from a sample being
read out of parec to the frame derived from it reaching the panel.
⛔ That figure excludes two legs and should never be quoted as end-to-end: the PipeWire graph (application → sink → monitor), which is not ours to time, and the analysis window's own centroid. The second cuts both ways — attack is instant by design, so a transient lifts its bar as soon as it enters the window at all, and for judging whether the display is on the beat the measured number is the honest one.
With 32 modes an aggregate frame rate is nearly useless: one slow mode is 3% of a
cycling run. visualizer --sweep runs each mode in turn, reports achieved fps
per mode, and exits non-zero if any misses target.
It exists because a single mode once dragged a cycling run's worst-case latency from 44.8 ms to 79.6 ms while the average stayed respectable, and only a per-mode comparison could name it.
⛔ One caveat about that tool's own output: its p50 latency column tracks position in the run, not mode complexity — the heaviest modes sit in the fast group. It is the 46.9 Hz analyser drifting in phase against the 30 Hz display. Read the fps column; the latency column needs an instrument that holds phase constant before it means anything per mode.