Home

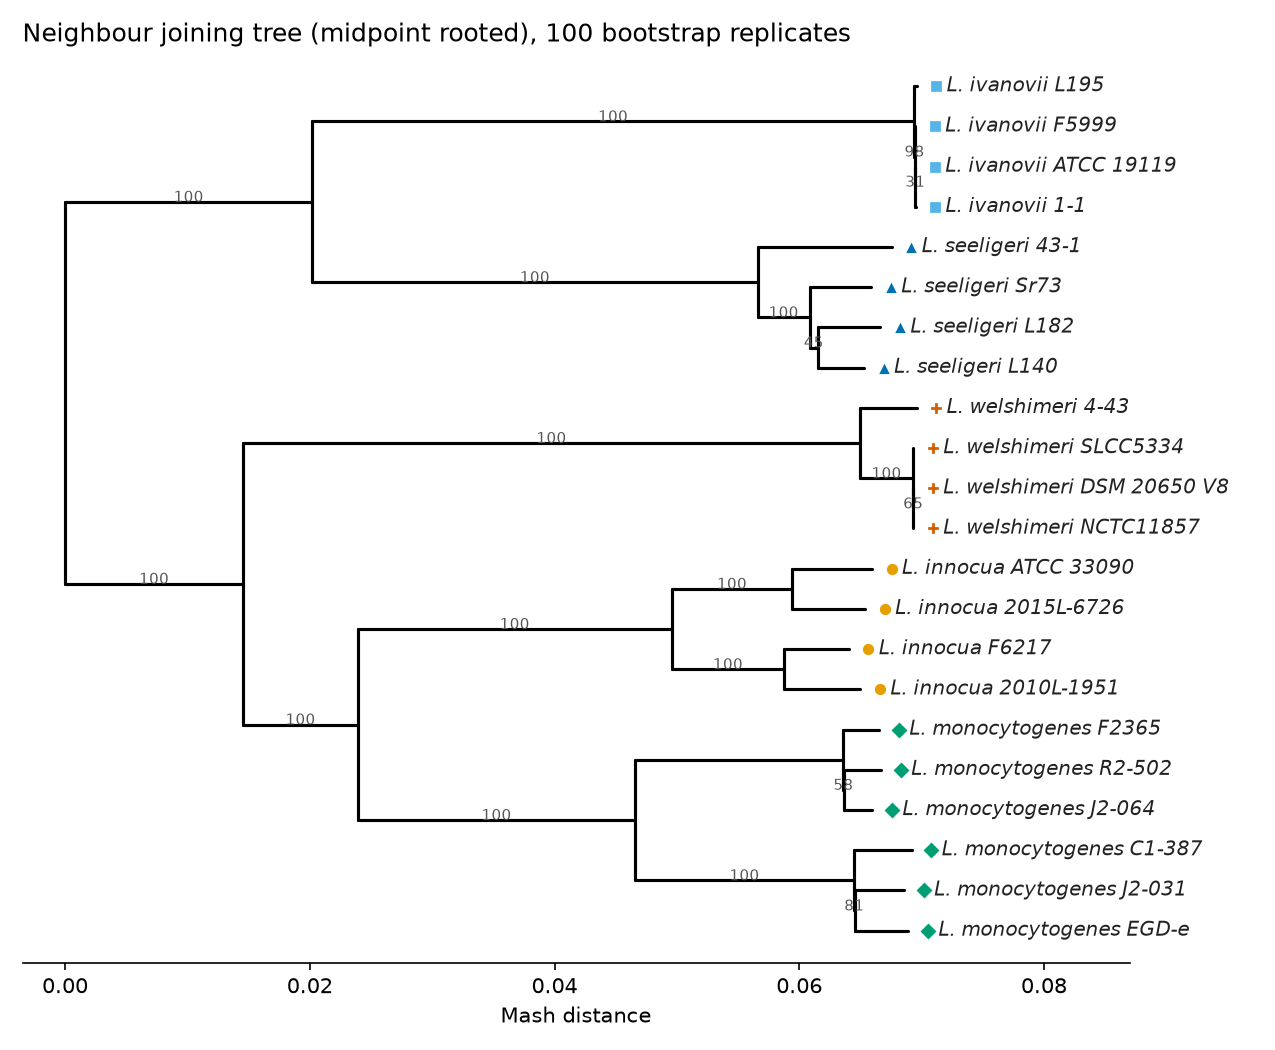
genome_comparator quickly compares and visualizes distances between organisms using whole genome information, from assemblies (fasta) or raw sequencing reads (fastq). It uses Mash to compute pairwise distances, then builds trees (UPGMA, neighbour joining, minimum evolution), optionally with bootstrap support, and an interactive PCoA plot.
It scales to thousands of genomes: sketches are computed in parallel, reused between runs, and all the pairwise distances are computed in a single multithreaded Mash call.
- Installation
- Tutorial: 22 public Listeria genomes, step by step
- Usage: input files, options and examples
- Output files
- How it works: interpreting distances, trees and the PCoA
- Bootstrap support
- Performance
-
Other tools:
dendrogram-from-matrix,tree-collapser,tree-renamer - Related tools
- Troubleshooting
- FAQ
- Changelog
- Contributing
Please cite genome_comparator: Duceppe M-O. genome_comparator: fast comparison and visualization of genome distances with Mash. Zenodo. https://doi.org/10.5281/zenodo.22920856 (all versions; each release also has its own DOI on Zenodo). Please also cite Mash: Ondov BD et al. Mash: fast genome and metagenome distance estimation using MinHash. Genome Biology 17, 132 (2016). https://doi.org/10.1186/s13059-016-0997-x