Tutorial
This tutorial runs genome_comparator on 22 public Listeria genomes from NCBI RefSeq, 4–6 strains from each of five species, and walks through every output. It takes about 5 minutes, including the download.
You need the NCBI datasets command line tool in addition to genome_comparator:
conda activate genome_comparator
conda install -c conda-forge ncbi-datasets-cli
The example is in the examples/listeria/ folder of the repository. metadata.tsv lists the RefSeq accession,
species and strain of each genome; download.sh downloads them (65 MB) and names each file after its accession:
cd genome_comparator/examples/listeria
./download.sh
ls genomes/ | head -3
GCF_000008285.1.fna
GCF_000060285.1.fna
GCF_000196035.1.fna
genome-comparator -i genomes -o results -t 8 --nj --me --pcoa --metadata metadata.tsv --color-by species
This takes about 3 seconds on 8 threads. The log is printed and saved in results/genome_comparator.log.
results/sample_stats.tsv has one row per genome. These are complete genomes: 2.8–3.1 Mb, in 1 to 3 sequences
(chromosome and plasmids):
sample           type   files  length   sequences  est_coverage  status
GCF_000008285.1  fasta  1      2905187  1                        ok
GCF_000060285.1  fasta  1      2814130  1                        ok
...
Always check the status column: a failed sample could not be read and is not in the results.
results/all_dist.tsv holds the Mash distance between every pair of genomes. Mash distance is roughly
1 − ANI (average nucleotide identity), so 0.05 corresponds to about 95% ANI, the usual species boundary
(see How it works). In this dataset:
| Pair | Mash distance | ≈ ANI |
|---|---|---|
| Largest distance within a species | 0.044 | 96% |
| L. monocytogenes EGD-e vs F2365 (lineages II and I) | 0.043 | 96% |
| L. monocytogenes vs L. innocua | 0.087 | 91% |
| L. monocytogenes vs L. seeligeri | 0.135 | 87% |
| Smallest distance between two species | 0.080 | 92% |
Open results/tree/all_dist_PCoA.html in a web browser. Hover over a point to see the sample and its metadata;
click legend entries to hide or show a species. Each species has its own colour and marker shape
(colourblind-friendly).
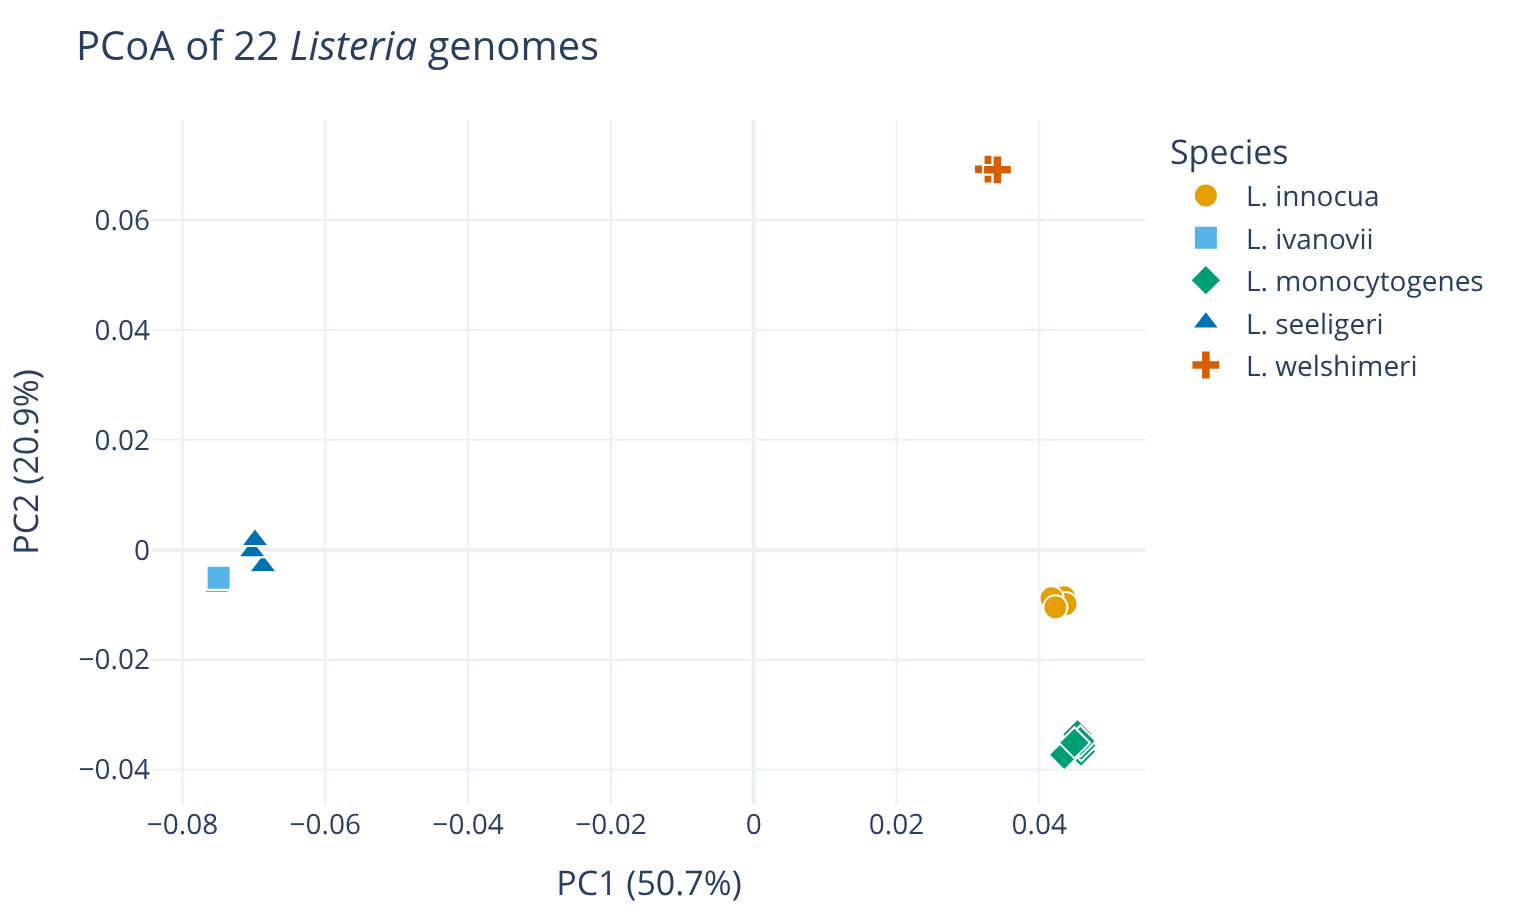
The first axis (PC1, 50.7% of the variation) separates L. seeligeri and L. ivanovii from the three other
species, and the second axis separates L. welshimeri, L. innocua and L. monocytogenes. L. seeligeri and
L. ivanovii are close on these two axes; they are separated on the third axis, whose coordinates are in
results/tree/all_dist_PCoA.tsv.
Three trees are in results/tree/: all_dist_hc.nwk (UPGMA), all_dist_nj.nwk (neighbour joining) and
all_dist_me.nwk (minimum evolution). Tip labels are the sample names (accessions). To show species and strain
names instead, rename the tips with tree-renamer, using a table built from the metadata:
tail -n +2 metadata.tsv | awk -F'\t' '{print $1"\t"$2" "$3}' > rename.tsv
tree-renamer -i results/tree/all_dist_nj.nwk -o nj_named.nwk -r rename.tsv
Open nj_named.nwk in FigTree or iTOL.
NJ and ME trees are unrooted: root them on the midpoint or on an outgroup in the viewer.
genome-comparator -i genomes -o results -t 8 --nj --me --pcoa --metadata metadata.tsv --color-by species --bootstrap 100
The sketches from step 2 are reused, and each of the 100 replicates re-sketches the genomes with a different hash seed. This takes under 2 minutes on 8 threads. The support values are written in the Newick files:
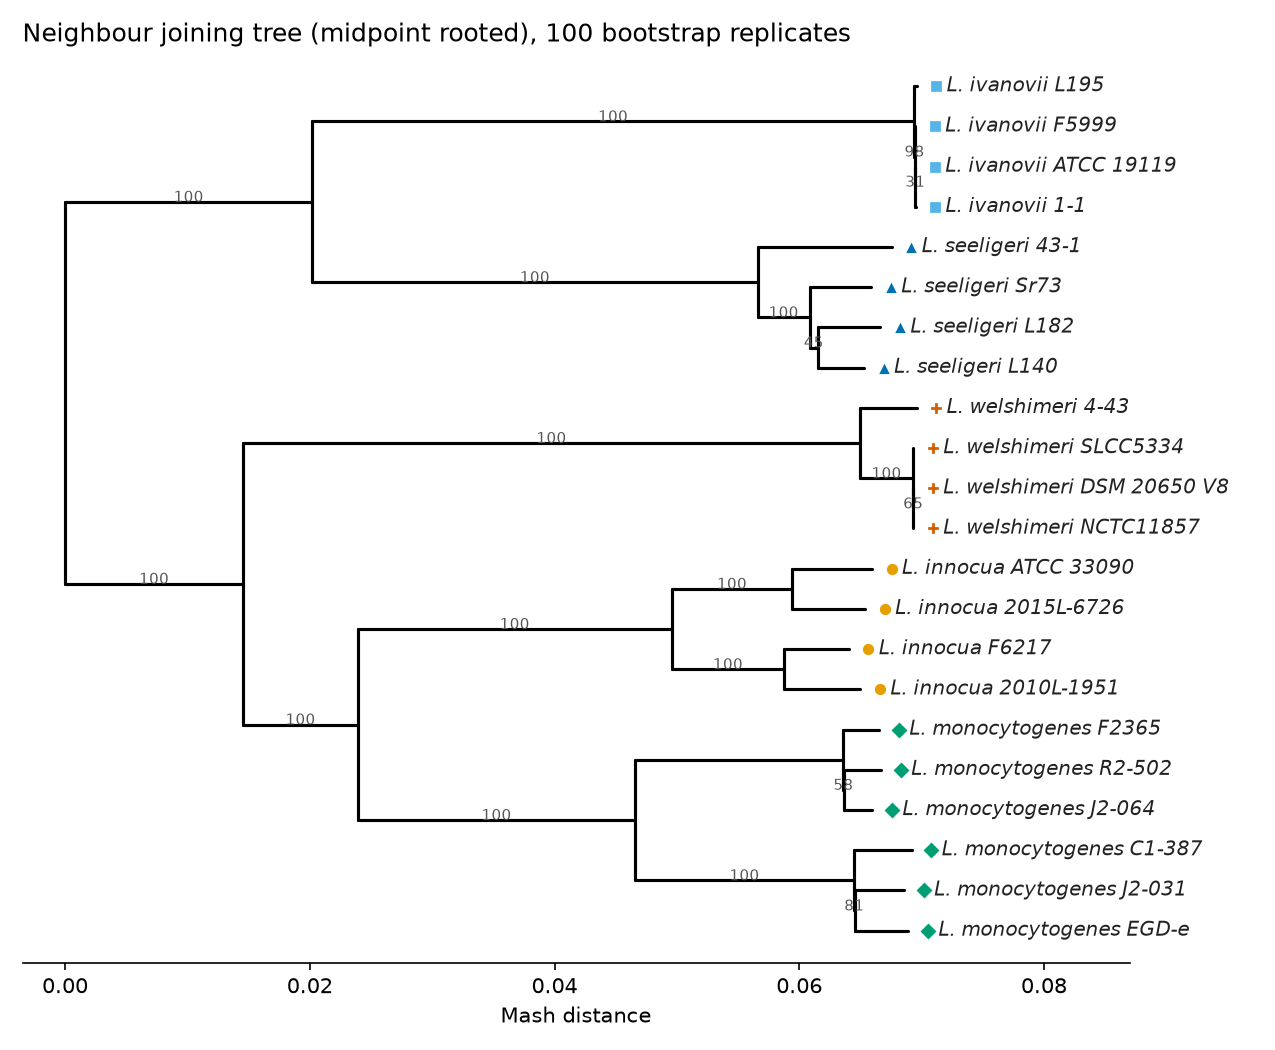
Every species is a clade with 100% support. Inside L. ivanovii and L. welshimeri, some strains are nearly identical, and the branching order between them gets low support (31–81%): the few k-mers that differ between them are not always in the sketch. That is the resolution limit of Mash; see Bootstrap support.
tree-collapser merges clades of near-identical genomes into a single tip, which helps with trees of thousands of
genomes:
tree-collapser -i results/tree/all_dist_hc.nwk -o collapsed.nwk -d 0.001
Here, 2 clades are collapsed (22 → 17 tips) at 0.001, and 7 clades (22 → 8 tips) at 0.01.
- Run it on your own genomes: see Usage for all options and input file naming.
- Learn what the distances mean and how far to trust them: How it works.