The graphical visualization and analysis tool is available in the companion Python package
embedded-etrace and can be easily installed.
Records named time spans (task activations, ISR executions) and point-in-time markers on bare-metal targets without a heap or OS.
Events are serialized as length-delimited protobuf frames that you forward over any byte transport — RTT, UART, USB, or a ring buffer for post-mortem analysis in the GUI.
TraceTransport is the low-level primitive: it receives a pre-constructed [TraceEvent] and
forwards it over your chosen transport. TraceSink is the recording layer built on top: it reads
the hardware clock and calls the record_* helpers.
Types that only move pre-built events (e.g., a downstream serialiser driven by a task queue)
implement TraceTransport alone. Types that also originate recordings implement both.
use execution_trace::{TraceTransport, TraceSink, TracingError, TraceEvent};

struct MyRttSink { /* ... */ }

impl TraceTransport for MyRttSink {
    fn write_event(&mut self, event: TraceEvent) -> Result<(), TracingError> {
        // encode and forward the event bytes over your chosen transport
        Ok(())
    }
}

impl TraceSink for MyRttSink {
    fn get_elapsed_nanoseconds(&self) -> u64 {
        0 // replace with your hardware timer
    }
}use execution_trace::{TraceSink, SourceType};
fn my_isr(sink: &mut impl TraceSink) {
// at priority 8, with a relative deadline of 10 ms from activation
sink.record_span_start("my_isr", SourceType::Isr, 8, Some(10.0)).ok();
// ... work ...
sink.record_span_end("my_isr").ok();
}
fn ukf_step(sink: &mut impl TraceSink) {
// with a payload of 3 (e.g., an iteration counter value or similar)
sink.record_marker("predict", Some(3)).ok();
// ...
}Use [SequenceEncoder] when encoding events manually so the host can detect dropped frames:
use execution_trace::{SequenceEncoder, SourceType, TraceEvent, encode::MAX_TRACE_FRAME_SIZE};

let mut name = heapless::String::<32>::new();
name.push_str("my_task").unwrap();
let event = TraceEvent::SpanStart {
    timestamp_ns: 0,
    name,
    source_type: SourceType::Task,
    sequence: 0,
    priority: 4,
    relative_deadline_ms: None,
};
let mut enc = SequenceEncoder::new();
let mut buf = [0u8; MAX_TRACE_FRAME_SIZE];
if let Ok(n) = enc.encode(&event, &mut buf) {
    // forward buf[..n] over your transport (RTT, UART, USB, etc.)
    let _ = &buf[..n];
}use execution_trace::encode::decode_trace_frame;
// raw_bytes arrives from your transport (RTT, UART, file, etc.)
let (event, consumed) = decode_trace_frame(raw_bytes).unwrap();Each frame is a standard protobuf length-delimited record:
[ varint: payload byte count ][ protobuf-encoded TraceEvent ]
Maximum frame size is [encode::MAX_TRACE_FRAME_SIZE] (128 bytes). Name strings are capped at 32 bytes;
longer names cause record_* to return [TracingError::MessageDropped] before sending.
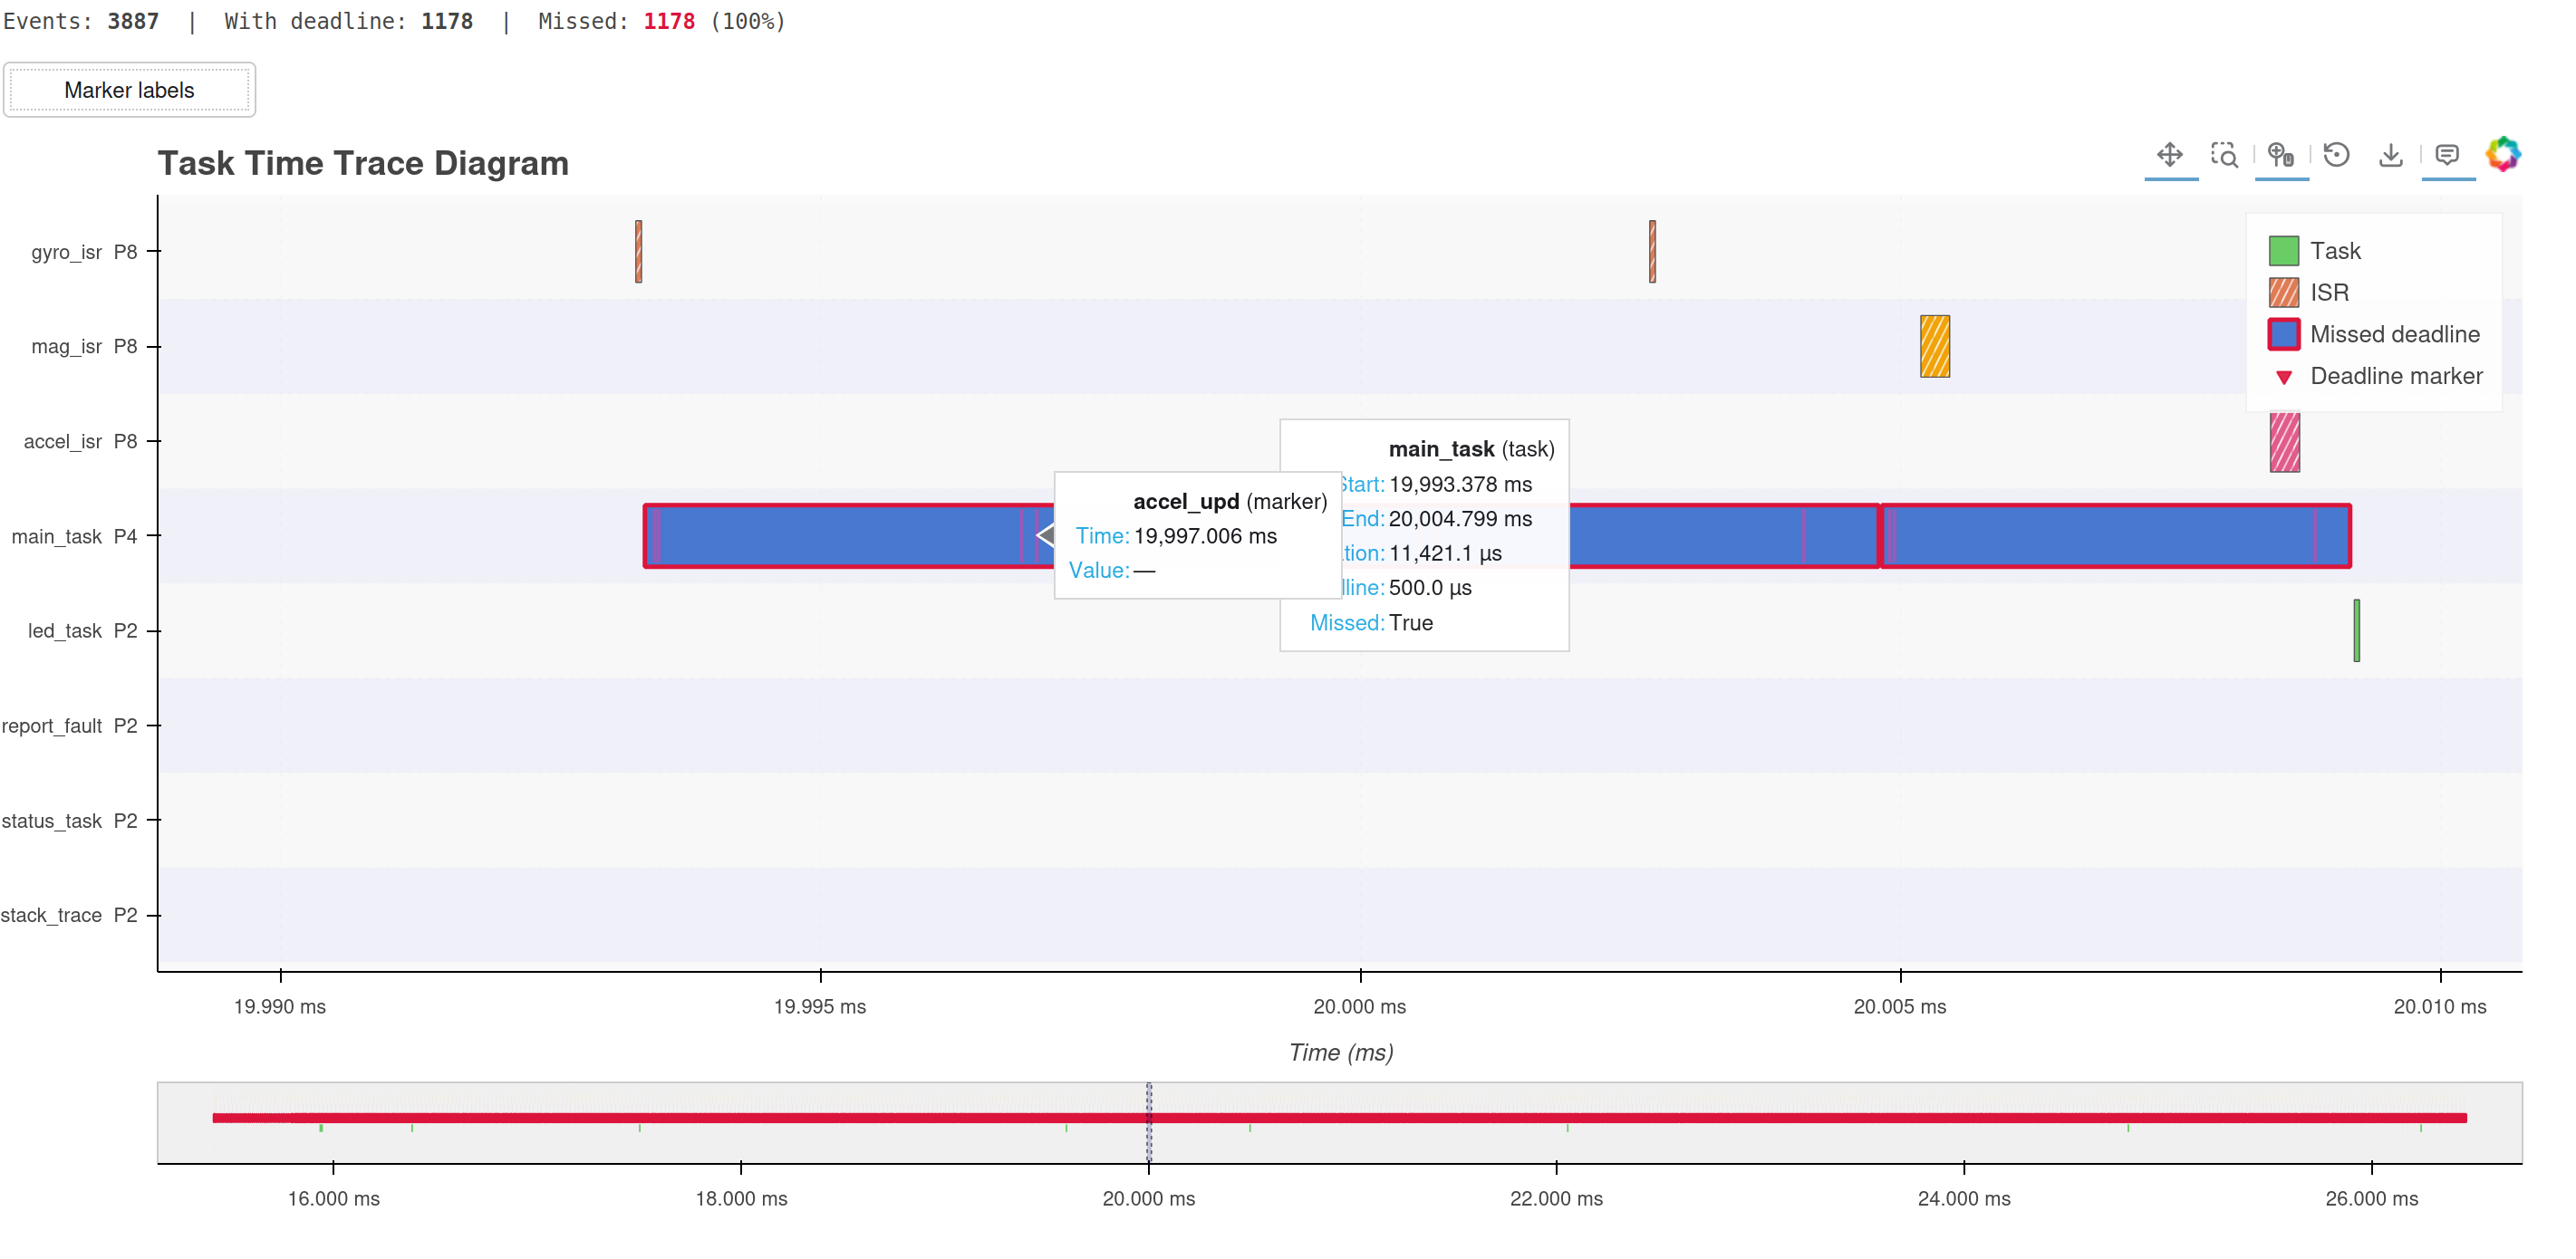
The companion Python package embedded-etrace decodes the binary stream, matches span start/end pairs,
and renders a zoomable Bokeh timing diagram as a standalone HTML file. The intermediate format is
a CSV with columns name, type, start_us, end_us, priority, deadline_us, and value.
The examples/ directory contains a self-contained simulation that demonstrates the full
workflow without any hardware:
# 1. Install the Python package with diagram support
pip install embedded-etrace[diagram]

# 2. Simulate an embedded trace and write it to trace.bin
cargo run --example simulate --features std

# 3. Decode the binary trace and render an interactive HTML timing diagram
python examples/visualize.py
simulate records two control-loop iterations — a gyro_isr (ISR, priority 8) and a
control_task (task, priority 4) with ukf_predict/ukf_update markers — where the
first iteration meets its deadline and the second misses it. visualize.py reads
trace.bin, writes a temporary CSV, and produces diagram.html that you can open in any
browser.
Both scripts accept --help for available options (e.g. --input, --output, --title
for visualize.py).
The crate is no_std by default. Enable the std feature for tests:
[dev-dependencies]
execution-trace = { version = "0.1", features = ["std"] }