Grafana 5.1.4, Elasticsearch datasource, Windows 7
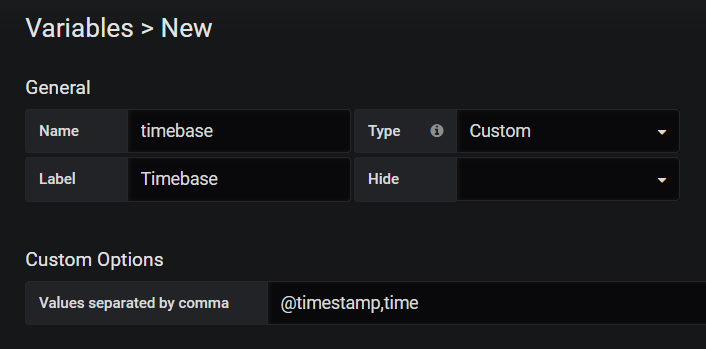
I'm looking to provide a dashboard control to select which time field in documents is used for date histograms. This seems straightforward by creating a template variable with a list of field names (@timestamp, time, startTime, endTime, firstSeen etc) and referring to it in the grouping clause of the query editor:

However, Grafana doesn't accept a variable entered here - it reverts the entry back to the default @timestamp value. Actually, it also reverts if I select another date-typed field like time here - so perhaps this selector box has a more generic issue than templating. Should a variable be usable here?
(I've verified that when the /api/datasources/proxy/6/my-index-*/_mapping XHR call is made, the returned mapping is showing 'date' type for both relevant fields, as might be expected seeing the autocomplete options.)
Grafana 5.1.4, Elasticsearch datasource, Windows 7
I'm looking to provide a dashboard control to select which time field in documents is used for date histograms. This seems straightforward by creating a template variable with a list of field names (@timestamp, time, startTime, endTime, firstSeen etc) and referring to it in the grouping clause of the query editor:
However, Grafana doesn't accept a variable entered here - it reverts the entry back to the default @timestamp value. Actually, it also reverts if I select another date-typed field like time here - so perhaps this selector box has a more generic issue than templating. Should a variable be usable here?
(I've verified that when the
/api/datasources/proxy/6/my-index-*/_mappingXHR call is made, the returned mapping is showing 'date' type for both relevant fields, as might be expected seeing the autocomplete options.)