Dashboard
Canopsis WebUI is available through your navigator.
Fire up your prefered browser, enter the IP of the server Canopsis has been installed on, port 8082 and you should be able to access it. The default view, called Dashboard, is used to display the various components and resources reports. Although the preferred method to customise content shown by Canopsis is to create additional Views, it's also possible to modify Dashboard. Below I explain how to add a new widget on it. (figure 1 shows default dashboard, while figure 2 in contrast shows a customised one).
 figure 1 |
 figure 2 |
To start customizing Canopsis dashboard, click on the Build menu (see Figure 3) then choose "Edit active view".
Once in Edit mode you will be able to add and remove or customize any existing widgets.
To add a new widget, with the mouse click and select an empty area over the dashboard then release the button. (see Fig 4)
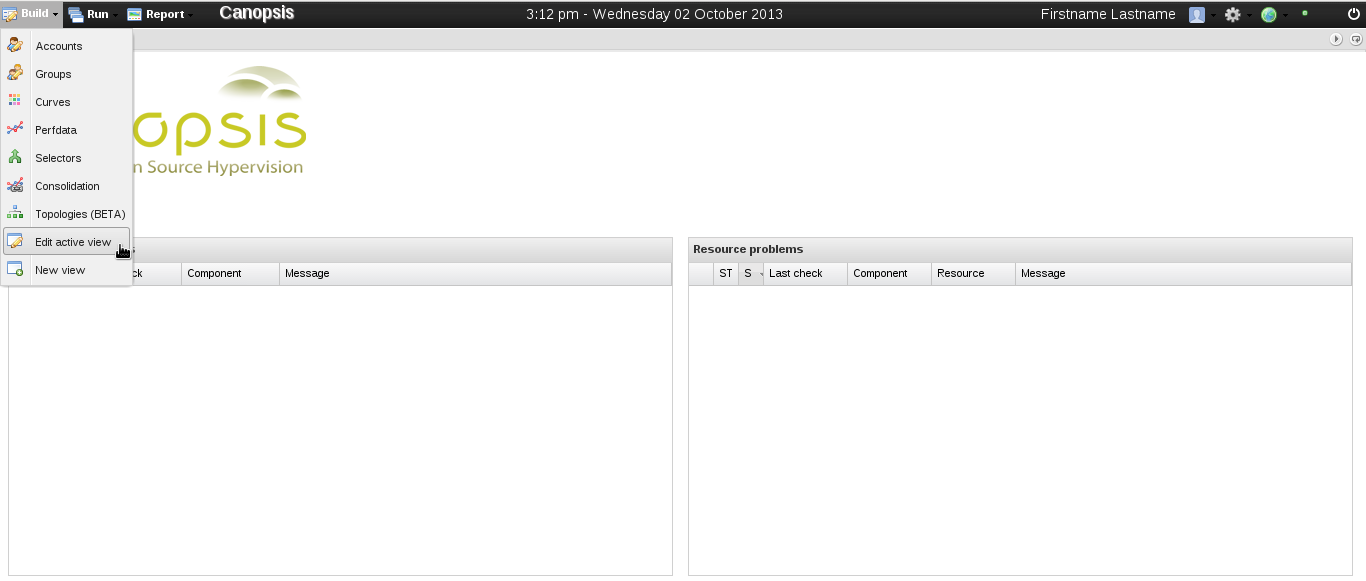 figure 3 |
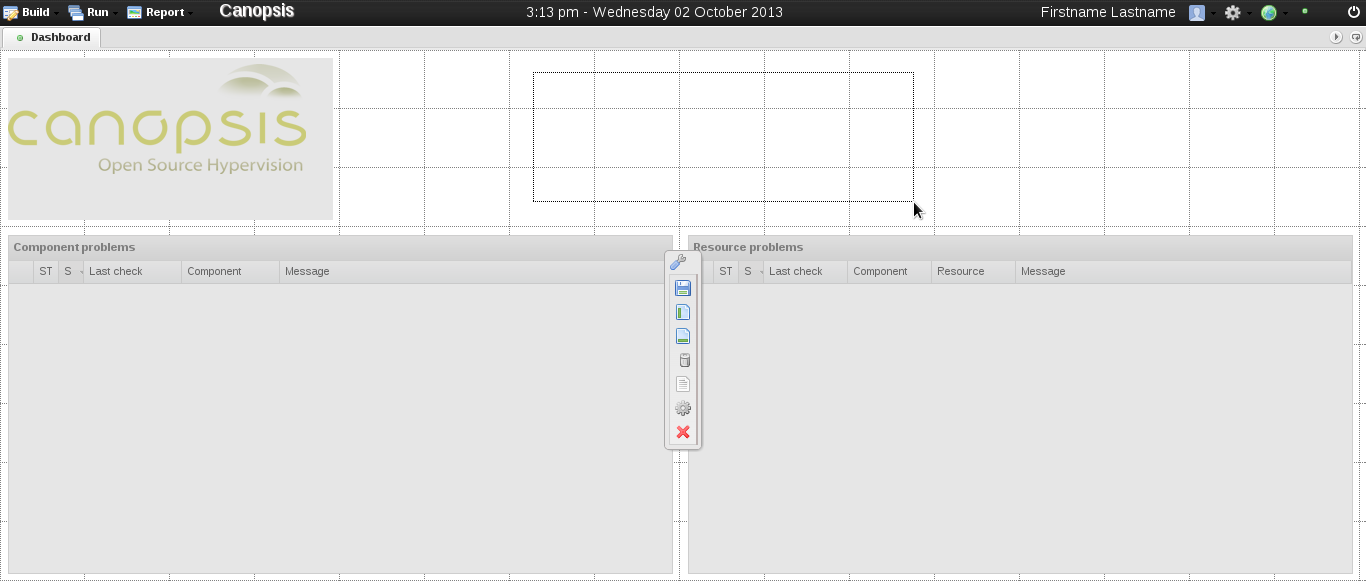 figure 4 |
A new widget dialog should popup, enter the necessary information click save on the bottom right corner of the dialog (see Fig 5 and 6).
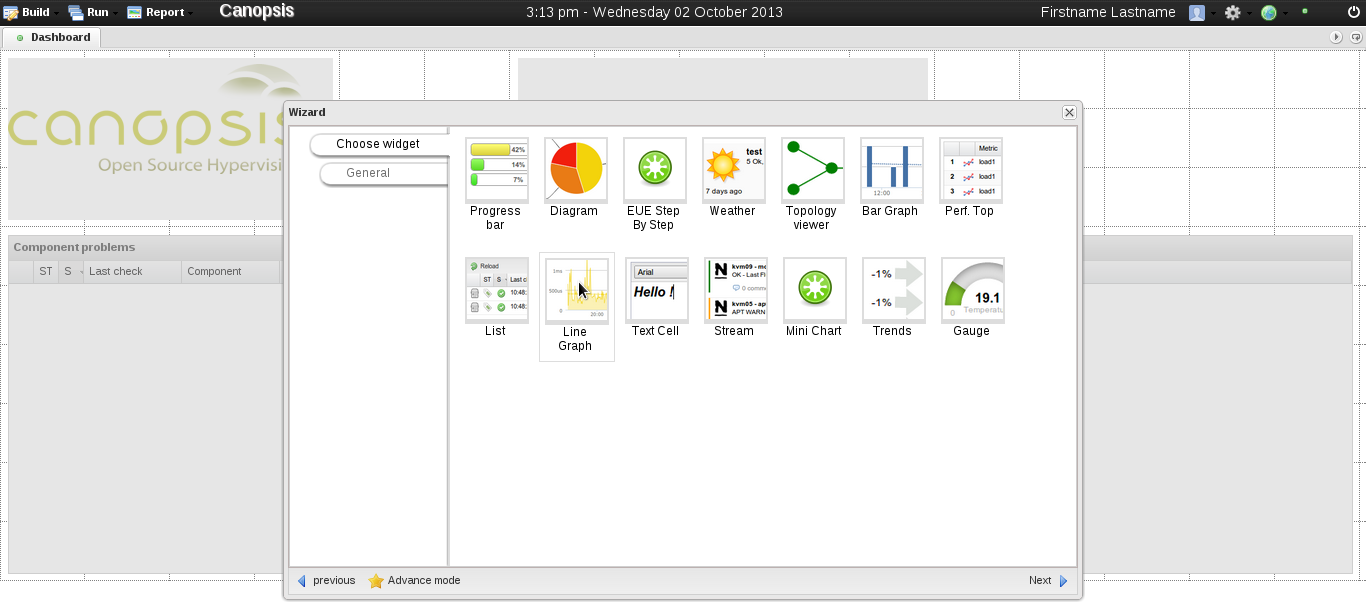 figure 5 |
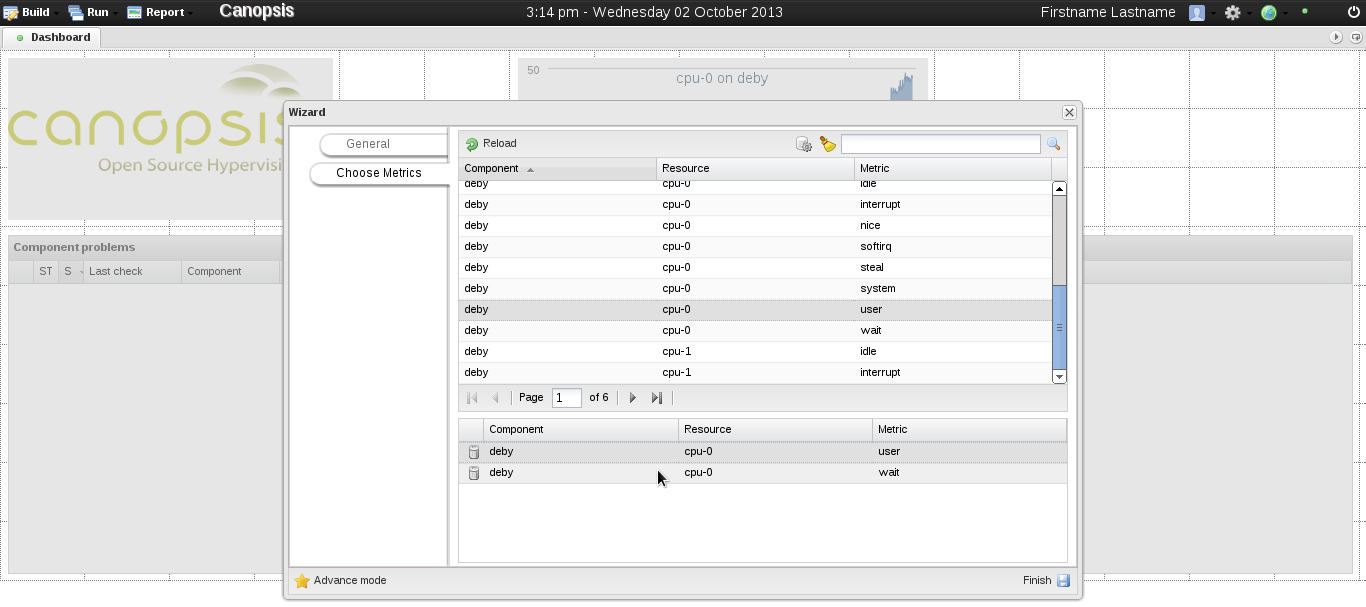 figure 6 |
Here we've added a new widget of type line-graph that's setup to display cpu charge history of system processes. Let's save the current view (figure 7) and see the result (figure 8). Please refer to dedicated wiki pages for detailed info over the different types of widgets and existing metrics.
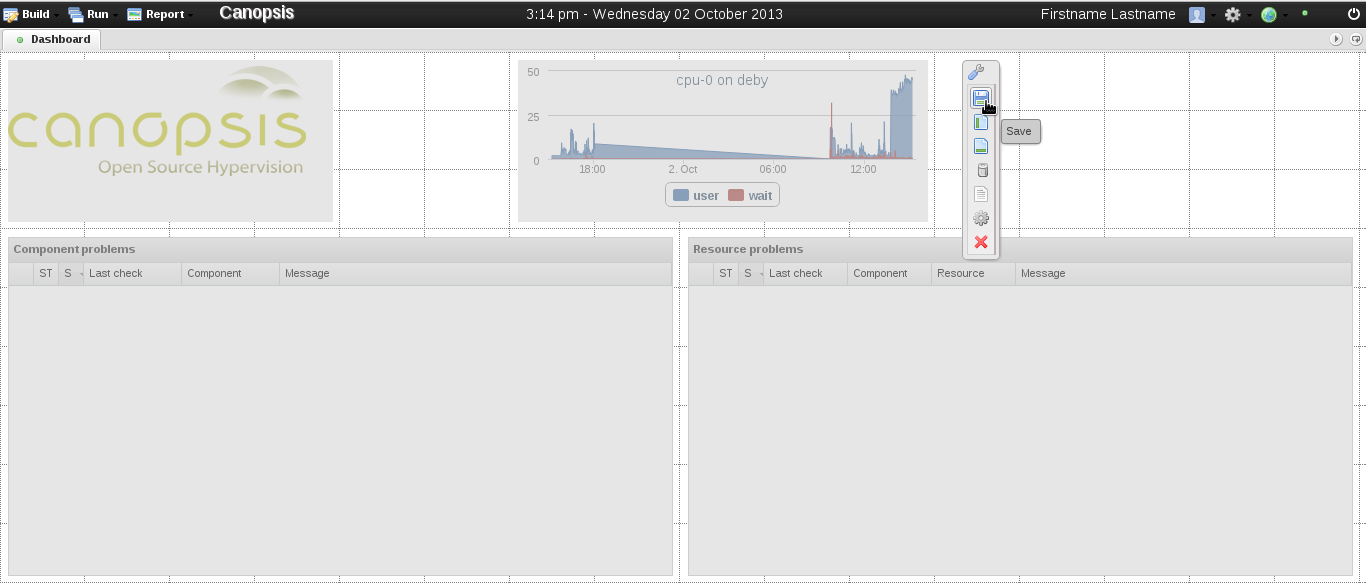 figure 7 |
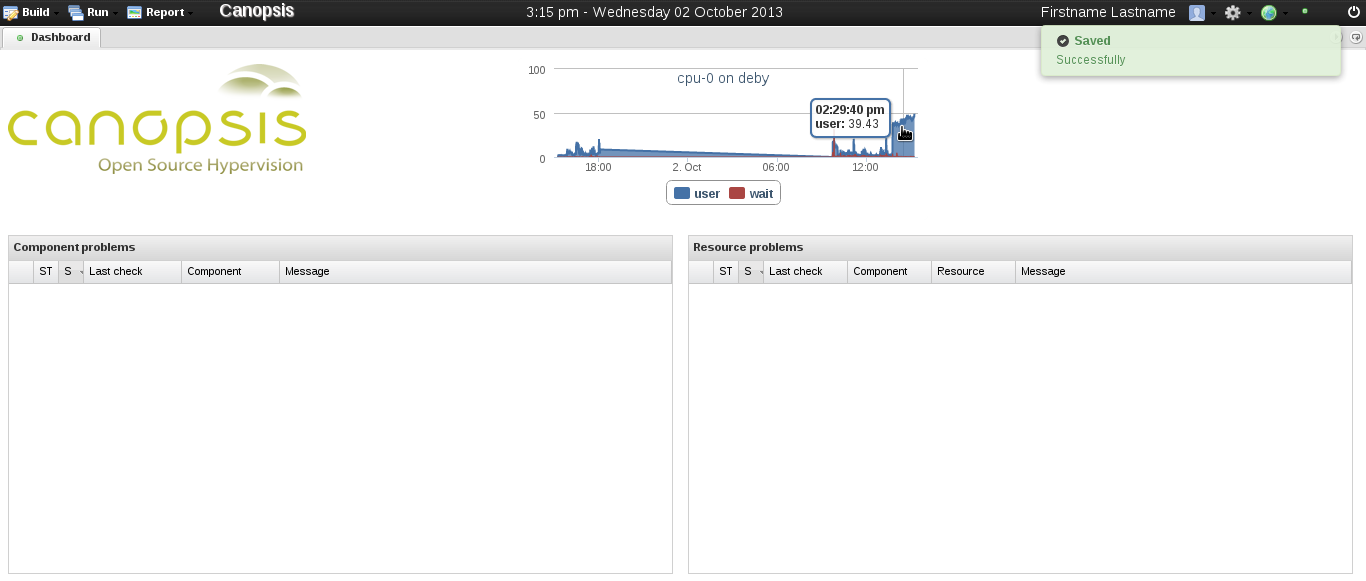 figure 8 |