Repository navigation
Reports
The report pages show your traffic for a date range: how many people came, what they read, where they came from, who they are and what they did. They share one header, one chart component and one table component, so they all work the same way.
- Open the plugin in the admin and start on Overview.
- Pick a range in the header (for example Last 30 days) and, if you want, a comparison.
- Click metric cards to choose the lines on the chart.
- Click any value in a table (a page, a channel, a country) to add it as a filter. The whole page, and every other page, then shows only matching sessions.
- Move to Pages, Sources, Audience or Behaviour. The range, comparison, filters and site come with you.
- Use the panel menu of a table to export it or to pick columns.
Every report page has the same header controls:
| Control | What it does |
|---|---|
| Site | Choose the site. Shown only when client or connected sites exist. See Multi-Site and Sites View. |
| Range | Presets Today, Yesterday, Last 7 days, Last 30 days (default), Last 90 days, Last 12 months, Month to date, Year to date, or two custom days. Every preset ends today in the site time zone. |
| Comparison | Off, previous period, same period last year, or another segment. |
| Segment | Apply a saved segment, or save the current filters as a segment ("Save as segment"). |
| Filters | The filter bar. See Filters and Segments. |
On a narrow screen the header collapses to one summary line (site, range, comparison, segment, number of filters) that opens the controls.
The range, comparison, filters and site carry over between admin pages for the browser session. Filter Overview to "Organic Search", open Sources, and Sources shows organic search too. Closing the browser tab resets the view to the default.
Every view is also a link: the range, filters, comparison, segment and site are in the query string, so you can copy the address and send it to a colleague. Tabs are in the URL too, so the browser's Back button returns to the previous tab.
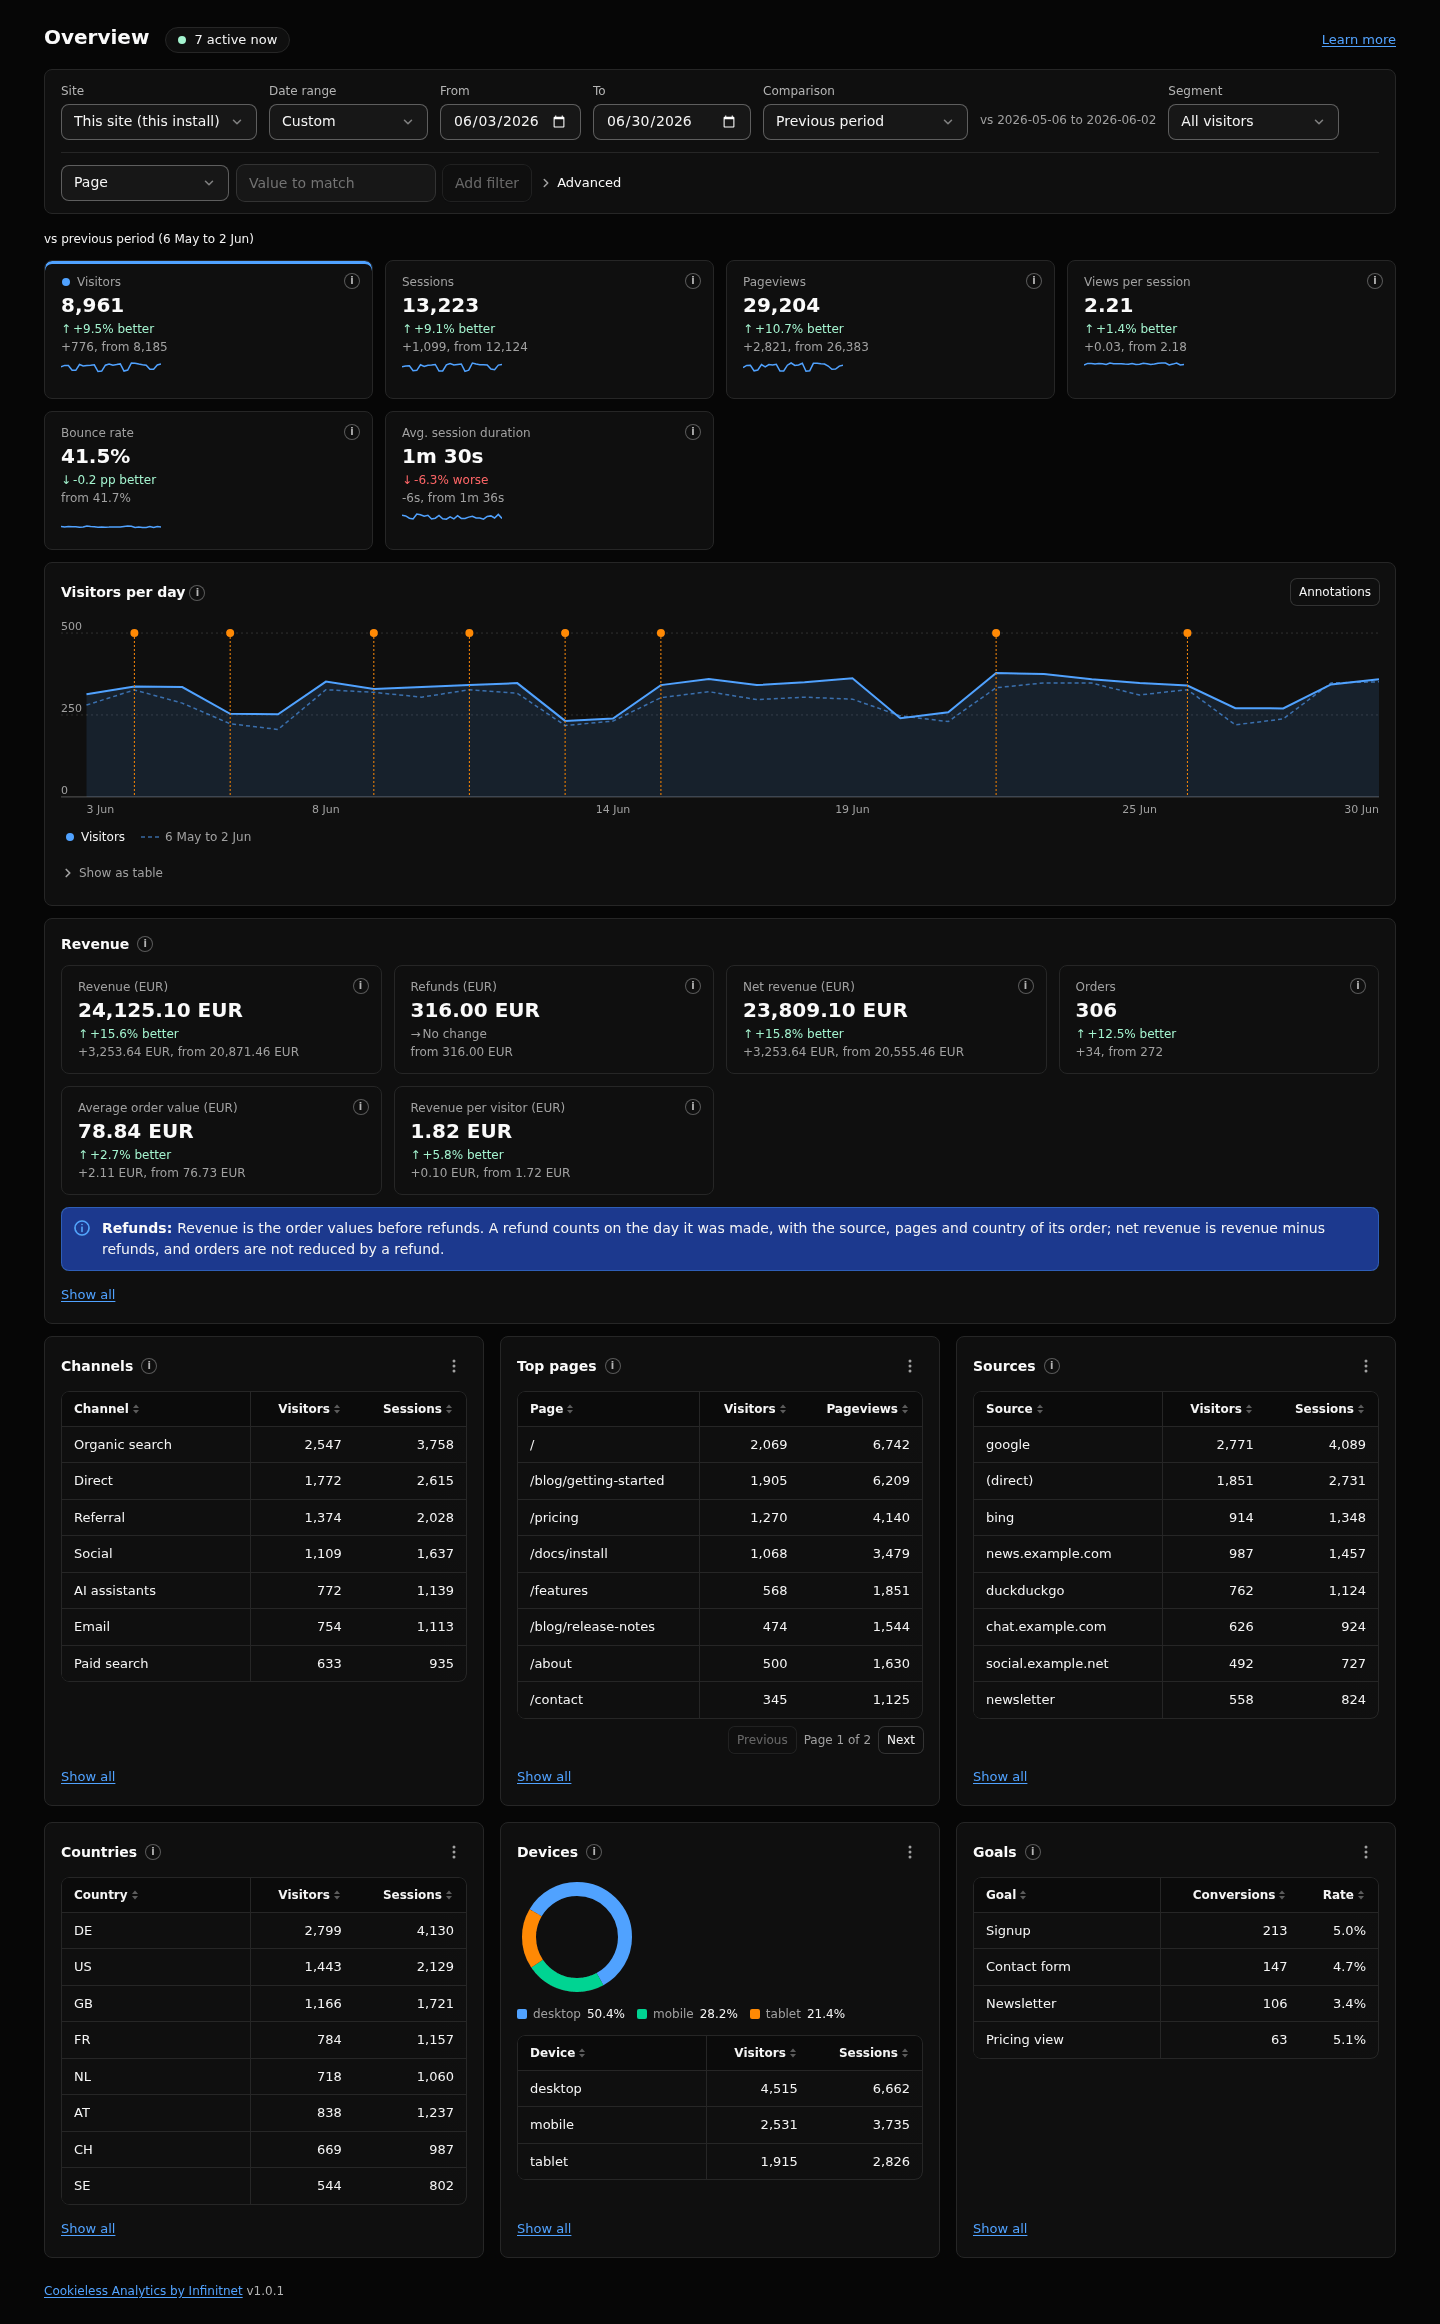
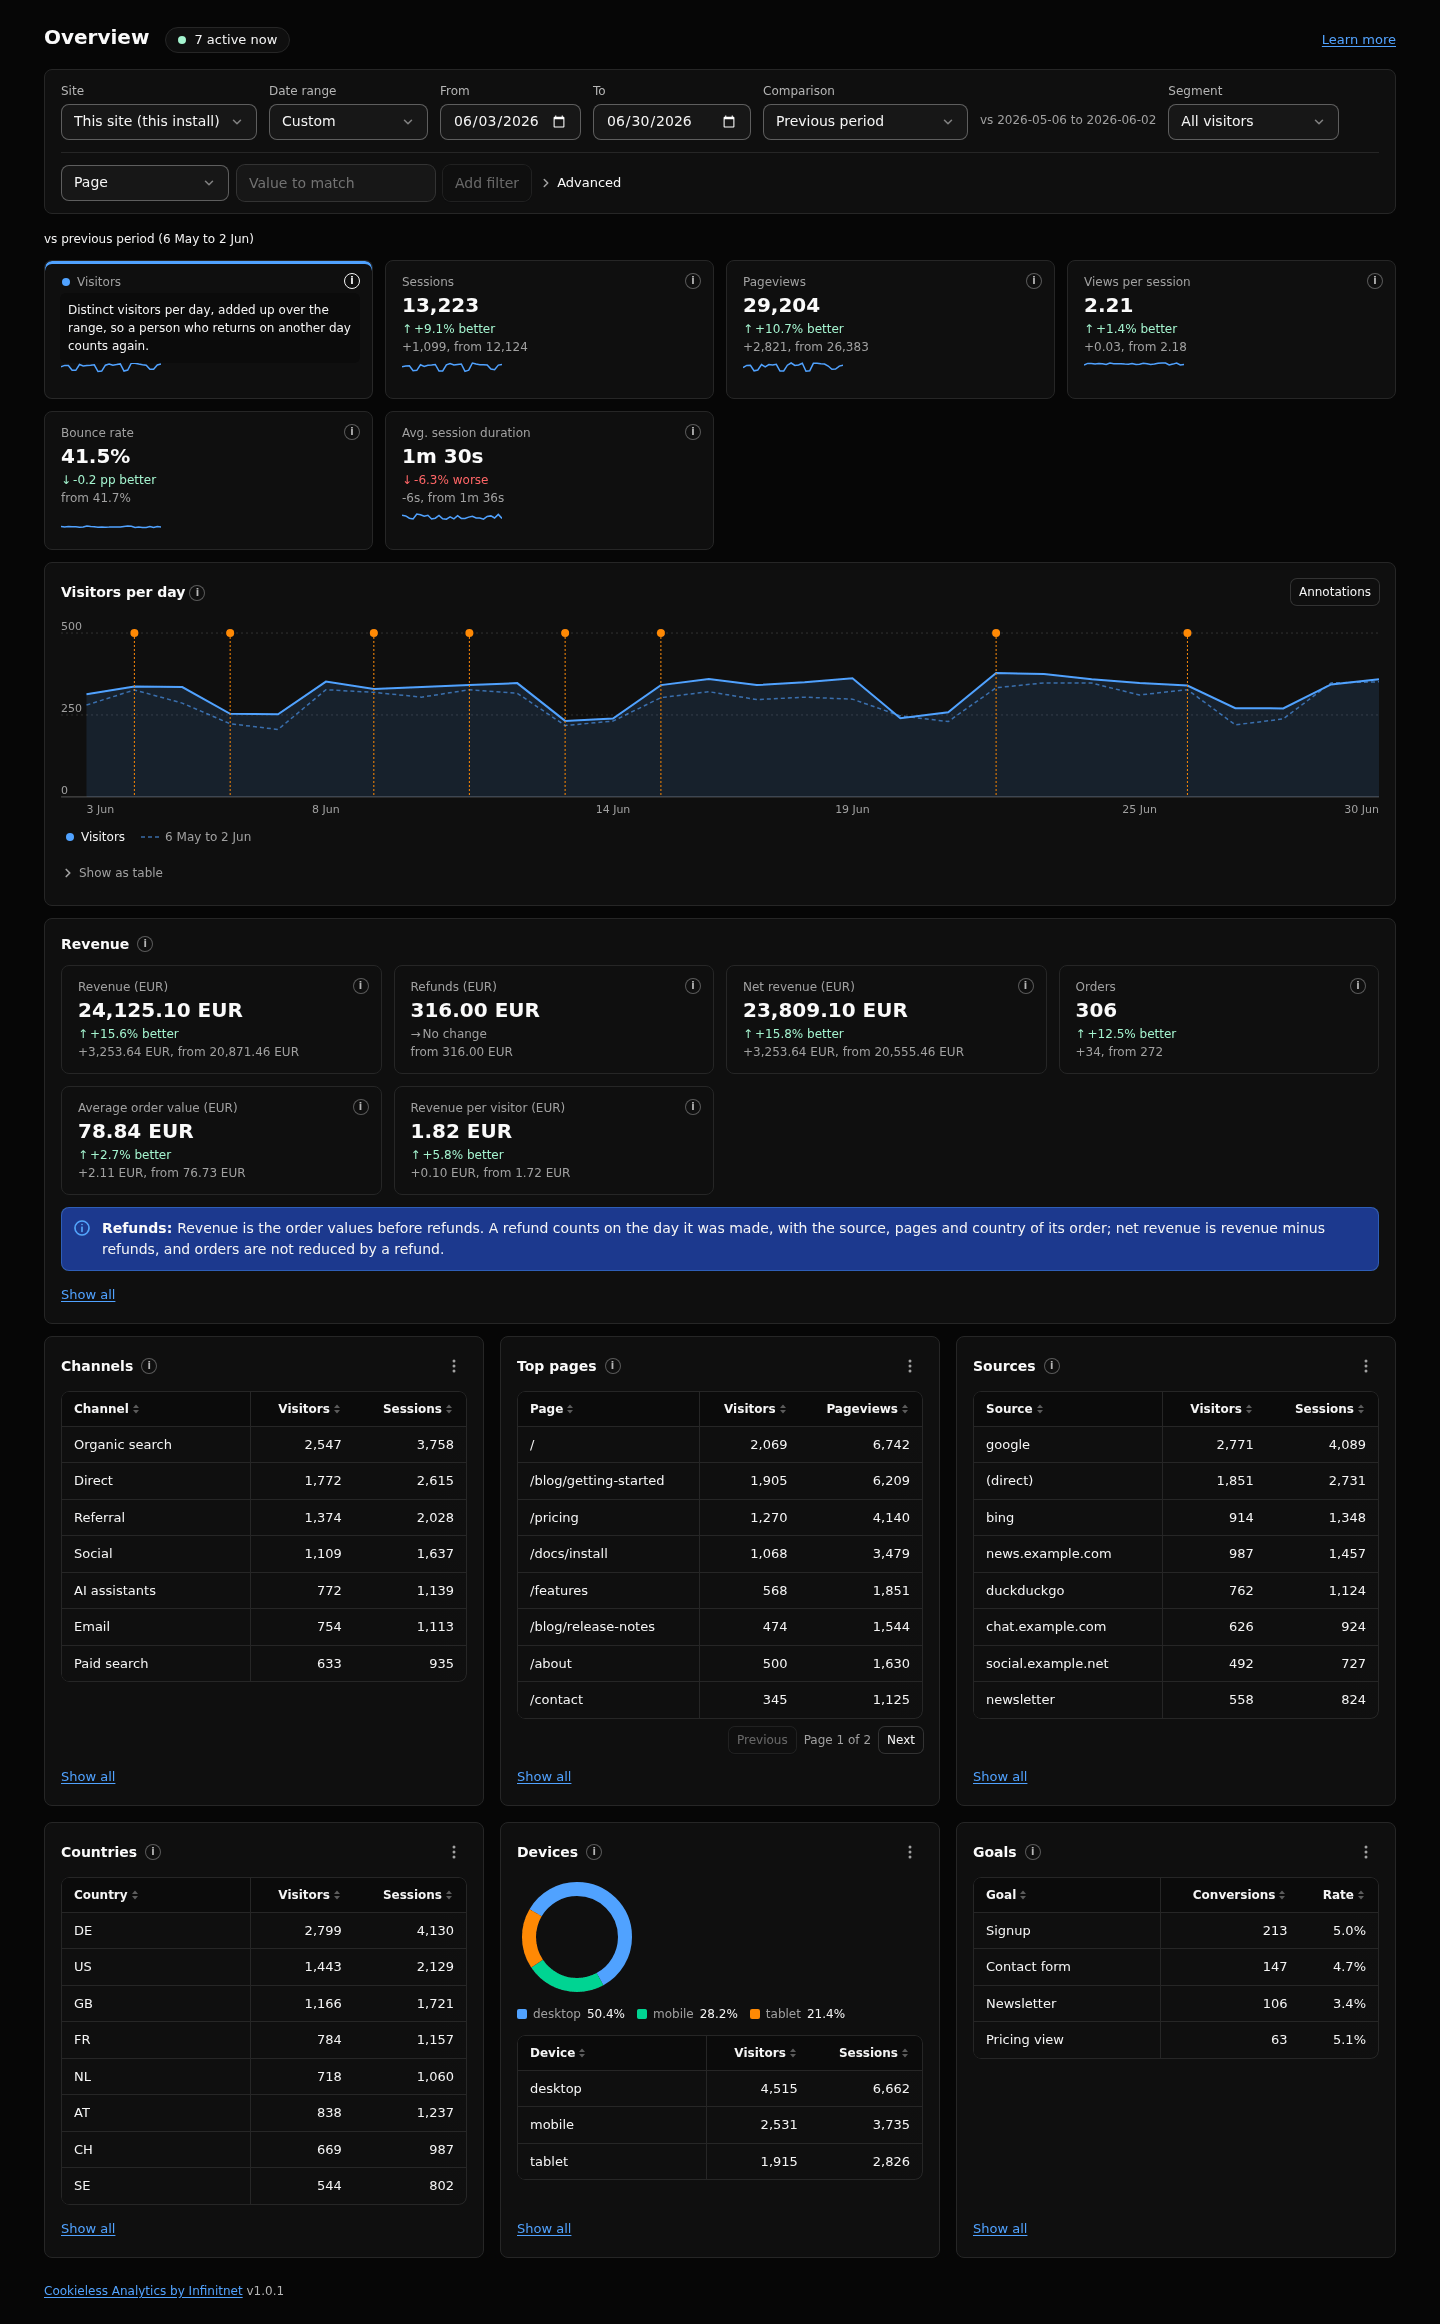
- Metric cards: Visitors, Sessions, Pageviews, Views per session, Bounce rate and Avg. duration, each with the change against the comparison. A click on a card turns its line on the chart on or off.
- Info markers: the small "i" on a card or panel opens the definition of its number.
-
Active now: a live badge in the page head with the sessions seen within the realtime window (
realtimeWindowMinutes, default 5). - Revenue strip: revenue, orders, average order value and revenue per visitor, shown only when the site has recorded orders. See Revenue and Refunds.
- Panels: Channels, Top pages, Sources, Countries, Devices (with a donut) and Goals, top 8 each. Click a value to filter. The panel menu lists more columns, off until you switch them on: Bounce rate, Avg. duration, Pageviews, Views per session and Engaged rate on the session panels; Avg. active time, Avg. visible time, Exit rate and Median scroll on Top pages; Completions on Goals. Each panel keeps its own choice in this browser.
- Annotations: markers on the chart. The Annotations button hides them. See Annotations and Impact.

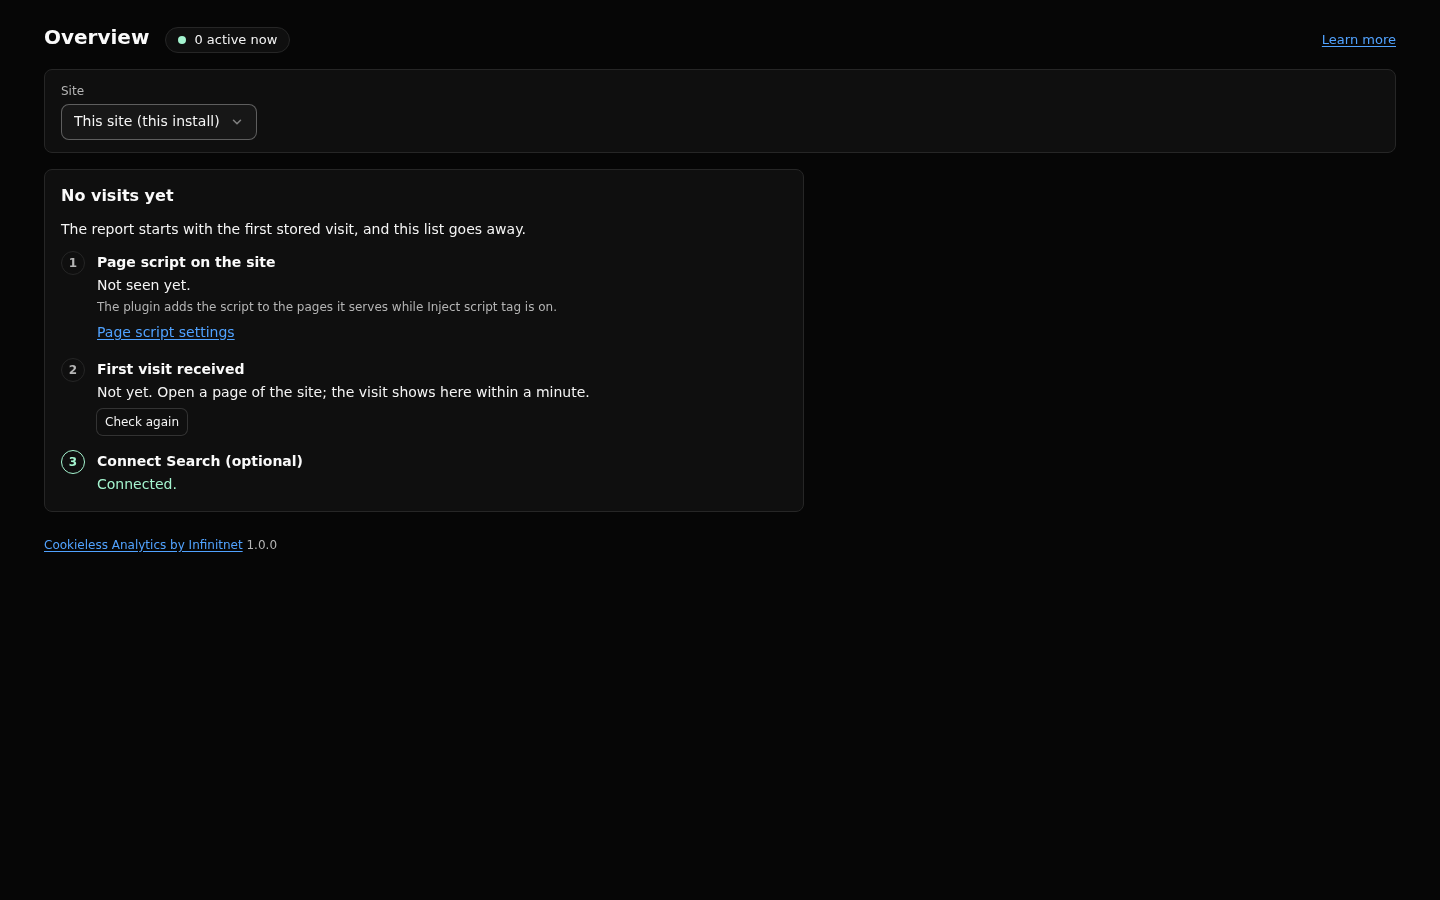
First run. Before the site has recorded any visit, the Overview shows a first run panel instead of empty charts, with the steps to get the page script running and a way to check that it works.
With "All sites" selected in the site select, the Overview shows the All sites table instead. See Multi-Site and Sites View.
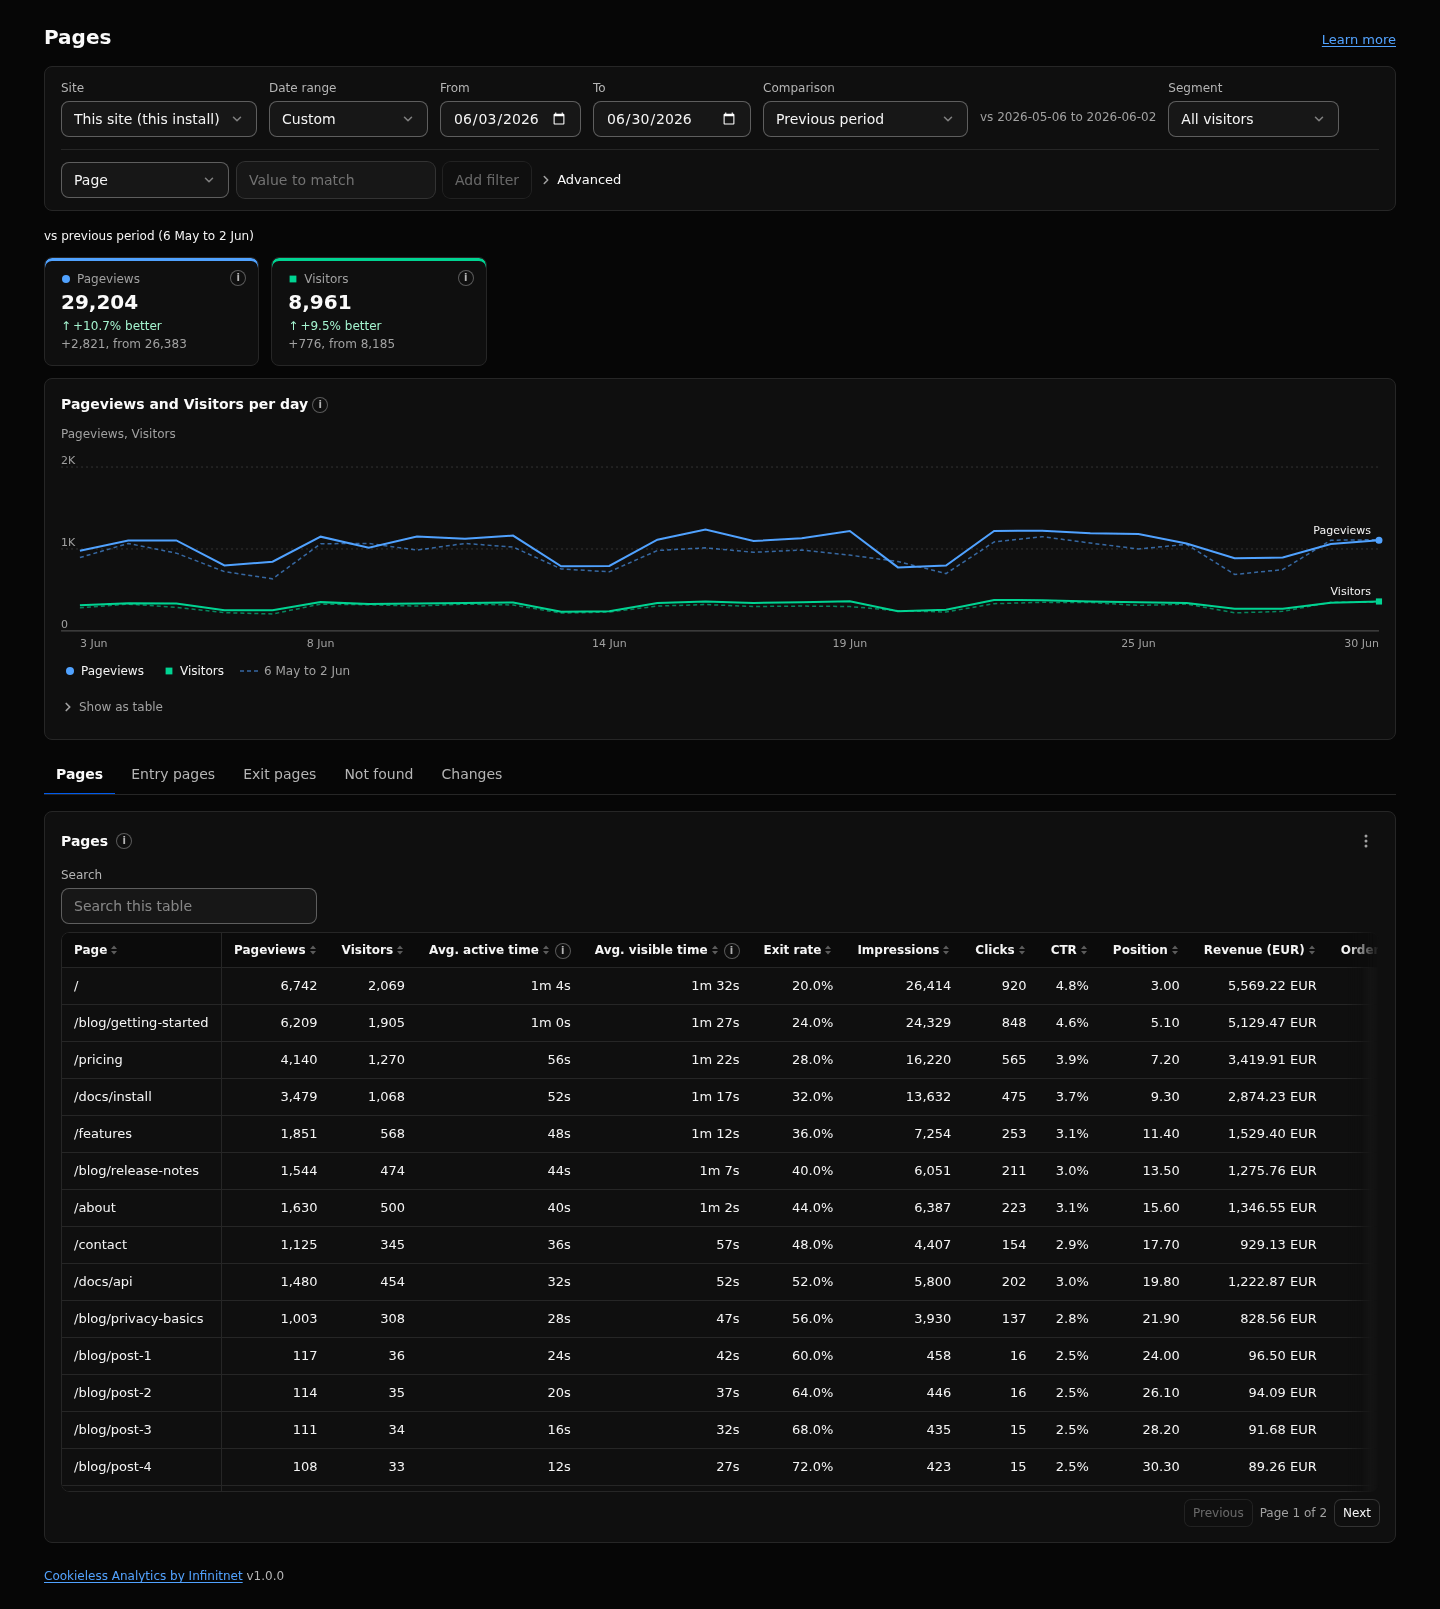
A trend chart with cards for pageviews and visitors per day, above the tabs Pages, Entry pages, Exit pages, Not found and Changes (pages rising and declining by page views). The Pages table shows pageviews, visitors, Avg. active time (time with interaction, so an open but untouched page counts 0 s), Avg. visible time (time the page was in view, from detailed data only), and exit rate; Median scroll (%) is off until you switch it on in the panel menu; see Definitions. A page row opens its Search queries when a Search source is connected and mapped. The Pages table has a column picker in the panel menu: Search columns (impressions, clicks, CTR, position) and Revenue columns are hidden unless a source is connected or orders exist, and one click adds them.
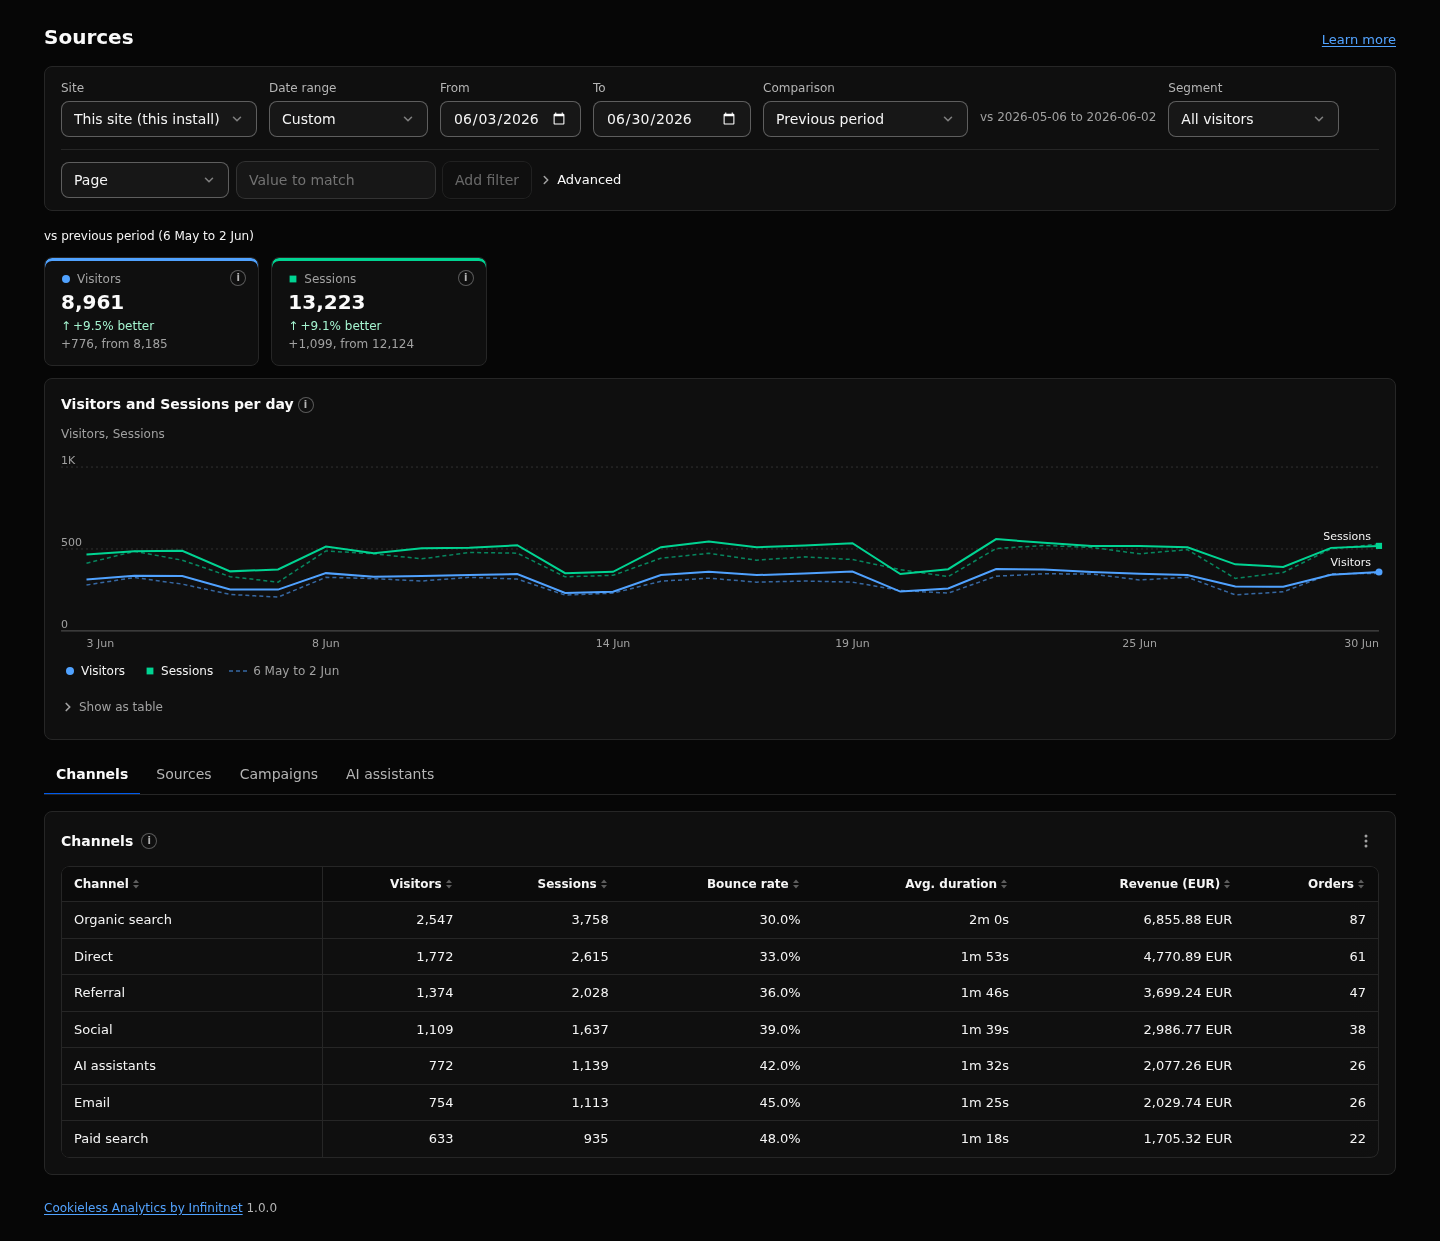
A trend chart with cards for visitors and sessions, above the tabs Channels, Sources, Campaigns (switch between the UTM fields Campaign, Source, Medium, Term and Content) and AI assistants (visits referred by AI assistants). How channels are assigned: How Visits Are Counted.
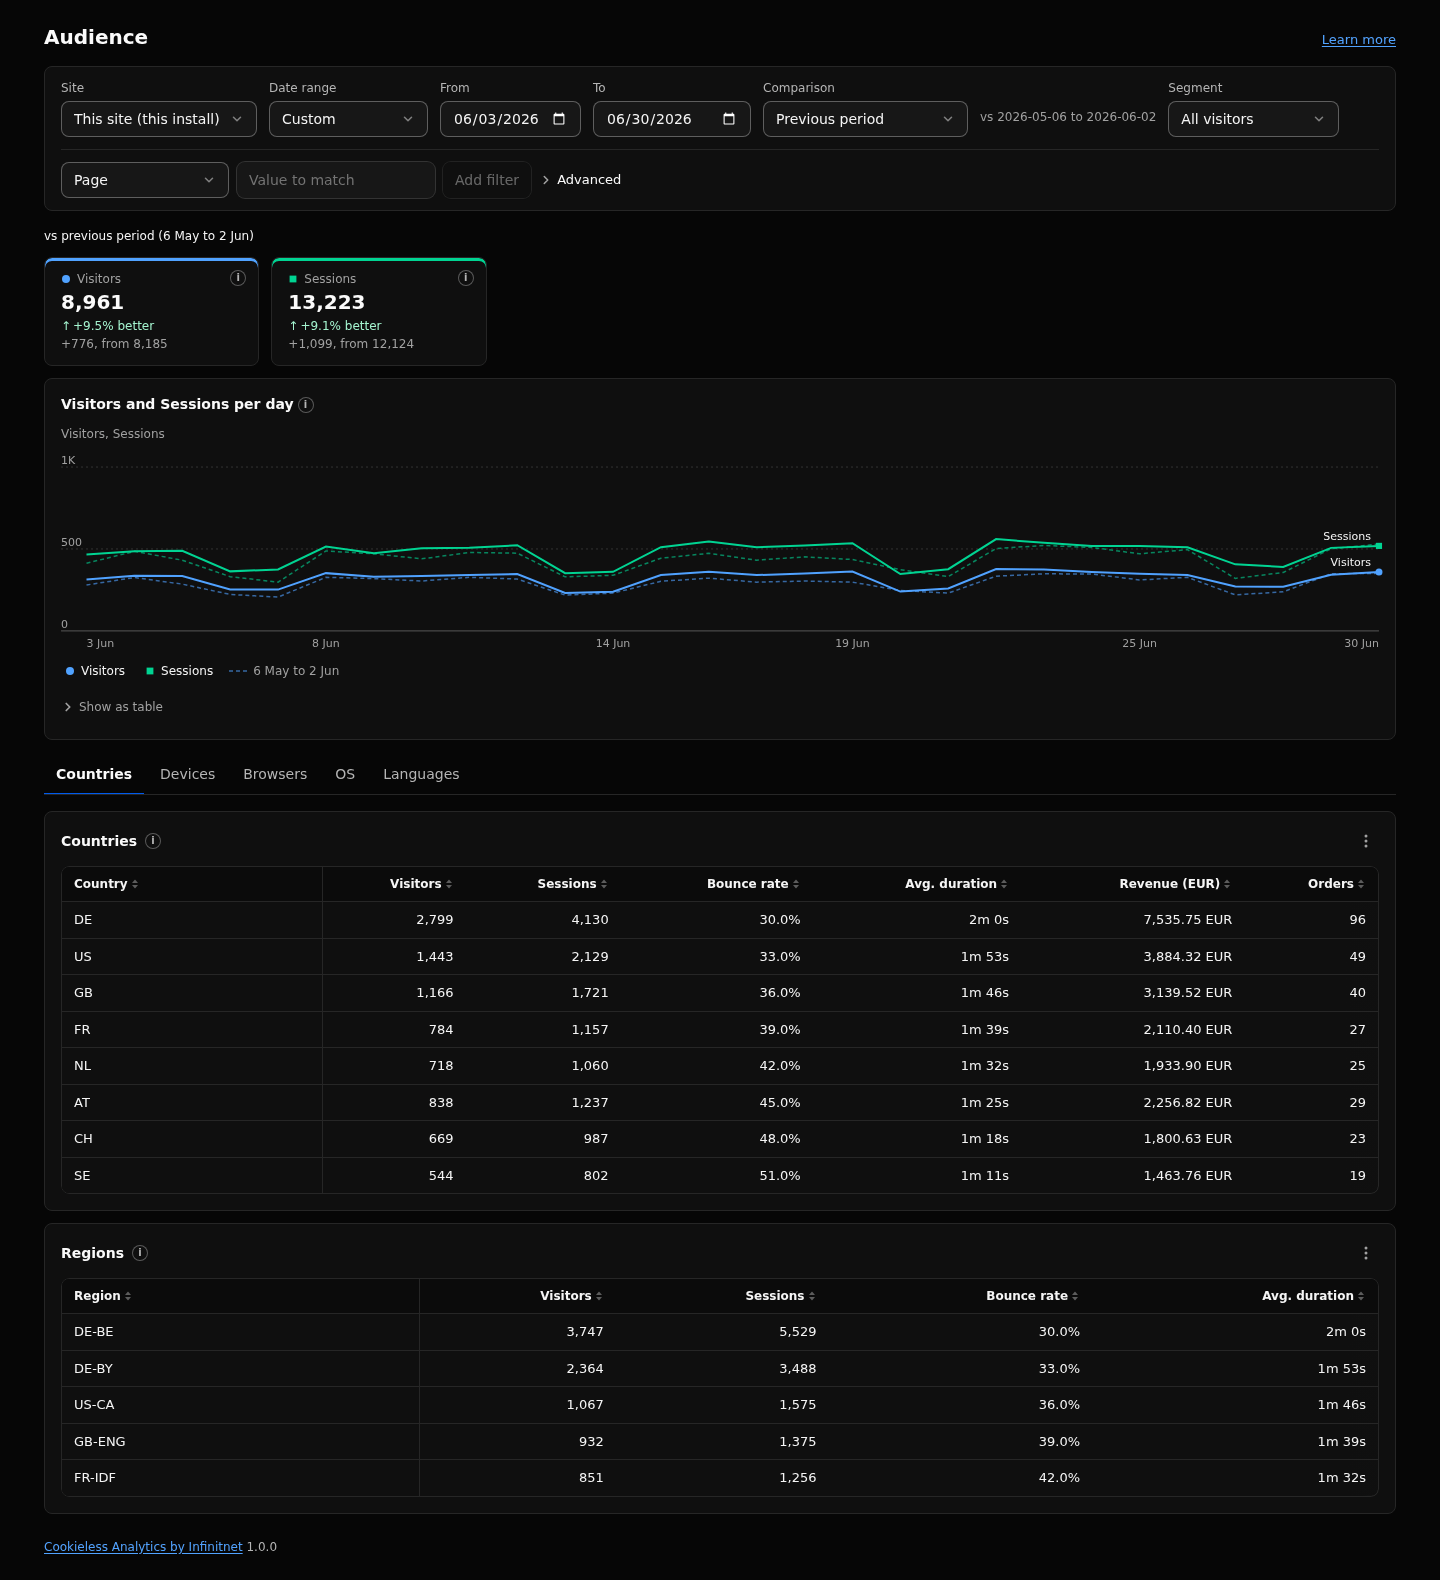
A trend chart with cards for visitors and sessions, above the tabs Countries (with a Regions table, filled only when captureRegion is on), Devices, Browsers, OS and Languages.
Tabs Events, Goals, Revenue, Funnels, Journeys, Site search, Outbound, Downloads, Forms and Scroll. See Goals and Funnels, Events, Revenue and Refunds and Content and Site Search.
Search Satisfaction, Links and Search have their own pages: Search Satisfaction, Links Report, Search Integrations.
Overview, Pages, Sources, Audience, Search Satisfaction, Search, Revenue and Links use metric cards that toggle the lines of one chart.
- Up to 4 metrics at once.
- At most 2 scales (for example a count on the left and a percentage on the right). A click that would need a third scale is refused with a hint: "These metrics use two scales already. Turn one off first."
- At most 2 metrics while a comparison is on (each has a dashed comparison line), and at most 2 on a small screen.
- One metric always stays on.
- Shift click or Alt click on a card shows that metric alone.
- Your choice of metrics is remembered in this browser.
Keyboard on the chart. Focus the chart, then use Left and Right to move one point, Page Up and Page Down to move 7, Home and End for the first and last point, and Escape to clear. The values of the point are read out to screen readers.
Show as table. Under every chart, "Show as table" opens the values as a table with a Date column and one column per line (and per comparison line).
- Click a value to add it as an
isfilter. "(not set)" values cannot be clicked. - Sort by a column header; long tables are paged.
- A table with more than one page of rows has a search box above it that keeps the rows whose text columns contain what you type, in any case; when the report has more rows than it loaded, the search covers the rows shown, so narrow the range or add a filter to search the rest. A new range, filter or report clears it.
- Panel menu (the button at the top right of a panel): Export CSV, Export JSON, and the column picker, which lists every column the table has data for. Optional columns start off: the session breakdowns (Channels, Sources, Campaigns and the Audience tabs) offer Pageviews, Views per session and Engaged rate, Entry pages offers Views per session and Engaged rate, AI assistants offer Bounce rate, Avg. duration and Pageviews, Search Satisfaction offers Avg. active time and Measured sessions, and the Revenue panels offer Visitors and Sessions. Your column choice is remembered per table in this browser; hiding every column but the name shows the default set again.
- The export runs the same report with the header range, segment and filters.
| Key | Default | What it does |
|---|---|---|
siteTimezone |
UTC | Time zone of days, hours and range presets. |
realtimeWindowMinutes |
5 | Window of the Active now badge. |
captureRegion |
false | Fills the Regions table on Audience. |
rawRetentionDays |
760 | Days of detailed data; older ranges use daily summaries. |
- A range is at most 1,000 days.
- Up to 4 metrics on a chart, 2 scales, 2 metrics with a comparison.
- Overview panels show the top 8 rows.
- An export is capped at 10,000 rows.
- Visitors over several days are the sum of daily visitors. See How Visits Are Counted.
- Ranges before the detailed data window, or very long ranges, are answered from daily summaries. Some filters then do not apply; the chip is struck through and the reason is named. See Filters and Segments.
- Hourly charts over summary data show days instead.
- Today and yesterday are always computed live, so figures for them can change as visits arrive.
- Revenue columns appear only when the site has orders; amounts of different currencies are never added together.