Time Charts
Chart.js time scales need a date adapter. The time chart sample imports a module that registers chartjs-adapter-date-fns, then configures the x-axis as a typed TimeCartesianAxis.
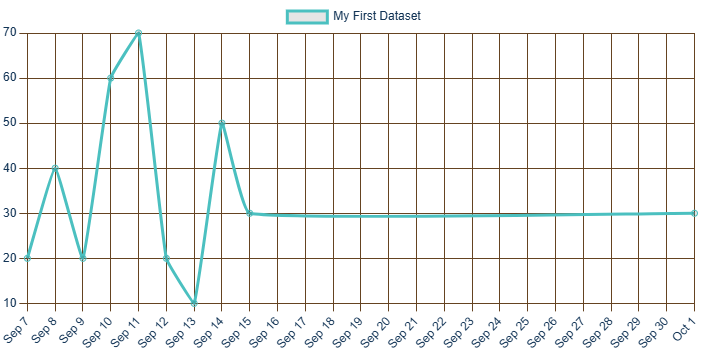
The line dataset can send XY objects where x is a date value and y is the plotted number:
new LineDataset
{
    Label = "My First Dataset",
    Data =
    [
        new { x = "2022-09-07", y = 20 },
        new { x = "2022-09-08", y = 40 },
        new { x = "2022-09-09", y = 20 }
    ]
}The sample imports its adapter helper and registers it when the chart reports initialization:
moduleTask = new(() => jsRuntime.InvokeAsync<IJSObjectReference>(
    "import",
    "./_content/pax.BlazorChartJs.samplelib/timeChart.js").AsTask());
private async Task RegisterPlugin()
{
var module = await moduleTask!.Value.ConfigureAwait(false);
await module.InvokeVoidAsync("registerPlugin").ConfigureAwait(false);
chartConfig.Options = new ChartJsOptions
{
Scales = new ChartJsOptionsScales
{
X = new TimeCartesianAxis
{
Type = "time",
Time = new TimeCartesianAxisTime { Unit = "day" }
}
}
};
chartConfig.ReinitializeChart();
}The adapter module itself can be small:
export async function registerPlugin() {
    await import('./chartjs-adapter-date-fns.bundle.min.js');
}
After the time axis exists, the sample changes the visible date range by setting timeAxis.Min and timeAxis.Max, then calling UpdateChartOptions().
- TimesChartComp.razor
- timeChart.js
- Time chart live sample - click Show Chart first.