Repository navigation
What it shows
Across the top, always in view: a strip when you pass a budget limit, a status line for all your repositories, then the tabs (Agents, Git, and New Relic if you use it). The board turns from tab to tab on its own; tap a tab to pick one, and tap Pin to stay on it.
Main, the merge queue, what is running, failures in the last day, and your dev and prod deploys. With several repositories it adds them up: Main says "3 of 6 green" and names the red one. Dev and Prod follow the first repository in your list.
Main is the latest finished run of a repository's gate workflow. A repository that names no gate workflow, or names one it does not have, gets Main from the runs its pushes to main started: red when the newest run of any of those workflows failed, green when all passed. When Main is not known, the line says why for each repository: "no gate run today" or "no push to main ran today".
When you set a budget limit and pass it, a strip under the header says so on every tab, such as "Claude spend this week $245.88 of $200". It stays until the day or week is over. One alert goes out for each limit you pass (see Alerts). Limits are set under Budget on the Settings page and need the archive; with a limit set and the archive off, the strip says no limit is checked.

One card per Claude Code or Codex session, on the machine that runs the board and on every machine connected to it, marked with that tool's icon and the repository it works in. Each card says whether the session is working (green), idle, or needs you (orange), plus how full its context is, its model and effort, lines added and removed, its helper agents, and its cost (Claude) or tokens and plan use (Codex).
A session on one of your other machines carries that machine's name. If the hub loses the link to a machine, its cards stay with their last status, marked stale with a dashed border, until the machine is back.

See Connecting other machines.
Two things get no card, because nobody is running them:
- A background Claude session that ended or was stopped. Claude Code can keep listing it for hours; the board shows a session only while it has a process, a status, or a question waiting on you.
- A chat the Codex app copied in from another tool. It gets a card once someone carries it on in Codex. See Codex.
When a session stops to ask you something, a banner runs across the screen and its card moves to the top. This works for Claude sessions on this machine and on your other machines, and for Codex sessions once the Codex hook is set up where Codex runs (see Codex). The board can also send you an alert (see Alerts).
The envelope button by the clock opens the mailbox: the few things the board needs you to decide. A number on the button says how many are waiting.
- A new machine wants to connect. It shows the machine's name and the code that machine shows, with Approve and Refuse. See Connecting other machines.
- Track a new repo? When someone works in a GitHub repository the Git tab does not follow, on the hub or on a connected machine, the mailbox asks once for that repository. Track adds it to the board's list and the Git tab picks it up. Ignore is remembered, so it never asks about that repository again. If the hub's GitHub login cannot see the repository, the item says so and offers only Ignore. The repositories you ignored are listed on the board's Settings page, each with Ask again.

Anyone who can open the board can read the mailbox. Deciding needs a browser on the hub's own machine, or the board password.
A column per repository, up to four across: its main, what is running, recent runs and a timeline of the last 6 hours. With more than four, the busiest get the columns (anything running or failed first, then the most recent run), and the rest sit below as one line each, under Quiet repos, until they run or go red.
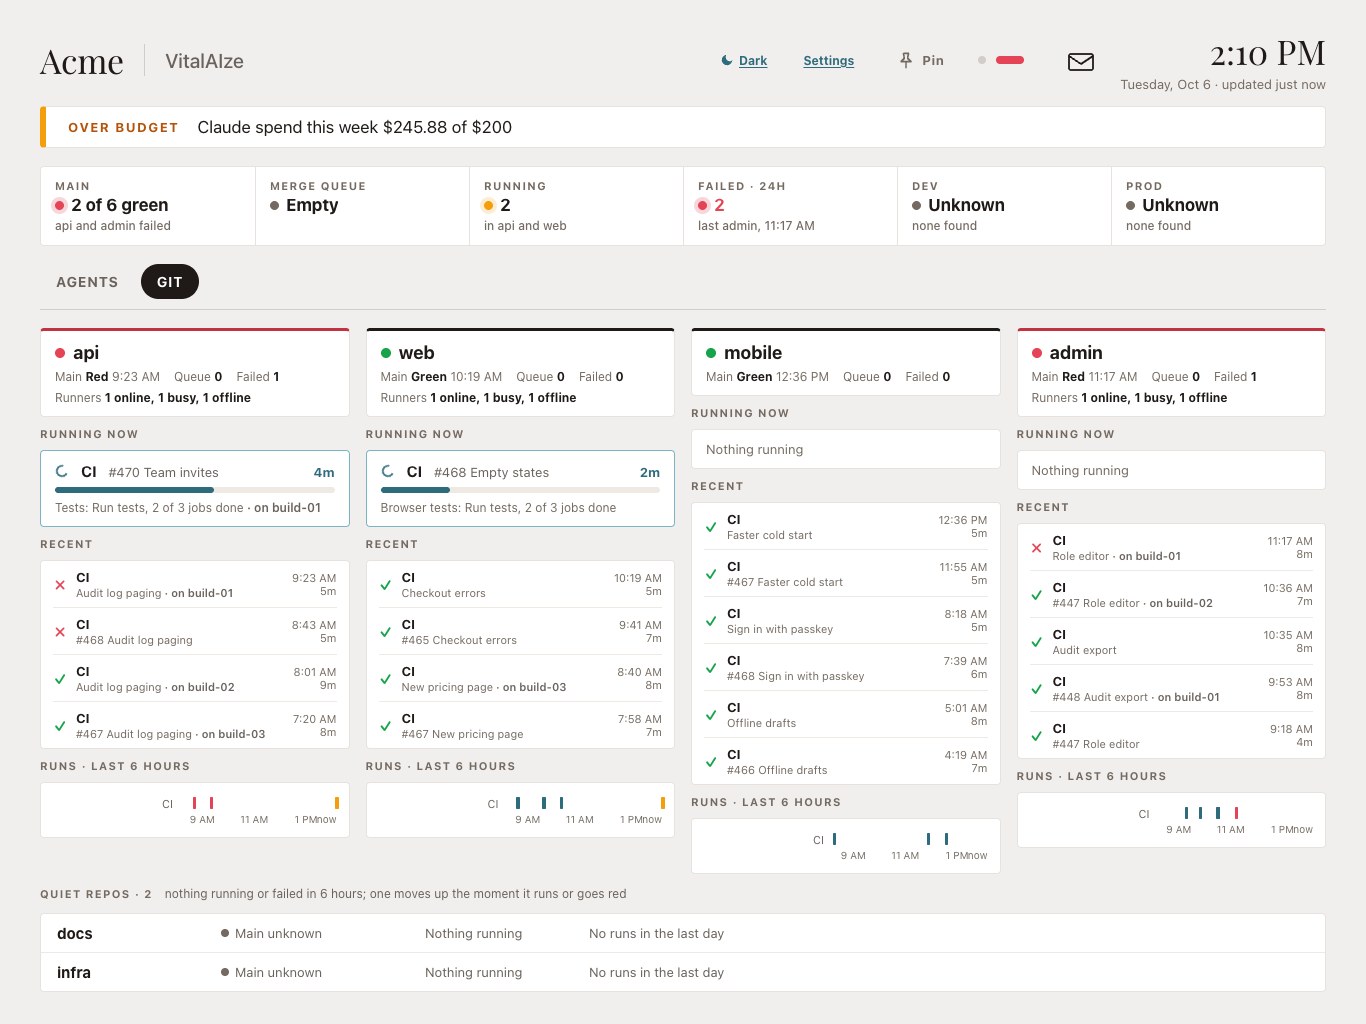
Each repository shows its own workflows. Its timeline has one row for each workflow that ran in the last 6 hours, up to six rows: the rows you named for it first, then every other workflow that ran, the latest first, under its own name. Past six it says how many more workflows ran, and when nothing ran it says "No runs in the last 6 hours". A repository can have its own gate, dev and prod workflows; see Settings.
Tap a repository, in a column or a quiet line, for its details: every workflow's recent runs, its merge queue, its failures in the last day and its open pull requests.

From 0.4.0, tap any run, in a column or in a repository's details, for its panel: the workflow, its state and how long it ran; the branch, the commit, what started it and who; and each job in the order it ran, with its state, its time, the runner it ran on, the step that failed or the step a running job is on. A link opens the run on GitHub. The panel closes with a tap outside it or its close button, and opened over a repository's details it goes back to them.

From 0.4.0, if some jobs run on your own machines (self-hosted runners), the board says so. A run your machines worked on reads "on" and the runner's name, up to three names, or "on 30 of your runners" past that, and in the run panel a job on your own runner is marked "your machine". A job counts as yours when it carries the self-hosted label (in any letter case), or when its runner is in GitHub's list of the repository's runners. A repository's column counts its runners, such as "Runners 2 online, 1 busy", and its details list each one as online, busy or offline, with the job it is running. Runners that ran the repository's jobs in the last day but that nothing reports, such as runners made for a single job, are counted on one line with the reason. That state comes from GitHub when the board's GitHub login has admin rights on the repository, and otherwise from a collector on the runner's machine. When neither can tell, the board says the state is not known, and why.
Every session is saved in a small SQLite database on the machine that runs the board, so you can look back at any one: what it cost, what tools it used, what it changed. Tap Archive at the top of the Agents tab. From 0.4.0 a session's details also show the CI minutes its pushes caused, such as "4 runs, 2 failed · 5 on your own machines", and the minutes beside each pull request it opened.
A chart per measure, one bar per day: spend, tokens, cache hits, failed tool calls, lines added, GitHub run times, CI minutes and more. Hover over or tap any bar for its value. Tap Trends at the top of the Agents tab.
From 0.4.0, a Shipped section has three cards: merged pull requests per day (with sessions per merged pull request under it), Claude's cost per merged pull request, and tokens per merged pull request with Claude and Codex added together. Each says how many merged pull requests it could match to a session, such as "102 of 105 matched to sessions". A session counts toward a pull request when it opened it, or when it worked on the pull request's branch in the same repository before the merge; a session behind several pull requests splits its cost evenly between them. If you use both Claude and Codex, a row compares them, starting with how many tokens each spends per merged pull request.
CI minutes count GitHub Actions time the way GitHub bills it: each job rounded up to a whole minute, a Windows minute counted as 2 and a macOS minute as 10. GitHub's standard runners are free on public repositories, so those minutes are shown apart. Runner time is split into GitHub's machines and your own, and "Paid minutes avoided" counts what your own machines saved on private repositories (see Your own CI machines).


If your agents use Korium, Trends also shows how often their memory searches find something, how many saves work, and how often code searches hit.
Production health checks from New Relic: one big check and a row of smaller ones. See new_relic on the Settings page.
When a newer VitalAIze is out, a note next to Settings says "Version 0.5.0 is available" (or whichever it is) and links to it. The board asks GitHub once a day. To turn it off, see updates on the Settings page.
Switch with the button next to Settings. Each device keeps its own choice.

Claude costs use the API list prices in usage.prices. On a Claude plan your bill is different, so read the dollars as a measure of work. Codex runs on a plan rather than per-token prices, so its cards show tokens and plan use instead.