default style of 3D plot #10969
Description
Bug report
Bug summary
This is not exactly a bug but more about style. I copied a snippet from here and run it but didn't get the desired style.
Code for reproduction
#!/usr/bin/evn python

import numpy as np
import scipy.linalg
from mpl_toolkits.mplot3d import Axes3D
import matplotlib.pyplot as plt

# some 3-dim points
mean = np.array([0.0, 0.0, 0.0])
cov = np.array([[1.0, -0.5, 0.8], [-0.5, 1.1, 0.0], [0.8, 0.0, 1.0]])
data = np.random.multivariate_normal(mean, cov, 50)

# regular grid covering the domain of the data
X, Y = np.meshgrid(np.arange(-3.0, 3.0, 0.5), np.arange(-3.0, 3.0, 0.5))
XX = X.flatten()
YY = Y.flatten()

order = 1  # 1: linear, 2: quadratic
if order == 1:
    # best-fit linear plane
    A = np.c_[data[:, 0], data[:, 1], np.ones(data.shape[0])]
    C, _, _, _ = scipy.linalg.lstsq(A, data[:, 2])  # coefficients

    # evaluate it on grid
    Z = C[0] * X + C[1] * Y + C[2]

    # or expressed using matrix/vector product
    #Z = np.dot(np.c_[XX, YY, np.ones(XX.shape)], C).reshape(X.shape)

elif order == 2:
    # best-fit quadratic curve
    A = np.c_[np.ones(data.shape[0]), data[:, :2],
              np.prod(data[:, :2], axis=1), data[:, :2]**2]
    C, _, _, _ = scipy.linalg.lstsq(A, data[:, 2])

    # evaluate it on a grid
    Z = np.dot(np.c_[np.ones(XX.shape), XX, YY, XX * YY, XX**2, YY**2],
               C).reshape(X.shape)

# plot points and fitted surface
fig = plt.figure()
ax = fig.gca(projection='3d')
ax.plot_surface(X, Y, Z, rstride=1, cstride=1, alpha=0.2)
ax.scatter(data[:, 0], data[:, 1], data[:, 2], c='r', s=50)
plt.xlabel('X')
plt.ylabel('Y')
ax.set_zlabel('Z')
ax.axis('equal')
ax.axis('tight')
plt.show()
Actual outcome

Expected outcome
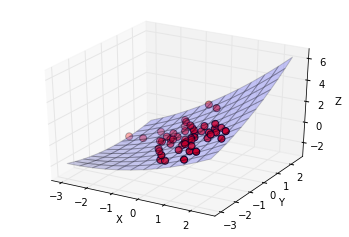
The style between the two are very different: the grid color, the wireframe, the surface color, etc. Is the style of this image from previous version of matplotlib? If so, how could I get that style?
Matplotlib version
- Operating system: Linux Mint 18.3
- Matplotlib version: 2.2.2
- Matplotlib backend (
print(matplotlib.get_backend())): Qt4Agg - Python version: 2.7.12
- Jupyter version (if applicable):
- Other libraries:
○ → pip freeze
alabaster==0.7.7
appdirs==1.4.3
apptools==4.3.0
args==0.1.0
asteval==0.9.12
astor==0.6.2
attrs==15.2.0
autobahn==0.10.3
autoflake==1.1
Babel==1.3
backports.functools-lru-cache==1.5
BeautifulSoup==3.2.1
blinker==1.3
ccsm==0.9.12.3
chaco==4.5.0
chardet==2.3.0
clint==0.5.1
compizconfig-python==0.9.12.3
configglue==1.1.2
configobj==5.0.6
configparser==3.5.0
cryptography==1.2.3
cycler==0.10.0
debtags==2.0
decorator==4.0.6
defer==1.0.6
dirspec==13.10
docutils==0.12
duplicity==0.7.6
ecdsa==0.13
enable==4.5.1
enum34==1.1.2
envisage==4.4.0
feedparser==5.1.3
flake8==3.5.0
fonttools==3.0
futures==3.0.5
gitdb==0.6.4
GitPython==1.0.1
httplib2==0.9.1
hy==0.14.0
idna==2.0
importmagic==0.1.7
ipaddress==1.0.16
ipython==2.4.1
isort==4.3.4
jedi==0.11.1
Jinja2==2.8
kiwisolver==1.0.1
lmfit==0.9.9
lockfile==0.12.2
lxml==3.5.0
lz4==0.7.0
Mako==1.0.3
MarkupSafe==0.23
matplotlib==2.2.2
mayavi==4.4.3
mccabe==0.6.1
minieigen==0.5.3
mpi4py==1.3.1
msgpack-python==0.4.6
netifaces==0.10.4
nose==1.3.7
numpy==1.14.2
oauthlib==1.0.3
oneconf==0.3.9
PAM==0.4.2
pandas==0.22.0
paramiko==1.16.0
parso==0.1.1
pbr==4.0.0
pexpect==4.0.1
Pillow==3.1.2
piston-mini-client==0.7.5
protobuf==2.6.1
psutil==3.4.2
ptyprocess==0.5
pyasn1==0.1.9
pyasn1-modules==0.0.7
pycodestyle==2.3.1
pycrypto==2.6.1
pycups==1.9.73
pycurl==7.43.0
pyface==4.5.2
pyflakes==1.6.0
Pygments==2.1
pygobject==3.20.0
pygpgme==0.3
pygraphviz==1.3.1
pygts==0.3.1
pyinotify==0.9.6
PyJWT==1.3.0
pyOpenSSL==0.15.1
pyparsing==2.2.0
pyparted==3.10.7
pyserial==3.0.1
pysmbc==1.0.15.5
Pyste==0.9.10
python-apt==1.1.0b1+ubuntu0.16.4.1
python-bibtex==1.2.7
python-dateutil==2.7.2
python-debian==0.1.27
python-snappy==0.5
python-xlib==0.14
pytz==2018.3
pyxdg==0.25
reportlab==3.3.0
roman==2.0.0
rply==0.7.5
scipy==1.0.1
service-identity==16.0.0
setproctitle==1.1.8
simplegeneric==0.8.1
six==1.11.0
smmap==0.9.0
Sphinx==1.3.6
sphinx-rtd-theme==0.1.9
stevedore==1.28.0
subprocess32==3.2.7
traits==4.5.0
traitsui==4.5.1
trollius==2.0.1
Twisted==16.0.0
txaio==1.0.0
uTidylib==0.2
virtualenv==15.2.0
virtualenv-clone==0.3.0
virtualenvwrapper==4.8.2
wxPython==3.0.2.0
wxPython-common==3.0.2.0
yapf==0.21.0
zope.interface==4.1.3
I installed matplotlib via pip in a virtual environment.