Leam User Interface
The three key components of the Leam interface are a Data View, a Chart View, and a Code Editor. Leam also has a dropdown-style operations menu within it's menubar. The following figure captures the interface compoments.
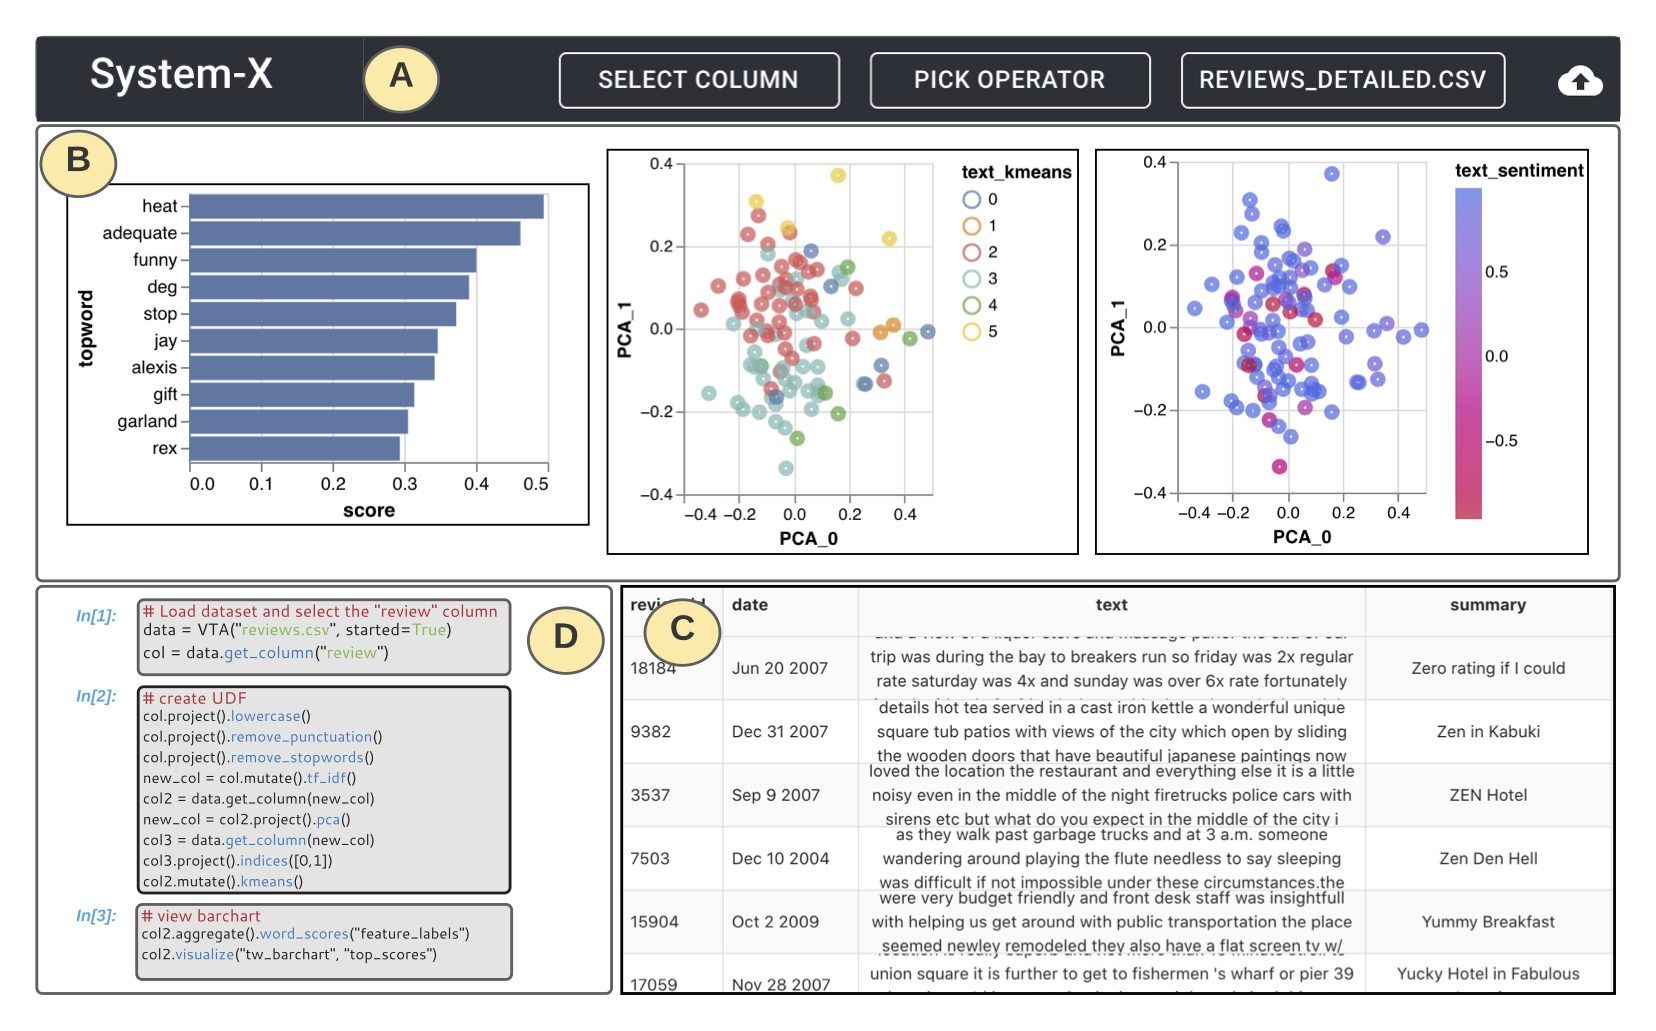
You can use the buttons in the app bar to upload a dataset and once you see your data available in the Table View, you can apply some common operators through the Pick Operator buttons on a column that you specify by choosing in the Select Column dropdown. We explain these operator here (???TODO???)
This is a carousel view of different visualizations that you create. Some visualizations can be created using the dropdown buttons in the Operations Menu, but all of the visualization customization is available through the Code Editor interface.
This is the spreadsheet-style view of the data, where you can see your raw data as it is updated. This view can be coordinated with other visualizations.
This is the computational notebook-style editor where you can run any python code and are provided with several libraries including a set of visual text algebra-base operator library accessible through the VITAL api (???TODO???). The editor lets you write multi-line python code. You can edit the code in the cell normally, and press Shift+Enter to run the command.