
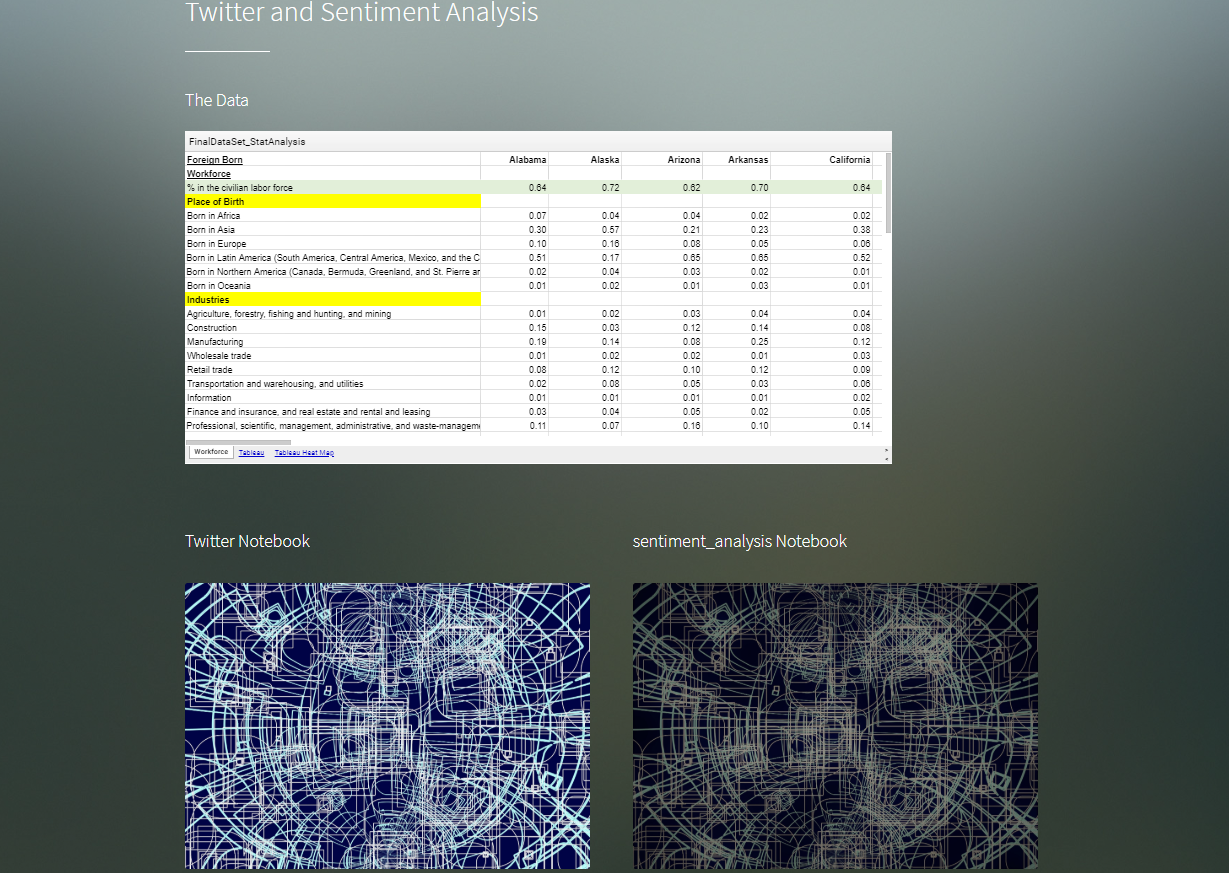
Project Final: Migration statistics in the United States, a machine learning model. Utilizing Migration Policy Institute, Migration Data Hub: https://www.migrationpolicy.org/programs/migration-data-hub and United Nations: Population Division: International Migration http://www.un.org/en/development/desa/population/migration/data/index.shtml>
Based on certain characteristics we will determine the likelihood of employment for an immigrant.
The initial idea originated from Stanford scholars develop new algorithm to help resettle refugees and improve their integration.
We will attempt to analyze and visualize migration over a period of time. This project will use machine learning technology, most likely Sci-Kit Learn.
Additionally, we may use Python Pandas, Python Tweepy, HTML/CSS/Bootstrap, Javascript D3.js, MySQL Database, and Tableau to analyze and visualize this topic.
All: data cleaning
All: analysis

Yanjun: sentiment analysis at state or county level with tweepy. For or against?, visualization, ml
Patricia: machine learning model, visualization
Y employment
X everything else, All indicators
Melinda:
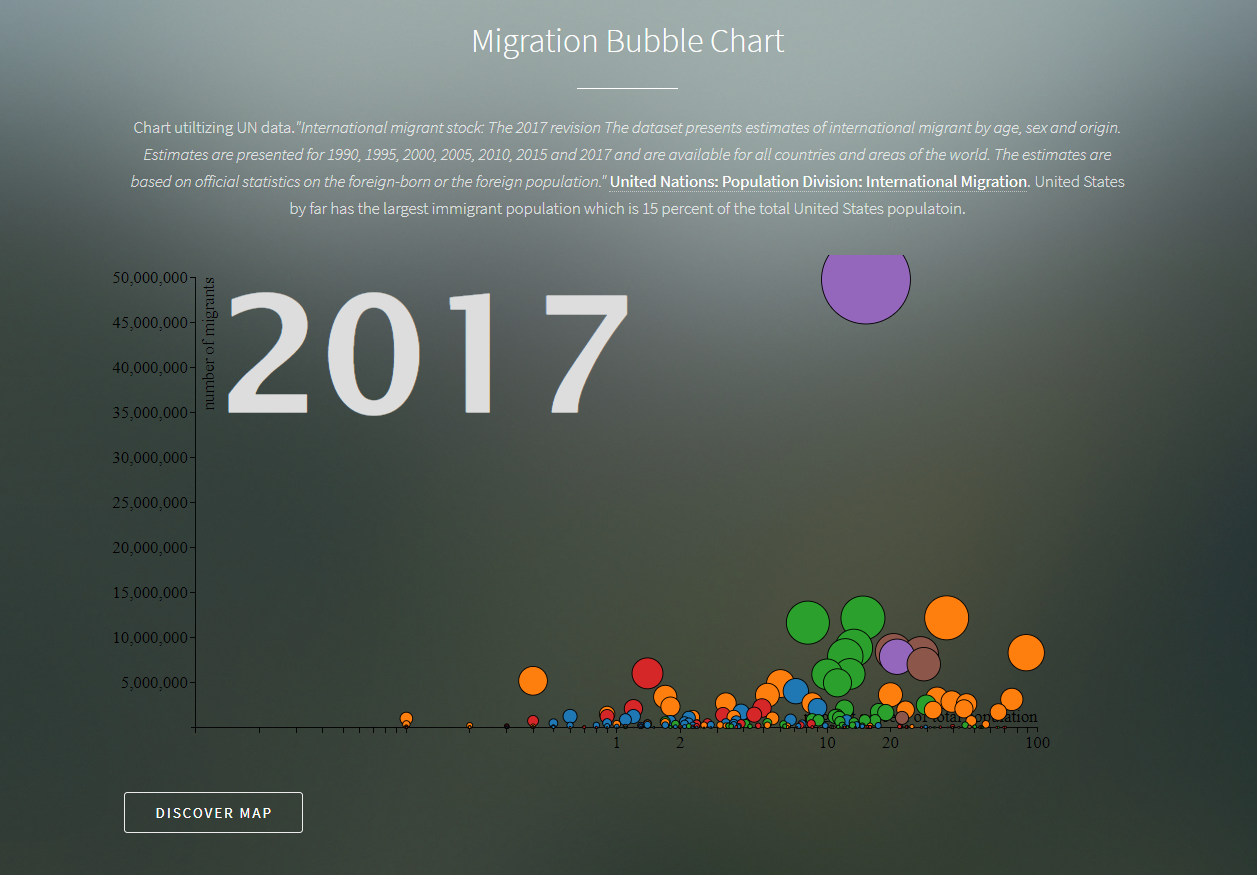
Chart utiltizing UN data."International migrant stock: The 2017 revision
The dataset presents estimates of international migrant by age, sex and origin. Estimates are presented for 1990, 1995, 2000, 2005, 2010, 2015 and 2017 and are available for all countries and areas of the world. The estimates are based on official statistics on the foreign-born or the foreign population." United Nations: Population Division: International Migration. United States, by far, has the largest immigrant population which is 15 percent of the total United States populatoin.
The chart x axis = "migrant percent of total population" and y axis = "number of migrants", Bubble size = population, Grouping color by region
Sean:
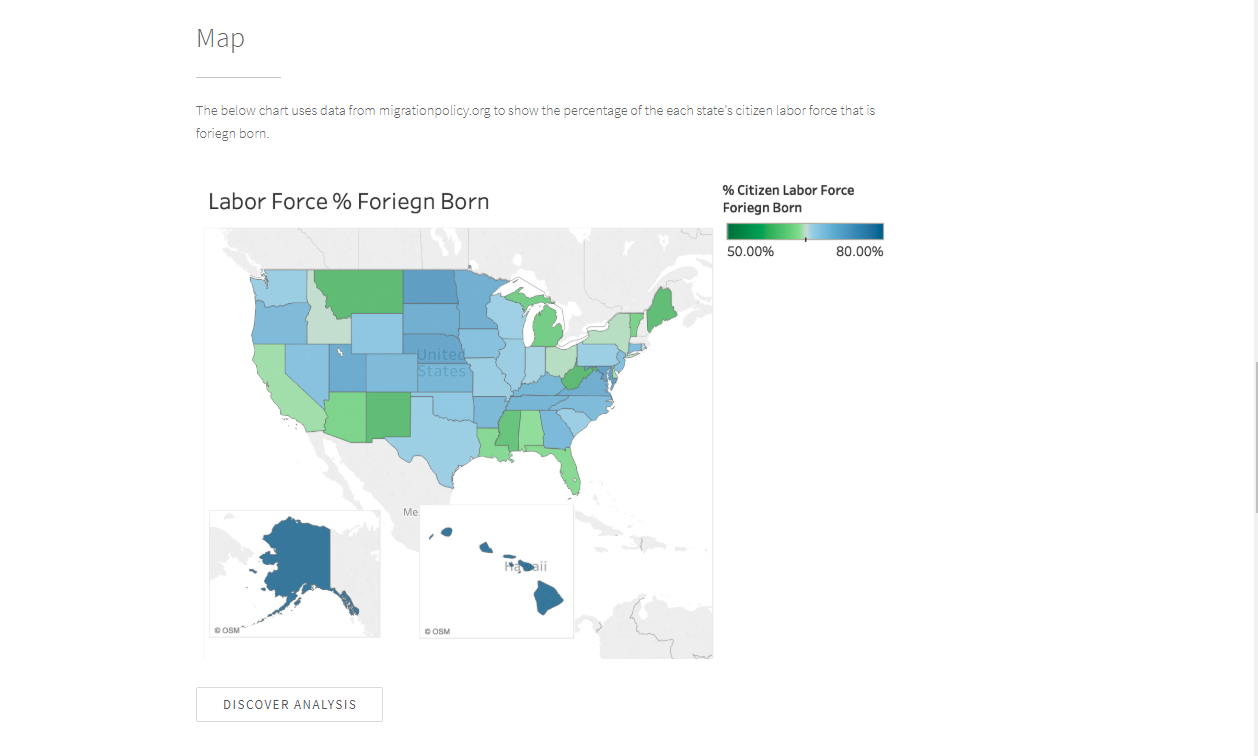
The below chart uses data from migrationpolicy.org to show the percentage of the each state's citizen labor force that is foriegn born.
Resources: Migration Policy Institute, Migration Data Hub: https://www.migrationpolicy.org/programs/migration-data-hub and United Nations: Population Division: International Migration http://www.un.org/en/development/desa/population/migration/data/index.shtml>
All: clean data; scrap every state
Data cleaning breakout:
1 CJ Alabama - AL
2 CJ Alaska - AK
3 CJ Arizona - AZ
4 CJ Arkansas - AR
5 CJ California - CA
6 CJ Colorado - CO
7 CJ Connecticut - CT
8 CJ Delaware - DE
9 CJ Florida - FL
10 CJ Georgia - GA
11 yz Hawaii - HI
12 yz Idaho - ID
13 yz Illinois - IL
14 yz Indiana - IN
15 yz Iowa - IA
16 yz Kansas - KS
17 yz Kentucky - KY
18 yz Louisiana - LA
19 yz Maine - ME
20 yz Maryland - MD
21 sc Massachusetts - MA
22 sc Michigan - MI
23 sc Minnesota - MN
24 sc Mississippi - MS
25 sc Missouri - MO
26 sc Montana - MT
27 sc Nebraska - NE
28 sc Nevada - NV
29 sc New Hampshire - NH
30 sc New Jersey - NJ
31 pe New Mexico - NM
32 pe New York - NY
33 pe North Carolina - NC
34 pe North Dakota - ND
35 pe Ohio - OH
36 pe Oklahoma - OK
37 pe Oregon - OR
38 pe Pennsylvania - PA
39 pe Rhode Island - RI
40 pe South Carolina - SC
41 mw South Dakota - SD
42 mw Tennessee - TN
43 mw Texas - TX
44 mw Utah - UT
45 mw Vermont - VT
46 mw Virginia - VA
47 mw Washington - WA
48 mw West Virginia - WV
49 mw Wisconsin - WI
50 mw Wyoming - WY
51 mw DC
De-Mystifying ML Find a Problem worth Solving, Analyzing, or Visualizing Use ML in the context of technologies learned You must use:
- Sci-Kit Learn and/or another machine learning library You must use at least two of the below
- Python Pandas
- Python Matplotlib
- Python Tweepy
- Python Flask
- HTML/CSS/Bootstrap
- JavaScript Plotly
- Javascript D3.js
- JavaScript Leaflet
- MySQL Database
- MongoDB Database
- Google Cloud SQL
- Amazon AWS
- Tableau
Prepare a 15 minute “data deep dive” or “infrastructure walkthrough” that shows machine learning the context of what we’ve already learned.
Example Projects:
Create a Front-End Interface that Maps to an API to “Smarten” the Algorithm
Perform a Deep Dive of Existing Data Using Machine Learning
Create a Visualization that Continues to “Learn” Where Clusters Lie Based on ML (Use D3 or Plotly to Change the Visualization)
Create an idea with “mock data” that simulates how machine learning might be used
Create an analysis of existing data to make a prediction, classification, or regression
The key is to show the value of what you know.