Repository navigation
v0.2.0

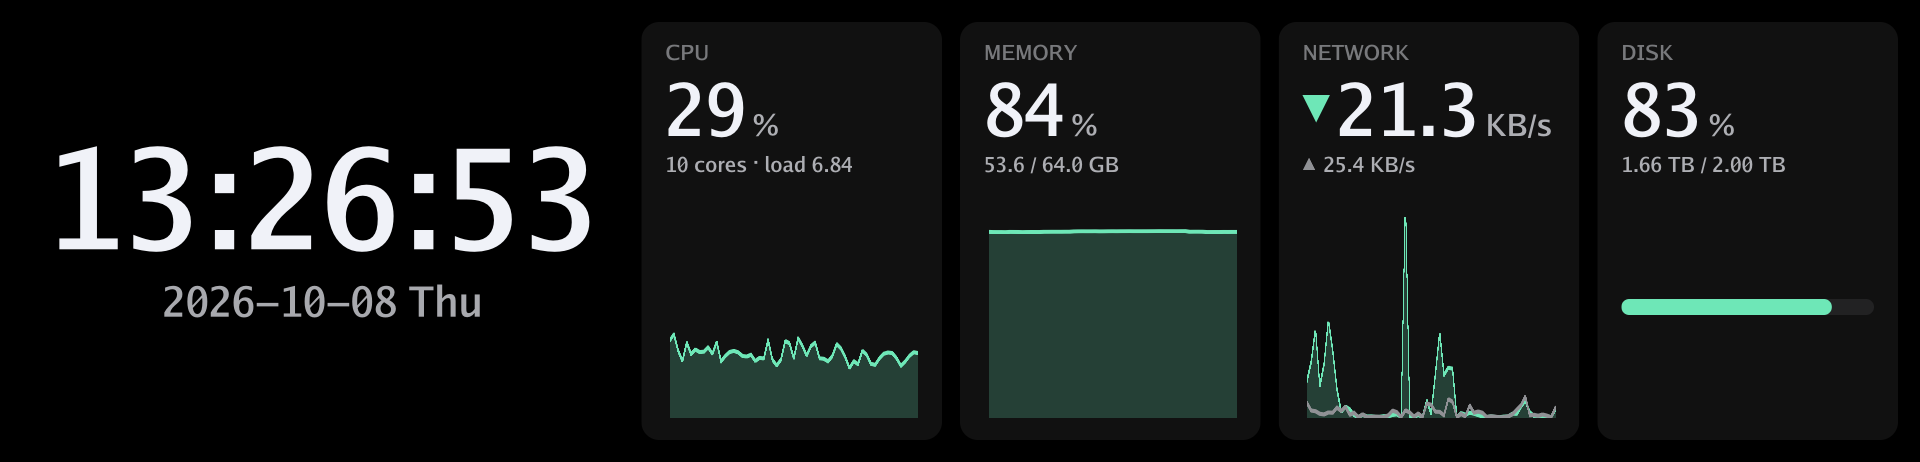
Adds a dashboard that shows the time next to CPU, memory, network and disk use, and lets the clock show Japanese and other non-Latin text.
(日本語は下にあります)
Highlights
- System dashboard:
ssp dashboardshows the time next to panels for CPU, memory, network and disk use. CPU, memory and network come with a graph of the last minute. The network panel shows the download speed with the upload speed below it, and the disk panel the space used on the system disk.--widgets clock,cpu,networkpicks and orders the panels (1 to 6 ofclock,cpu,memory,network,disk).[startup] show = "dashboard"shows it whenever a display connects;[dashboard]keeps the panels and colors (color,accent,background).POST /api/v1/displays/{id}/dashboardswitches to it from your own programs.
- Japanese (and other) text: characters the built-in font lacks are drawn with a font installed on the system: Hiragino on macOS, Yu Gothic or Meiryo on Windows, Noto Sans CJK and similar on Linux.
- Weekday names:
[clock] weekdays(alsossp clock --weekdaysandweekdaysin the API) takes seven names from Sunday that%aand%Aprint instead of the English ones, e.g. fordate_format = "%Y年%m月%d日(%a)".
For developers
cargo run -p ssp-server --example render -- dashboard out.pngdraws a built-in screen into a PNG without a display (clockordashboard;--configand--seconds).
Notes
- On Linux, install a CJK font (e.g. the
fonts-noto-cjkpackage) if Japanese does not show. - Tested with the D92 on macOS (Apple Silicon). The x86_64 builds of Linux and Windows have still not been tried with a display. Reports with the output of
ssp selftestare welcome.
Install or update
curl -fsSL https://subscreen.dev/install.sh | sh              # macOS, Linux
powershell -c "irm https://subscreen.dev/install.ps1 | iex"   # Windows
Running the installer again updates ssp; then restart the daemon (see Autostart: ssp service install again on macOS, systemctl --user restart sub-screen-player on Linux). The archives are also attached below (checksums in SHA256SUMS.txt).
Full changelog: v0.1.1...v0.2.0
日本語
時刻と一緒に CPU・メモリ・ネットワーク・ディスクの使用状況を表示するダッシュボードを追加し、時計で日本語などの文字を表示できるようにしました。
主な変更
- システムダッシュボード:
ssp dashboardで、時刻と、CPU・メモリ・ネットワーク・ディスクのパネルを並べて表示します。CPU・メモリ・ネットワークには直近1分のグラフが付きます。ネットワークのパネルはダウンロードの速度と、その下にアップロードの速度を、ディスクのパネルはシステムのディスクの使用量を表示します。--widgets clock,cpu,networkで、表示するパネルと順番を選べます(clock・cpu・memory・network・diskから1〜6個)。[startup] show = "dashboard"で、ディスプレイの接続時に表示します。[dashboard]でパネルと色(color・accent・background)を保存できます。- 自作のプログラムからは
POST /api/v1/displays/{id}/dashboardで切り替えられます。
- 日本語などの文字: 内蔵フォントにない文字を、OS に入っているフォント(macOS はヒラギノ、Windows は游ゴシックやメイリオ、Linux は Noto Sans CJK など)で描くようになりました。
- 曜日の名前:
[clock] weekdays(ssp clock --weekdays、API のweekdaysでも可)に日曜日から順に7つの名前を書くと、%aと%Aがその名前になります。例えばdate_format = "%Y年%m月%d日(%a)"と組み合わせて使います。
開発者向け
cargo run -p ssp-server --example render -- dashboard out.pngで、ディスプレイなしで組み込み画面を PNG に書き出せます(clockかdashboard。--configと--secondsも使えます)。
補足
- Linux で日本語が表示されない場合は、CJK のフォント(
fonts-noto-cjkパッケージなど)を入れてください。 - D92 を使い、macOS(Apple Silicon)で確認しました。x86_64 版の Linux と Windows は、まだ実機で試していません。
ssp selftestの出力を添えた報告を歓迎します。
インストール・更新
curl -fsSL https://subscreen.dev/install.sh | sh              # macOS・Linux
powershell -c "irm https://subscreen.dev/install.ps1 | iex"   # Windows
インストーラーをもう一度実行すると ssp が更新されます。そのあとデーモンを再起動してください(自動起動を参照。macOS はもう一度 ssp service install、Linux は systemctl --user restart sub-screen-player)。下のアセットからアーカイブをダウンロードすることもできます(チェックサムは SHA256SUMS.txt)。
変更の一覧: v0.1.1...v0.2.0